
The Efficiency Comparison of Hydro Turbines for Micro Power Plant from Free Vortex

Department of Mechanical Engineering, Faculty of Engineering, KhonKaen University, KhonKaen 40002, Thailand
*
Author to whom correspondence should be addressed.
Energies 2021, 14(23), 7961; https://doi.org/10.3390/en14237961
Submission received: 4 November 2021
/
Revised: 16 November 2021
/
Accepted: 22 November 2021
/
Published: 29 November 2021
(This article belongs to the Section B: Energy and Environment)
Abstract
:In this research paper, the relationship between a crossflow turbine and propeller turbine size changes and the pond size in a free vortex power generation system was investigated. This relationship can be written in the form of a new mathematical equation using the principles of the response surface methodology (RSM) method. This study aimed to compare the efficiency of a crossflow turbine and propeller turbine to enhance a micro power plant from free vortex. The pond size in a micro power plant from free vortex was 1 m in diameter and 0.5 m in height with a 0.2 m outlet drain at the bottom. All turbines were tested at different water flowrates of 0.2, 0.3, 0.4, 0.5, and 0.6 m3/s to identify the rpm, water head, voltage, and electric current to access the waterpower, power output, and overall efficiency. At a 0.02 m3/s water flowrate, the crossflow turbine had greater overall efficiency than the propeller turbine, reaching 9.09% efficiency. From the comparison of the results of the two turbines used in the 0.5 m high cylinder-shaped generator pond, the turbine type, turbine size (height and diameter), number of blades, and water flowrate are key factors that affect the overall efficiency. The crossflow turbine can achieve greater efficiency than the propeller turbine in this generator system.
1. Introduction
Environment management is one of the key aspects of hydro-power development in acquiring sustainable energy [1]. According to modern studies, situations, and problems of power consumption from around the world, there will be power shortages and massive impacts from pollution in the near future. Hence, alternative sources of power are urgently needed. Hydropower, for instance, is one of best choices for alternative energy. It is also considered to be “clean energy” without any harms to the environment. The environmental impacts from small hydro-power plants were investigated and evaluated by use of the matrix of impacts. It provides guidelines for selecting the most appropriate action model proposed and proposing preventive, eliminating, minimizing, and offsetting the impact of the proposed activities on the environment. The results were used as parameters in order to maximize the benefit of these kinds of power plant [2]. There are also many studies and developments on hydroelectricity, innovations in the transportation business and power industries, such as research on the development of a hydropower turbine using seawater from a fish farm [3].
Since 71% of the Earth’s surface is covered with water, hydroelectricity has recently become one of the most interesting technologies for harvesting unlimited power from natural water sources, in addition to harvesting power from the sun and the wind. Moreover, water is one of the cheapest sources of power that emits 0% carbon dioxide [4]. A micro generator system can be designed from waterpower to generate enough power for houses, a plantation, and a small village [5]. One important advantage of this micro-power generator system is that the electric power output can be predicted via weather forecasting [6], and it has a positive impact on the environment [7]. This has promoted wide interest in seeking the most efficient technology to gather power form water sources. Although there are several large practical hydroelectric power plants around Europe, they are still considered harmful to the environment [8]. Hence, harvesting electric energy from small and all-year free-flow water sources is an alternative way to find clean energy. Currently, there are two ways to produce electric power from small water sources: the bypass method and the open canal method. The bypass method channels or bypasses water from an irrigation canal into a power generator system. The open canal method is to install a power generator system into a canal. The advantage of the bypass method is that the expelled water from the system directly returns to the canal and can later be consumed or used. Many researchers and inventors are now interested in this method. They are now applying the free-flow vortex pattern as a source of kinetic power to drive the generator. Kinetic power is generated from the vortex that flows vertically from above the gravitational vortex power turbine in a cylinder-shaped housing with drainage at the bottom. This system can speed up the water flow and transform it into kinetic power to propel the turbine [9,10]. In this field of study, Franz Zotloterer was the first to develop a vortex-powered generator [11]. He built the low-head power plant driven by kinetic power from a free-flow vortex through a cylinder-shaped hydroelectric generator. Free vortex flow current is a kind of mechanical energy generated from the fluid rotation force. In this system, the whole fluid mass rotates either due to the gravity or fluid pressure itself and the fluid mass rotates without any external impressed contact force. The free vortex-type water turbine, which mainly comprises a tank and a runner [12,13,14,15], generates electricity by introducing a flow of water into the tank and using the free vortex generated when the water drains from the bottom of the tank [12]. Therefore, it involves a water turbine used in the GWVPP (gravitation water vortex power plant) [11], which generates electricity with a low flowrate and a low water head [14]. Due to the compact structure, simple design, and the possibility of local fabrication, it can benefit rural areas for off-grid supply [12]. A gravitational water vortex power plant generates power by inducting free vortex flow of water into turbine electric generators. Many commercial companies have claimed 50–60% efficiency in productivity ranged from 200 W to 20 kW, whereas researchers have officially identified around 20–30%. However, there is still insufficient research and studies on the efficiency and performance of this system. There is still insufficient literature available for the technology to proceed beyond the prototyping stage [13]. The aim of this study was to enhance a micro hydroelectric generator system driven by kinetic power from a free-flow vortex. Two types of turbines (propeller and crossflow) were designed for the system and tested to identify their efficiencies. The bypass method was applied to feed the free-flow vortex to the system [11]. The researcher designed a system that controls the waterflow activity for the generator. To induce a higher waterflow speed to the system, an inlet (water path) with a narrowed-angle end was designed (see Figure 1). The generator had a cylinder-shaped housing that was 1 m in diameter and a round-shaped drainage (0.2 m in diameter). This design has been proven to induce a vortex at the fastest speed [14]. With the design of the waterflow activity, the Earth’s gravity was also applied to boost up the vortex speed inducted from low-head water sources [16,17]. This created sufficient kinetic energy to propel the turbines tested in the system.
There has been extensive research on factors that affect the hydroelectric power generator system from the free-flow vortex [18], such as studies regarding (1) the turbine housing design [19,20]; (2) the proper turbine type for free-flow vortex [21,22], the best turbine materials [23], the number of propeller blades (five blades) that achieves the most efficiency [21]; and (3) other factors involving fluid dynamics studies that affect the generator system efficiency [24,25,26]. A study on the efficiency comparison between two types of turbine blades used in a hydroelectric power generator system is a practical addition to enhance the system for better outcomes.
2. Materials and Methods
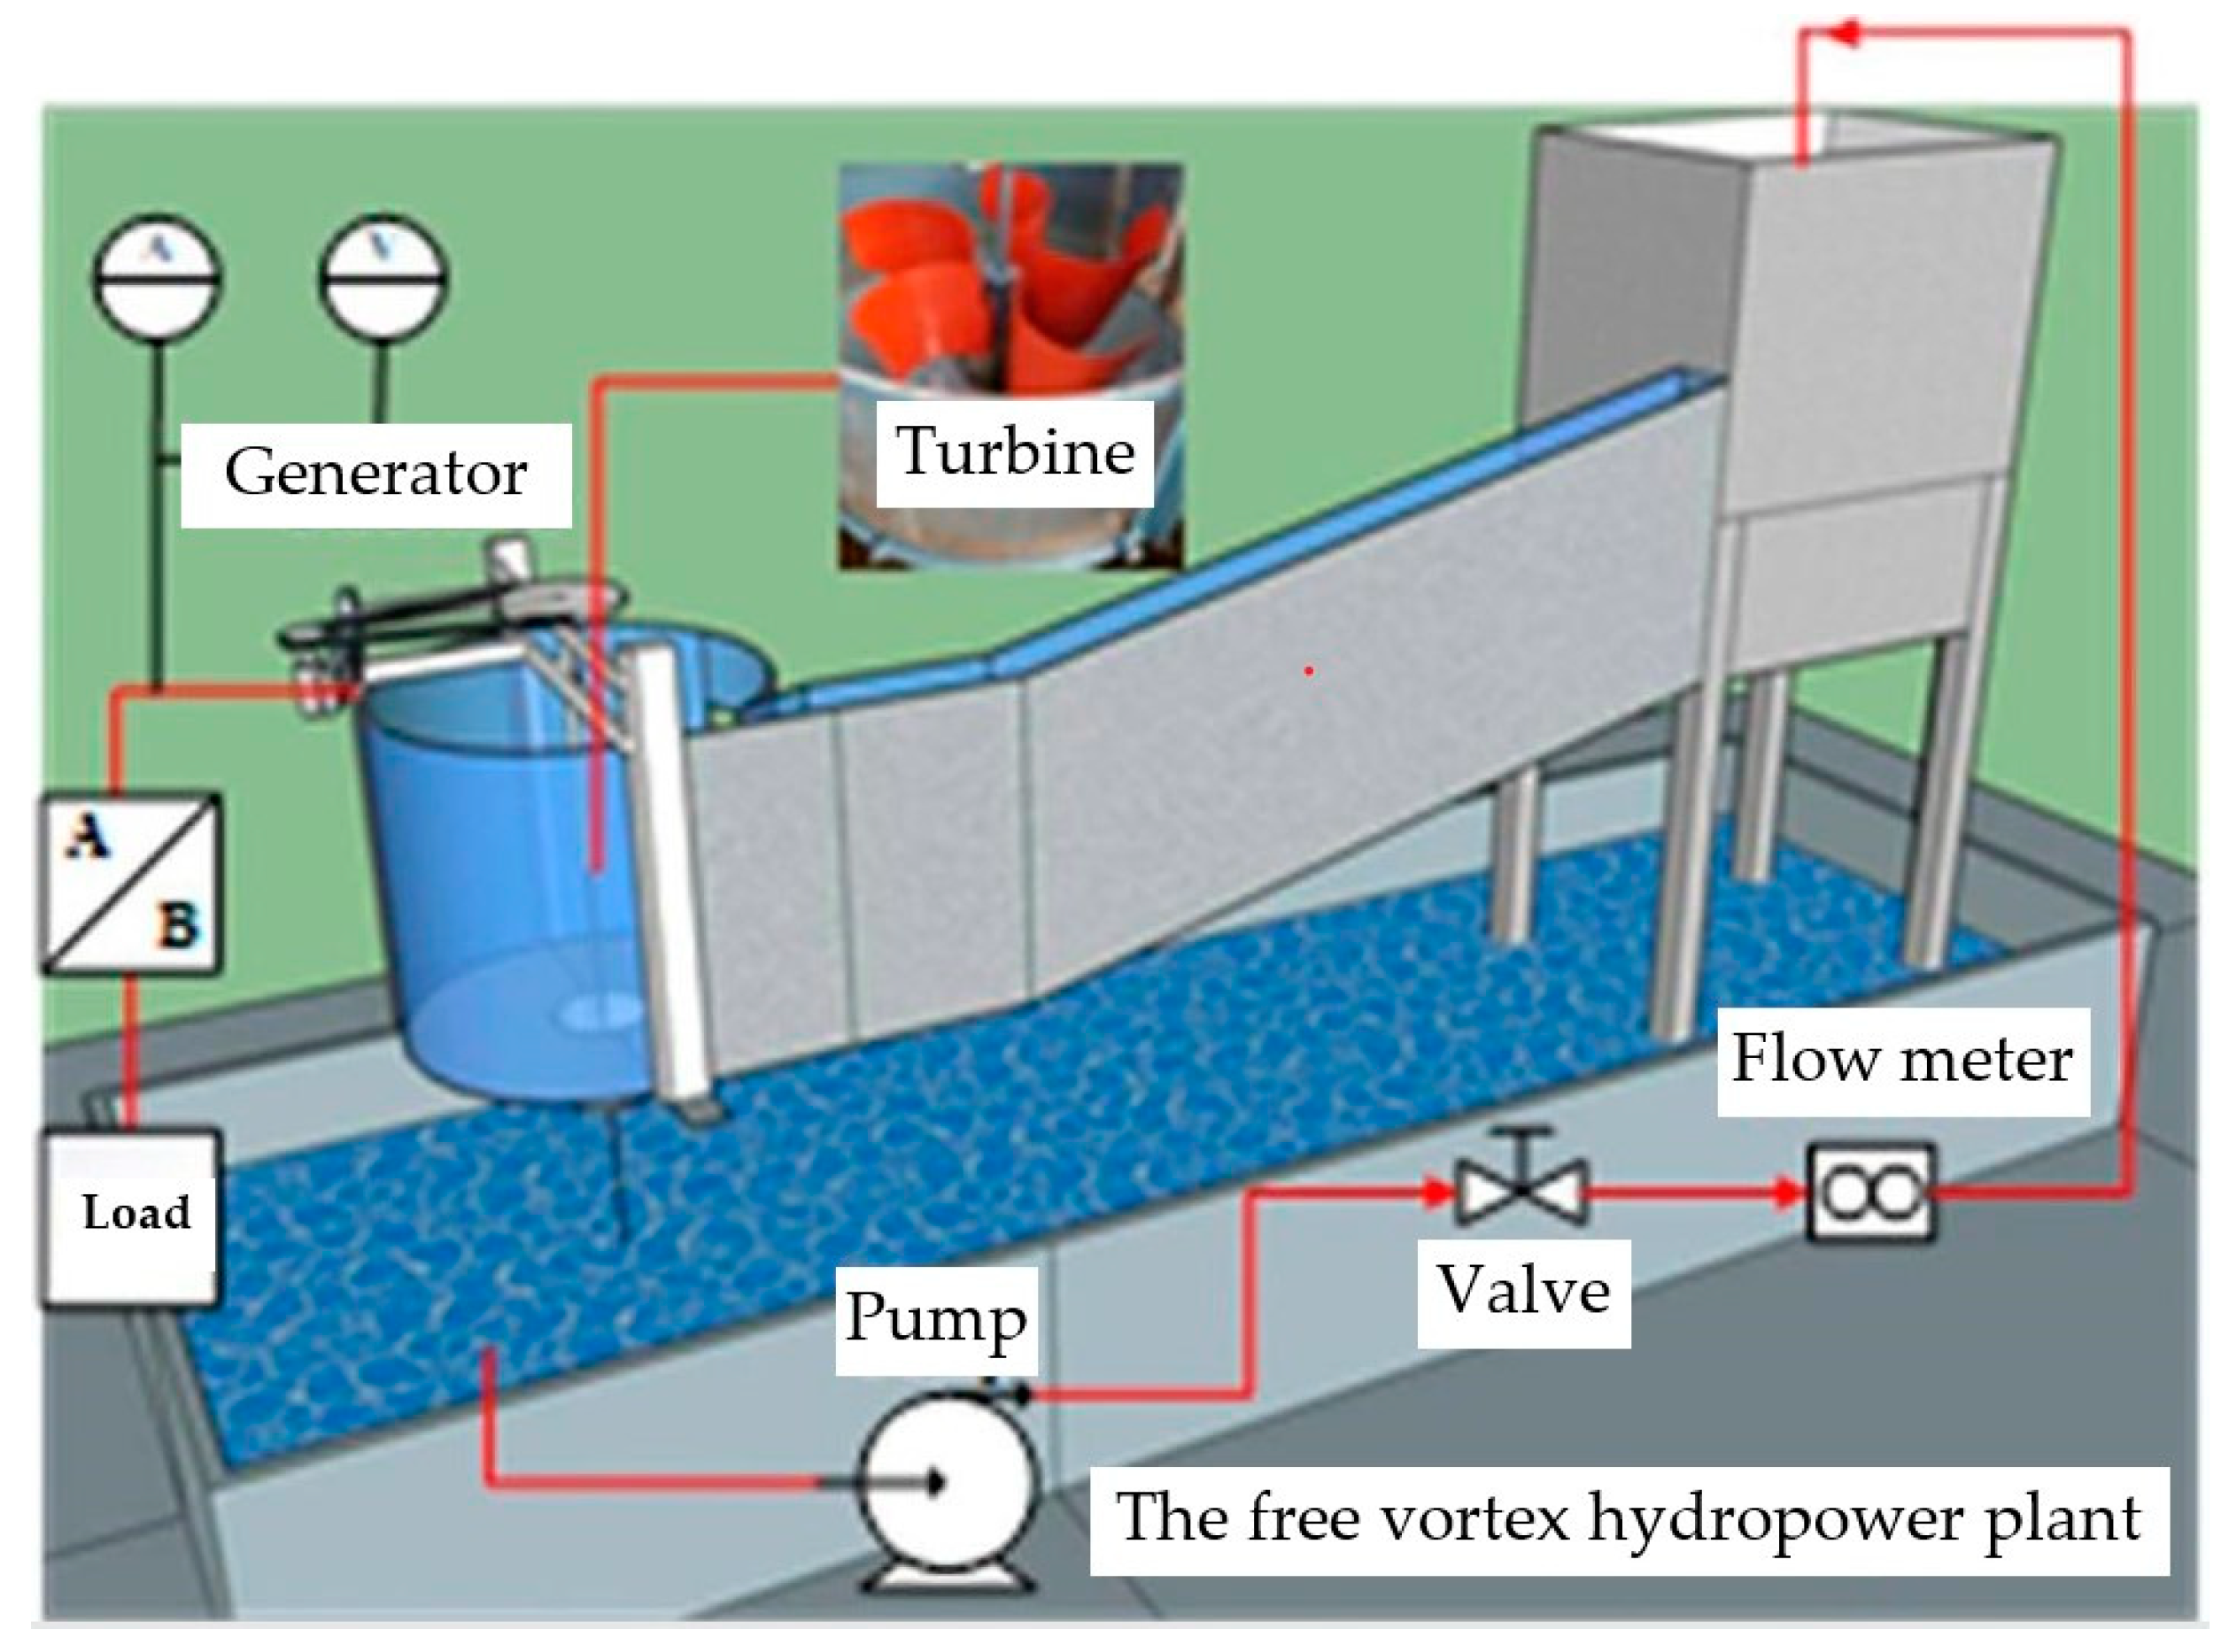
This research was performed by creating a free-flow vortex numerical simulation with a reservoir as a water source. The water inlet was designed to channel the water from a water tank and create a vortex force in the generator [21,22,23,24,25,26]. The cylinder-shaped turbine housing was 1 m in diameter and the height was 0.5 m, with a 0.2 m round-shaped drainage at the bottom. The water flowrate of the system, which ranged from 0.2 to 0.6 m3/s, was administered by an adjustable water pump (see Figure 2). The series of turbines of each type were hooked up to a transmission that linked to a power generator and a device that can read power output. The turbine testing procedures were performed as follows:
(1). In total, 12 propeller turbines with 5 blades were created (see Figure 3). They were divided into three different heights of 0.2, 0.3, and 0.4 m. At each height, there were four different turbines according to their diameters (0.4, 0.5, 0.6, and 0.7 m). Then, the 12 propeller turbines were installed in the numerical simulation. All turbines were tested at different water flowrates of 0.2, 0.3, 0.4, 0.5, and 0.6 m3/s to identify the rpm, water head, voltage, and electric current to access the waterpower, power output, and overall efficiency.
(2). The crossflow turbines were created. All 4 turbines in the initial design stage had 24 blades. Each one was different in diameter (0.4, 0.5, 0.6, and 0.7 m), with a 0.1 m blade width [27] and a 0.3 m turbine height. The four turbines were installed in the numerical simulation. All turbines were tested at different water flowrates of 0.2, 0.3, 0.4, 0.5, and 0.6 m3/s to identify the rpm, water height, voltage, and electric current to assess the waterpower, power output, and overall efficiency. When the size of the most efficient crossflow turbine was identified, a series with the number of blades varying across 12, 18, 24, 30, and 36 blades was created. Then, they were tested using the same method to identify their efficiency (see Figure 4 and Figure 5).
The most efficient turbines from each type were identified at this point. They were tested and evaluated in the same setting with the same factors to clearly observe their performances.
The response surface methodology (RSM) was applied in this research to find appropriateness in the process. The RSM is renowned and widely used in many laboratory experiments to determine the correlation between independent and dependent factors by forming equations to numerical simulate the experiment. Moreover, it can better provide levels and degrees of independent factors with satisfactory accuracy.
The appropriateness of the blade number was identified by the RSM second-order model, which is less complicated and less intricate than other RSM models [28,29]. The equation is as follows:
where y is a dependent factor; is factor i, for i = 1, 2, 3,…, k; k is the total number of factors; is the y intercept, is the Linear Effect; is the Quadratic effect; and is the cross-product effect.
From research on the hydroelectric generator system driven by the vortex force [21,22,23,24,25,26], the waterpower equation [30,31,32] is as follows:
The power output equation [31] is as follows:
The values from each equation above were processed to verify the corelated system efficiency by the equation [31], as follows:
where E is the voltage (volt, V), I is the current (Ampere, A), Pe is the electrical power (Watts, W). is the density of the water (kg/m3), g is the acceleration due to gravity (m2/s), Q is the flow rate (m3/min), N is the rotation of the shaft (rpm), and H is the water head (m).
3. Results
3.1. Propeller Turbine
The results for the 12 propeller turbines tested at different water flowrates ranging from 0.2 to 0.6 m3/s are shown as follows.
The most efficient turbine (12.47% efficiency) with a 0.5 m diameter had a 0.4 m height. It was tested at the water flowrate of 0.4 m3/s.
The most efficient turbine (12.62% efficiency) with a 0.6 m diameter had a 0.3 m height. It was tested at the water flowrate of 0.3 m3/s.
The most efficient turbine (13.92% efficiency) with a 0.7 m diameter had a 0.4 m height. It was tested at the water flowrate of 0.2 m3/s.
The most efficient turbine (13.35% of efficiency) with a 0.8 m diameter had a 0.4 m height. It was tested at the water flowrate of 0.2 m3/s.
The data from Table 1, Table 2, Table 3 and Table 4 show that the propeller turbine with a 0.7 m diameter and 0.4 m height had 13.92% efficiency at a water flowrate of 0.2 m3/s. Increasing the turbine’s height and diameter between 0.5 and 0.7 m creates more blade surface area. With more blade surface area, the turbine can handle a greater force and flow speed of the vortex [21]. This increases the efficiency of the system. Although the propeller turbine with a 0.8 m diameter had the most blade surface area, there was an amount of resistant force from the housing wall against the turbine. This was due to the closer gap between the edge of the blade and the housing wall. Therefore, the propeller turbine with a 0.8 m diameter and 0.4 m height had less efficiency than the turbine with a 0.7 m diameter at the same height (see Figure 6).
The propeller turbine size that can achieve the highest efficiency from free-flow vortex was determined by the following RSM equation:
where Y is the overall efficiency, x_1 is the water flowrate, x_2 is the blade’s height, and x_3 is the turbine’s diameter.
From the RSM equation result, Figure 7 indicates that the best blade surface providing the most efficiency comes from the propeller turbine with a 0.78 m diameter and 0.4 m height at the 0.02 m3/s water flowrate. The dark red area shows the highest value. The proper diameter length and proper water flowrate within the system can clearly increase the overall system efficiency. Comparing the values obtained from the real test and the predicted values of the regression equation to confirm the results of the mathematical model. The best blade surface obtained from the predicted value of the regression equation was 0.312 square meters and the experiment was 0.28 square meters. Both values were calculated for bias or bale values of 10.26%. The accuracy of model predictions was 89.74%.
3.2. Crossflow Turbine
In total, four crossflow turbines with 24 blades and the same height (0.3 m) were tested at water flowrates ranging from 0.02 to 0.06 m3/s. Their diameters were 0.4, 0.5, 0.6, and 0.7 m, respectively, and the overall efficiency is shown in Table 5.
Table 5 indicates that the 24-blade crossflow turbine with a 0.3 m height and 0.4 m diameter can achieve 21.91% efficiency at the 0.02 m3/s water flowrate. This can be attributed to the generator configuration. The turbine housing was laid vertically so the water flowrate was boosted by the Earth’s gravity. The design of the water flow activity within the system also increased the water flow speed, as the speed of water flowing through the drainage was faster than the speed of water flowing through the middle part of the generator. The turbine was mounted 0.02 m above the drainage to allow the turbine to obtain the full impact from the vortex. Moreover, the height of the turbine and vortex head were equal, allowing the vortex to cover all the blades’ surface (see Figure 8).
A series of five crossflow turbines with a 0.3 m height and 0.4 m diameter was tested with differing numbers of turbine blades (12, 18, 24, 30, and 36). They were all tested at water flowrates ranging from 0.02 to 0.06 m3/s. The result is shown in Figure 9.
Figure 9 reveals the correlation between the overall efficiency and water flowrates ranging from 0.02 to 0.06 m3/s. The 18-blade crossflow turbine achieved the highest efficiency (23.01%) at the 0.02 m3/s water flowrate. From the testing, the result shows that the number of blades affect the overall efficiency of this vortex-driven generator [21]. Adding more blades to the crossflow turbine decreases the overall efficiency. Although more blades provide more impact to the surface, the water flow is limited by the close distance between the blades. When the number of blades was set at 12 and 18, the turbines had greater distance between the blades. In conclusion, the 18-blade crossflow turbine could achieve the highest efficiency because the distance between the blades matched with the water flowrate.
The crossflow turbine size that can achieve greatest efficiency from the free-flow vortex was determined by the following RSM equation:
where Y is the overall efficiency, x_1 is the water flowrate, x_2 is the blade’s height, and x_3 is the turbine’s diameter.
From the RSM equation result, Figure 10 indicates that the best blade surface providing most efficiency comes from the crossflow turbine with a 0.4 m diameter and 0.3 m height at a 0.02 m3/s water flowrate. The dark red area shows the highest value. The proper diameter length and proper water flowrate within the system can clearly increase the overall system efficiency. The comparison of values obtained from the experiments has shown the correlation between predicted surface size from the regression equation and the one from the experiments. The best blade surface from the prediction was 0.12 square meters while the experiments have proved 0.12 square meters is the best. We identified 0% bias and the prediction accuracy was 100%.
3.3. The Comparison
In total, four crossflow turbines with 24 blades and the same height (0.3 m) were tested at a water flowrate ranging from 0.02 to 0.06 m3/s. The diameters of the turbines were 0.4, 0.5, 0.6, and 0.7 m, and the overall efficiency is shown in Table 5. Testing all turbines in the same setting (vortex-driven generator system) revealed that the five-blade propeller turbine with a 0.4 m height and 0.7 m diameter [21] achieved the highest efficiency of 13.92% at the 0.02 m3/s water flowrate. On the other hand, the 18-blade crossflow turbine with a 0.3 m height and 0.4 m diameter achieved the highest efficiency of 23.01% at the 0.02 m3/s water flowrate (see Figure 11).
4. Discussion and Conclusions
Verifying the right turbine size that matches the turbine housing design significantly affects the overall efficiency of a hydroelectric generator system driven by a vortex. In this study, we found that the 5-blade propeller turbine with a 0.4 m height and 0.7 m diameter achieved 13.92% efficiency at a 0.02 m3/s water flowrate, whereas the 18-blade crossflow turbine with a 0.3 m height and 0.4 m diameter achieved 23.01% efficiency at the same water flowrate. At a 0.02 m3/s water flowrate, the crossflow turbine had greater overall efficiency than the propeller, reaching 9.09% efficiency. From the comparison of the results of the two turbines used in the 0.5 m high cylinder-shaped generator housing, the turbine type, turbine size (height and diameter), number of blades, and water flowrate are key factors that affect the overall efficiency. The efficiency equation is determined by the relation of input power value, water density, gravitation force, water head, and the water flowrate. The input power of both turbine generator simulations is equal, whereas there are variations in turbine sizes and numbers of blade. Obviously, power outputs are different regarding types and sizes of turbine as well as the numbers of blades deployed in the simulation systems. The output power value comes from voltage multiplied by current from the electrical load in the systems. Then, the efficiency is processed from the output power divided by the input power multiplied by one hundred percent in each generator simulation system. The crossflow turbine can achieve greater efficiency than the propeller turbine in this generator system. The study reveals that the diameter of the water turbine blades and the number of blades affect the efficiency of water turbine in each type. Consistent with Sritram et al. [21], this proves that a water turbine with five blades is the most appropriate to use and the right distance between the blades of the turbine could maximize the exertion of water flowrate. In the test, there was an overflow of water at the top edge of the whirlpool. The height of the well was 0.5 m. As a result of such events, the efficiency of the power generation system from the free-flow vortex decreased. Considering past research that has tested the power generation system with free-vortex energy, a loss of swirl energy resulted from the overflowing water. Sritram et al. [23], Wanchat et al. [24] and Suntivarakorn et al. [26] used a propeller turbine without overflowing water from the well, which had a higher efficiency than the overflow from the well. Moreover, the test results of the crossflow turbines were the same when considering the free-flow characteristics of the vortex flow in the well of the turbine blades. The free flow of the vortex is characterized by a swirl down the Earth’s gravity. This swirl is not a characteristic that sends the energy to flow as a stream of water to affect the turbine blades. Instead, the swirl sends the energy to flow in a similar way to the electricity generated from the hydropower of the crossflow turbine. From the test, it was found that water overflowed from the top edge of the well. As a result, the total efficiency the free-vortex power generation system was 23.01% with a water height of less than 0.5 m.
Author Contributions
Conceptualization, P.S. and R.S.; methodology, P.S. and R.S.; software, P.S. and R.S.; validation, R.S.; formal analysis, P.S. and R.S.; investigation, P.S. and R.S.; resources, P.S. and R.S.; data curation, P.S. and R.S.; writing—original draft preparation, P.S.; writing—review and editing, R.S.; visualization, P.S.; supervision, R.S.; project administration, P.S. All authors have read and agreed to the published version of the manuscript.
Funding
This research received no external funding.
Institutional Review Board Statement
Not applicable.
Informed Consent Statement
Not applicable.
Data Availability Statement
Not applicable.
Acknowledgments
The researchers are grateful to the Rajamangala University of Technology Isan Surin Campus and FEAT (Farm Engineering and Automation Technology Research Group), Faculty of Engineering, Khon Kaen University for the support of equipment and support of tools used in this research.
Conflicts of Interest
The authors declare no conflict of interest.
References
- Zhang, Y.; Tang, W.; Duffield, C.; Zhang, L.; Hui, F. Environment Management of Hydropower Development: A Case Study. Energies 2021, 14, 2029. [Google Scholar] [CrossRef]
- Zeleňáková, M.; Fijko, R.; Diaconu, D.C.; Remeňáková, I. Environmental Impact of Small Hydro Power Plant—A Case Study. Environments 2018, 5, 12. [Google Scholar] [CrossRef] [Green Version]
- Rakibuzzaman, M.; Suh, S.-H.; Kim, H.-H.; Ryu, Y.; Kim, K.Y. Development of a Hydropower Turbine Using Seawater from a Fish Farm. Processes 2021, 9, 266. [Google Scholar] [CrossRef]
- International Energy Agency. Key World Energy Statistics 2017; IEA Publications; International Energy Agency: Paris, France, 2017. [Google Scholar]
- Mohibullah, M.; Radzi, A.M.; Hakim, M.I.A. Basic design aspects of micro hydro power plant and its potential development in Malaysia. In Proceedings of the PECon 2004. Proceedings. National Power and Energy Conference, Kuala Lumpur, Malaysia, 29–30 November 2004; IEEE: Piscataway, NZ, USA, 2004; pp. 220–223. [Google Scholar] [CrossRef]
- Teuteberg, B.H. Design of a Pump-as-Turbine for an Abalone Farm. Master’s Thesis, University of Stellenbosch, Stellenbosch, South Africa, 2010. [Google Scholar]
- Yaakob, O.; Ahmed, Y.; Elbatran, A.H.; Shabara, H.M. A Review on Micro Hydro Gravitational Vortex Power and Turbine Systems. J. Teknol. 2014, 69. [Google Scholar] [CrossRef] [Green Version]
- Paish, O. Micro-hydropower: Status and prospects. Proc. Inst. Mech. Eng. Part A J. Power Energy 2002, 216, 31–40. [Google Scholar] [CrossRef]
- Dhakal, S.; Nakarmi, S.; Pun, P.; Thapa, A.B.; Bajracharya, T.R. Development and Testing of Runner and Conical Basin for Gravitational Water Vortex Power Plant. J. Inst. Eng. 2014, 10, 140–148. [Google Scholar] [CrossRef] [Green Version]
- Dhakal, S.; Timilsina, A.B.; Dhakal, R.; Fuyal, D.; Bajracharya, T.R.; Pandit, H.P.; Amatya, N.; Nakarmi, A.M. Comparison of cylindrical and conical basins with optimum position of runner: Gravitational water vortex power plant. Renew. Sustain. Energy Rev. 2015, 48, 662–669. [Google Scholar] [CrossRef]
- Franz, Z. Zotloterer Gravitational Vortex Power Plant. ZOTLÖTERER SMART–Energy–Systems. 2021. Available online: http://www.zotloeterer.com/welcome/gravitation-water-vortex-power-plants (accessed on 2 August 2021).
- Niroj, D.; Radha, K.S.; Sajjan, S.; Sanam, M.; Shree, R.S.; Ajay, K.J. Performance Analysis of Booster based Gravitational Water Vortex Power Plant. J. Inst. Eng. 2020, 15, 90–96. [Google Scholar] [CrossRef]
- Rahman, M.M.; Tan, J.H.; Fadzlita, M.T.; Wan Khairul Muzammil, A.R. A Review on the Development of Gravitational Water Vortex Power Plant as Alternative Renewable Energy Resources. IOP Conf. Ser. Mater. Sci. Eng. 2017, 217, 012007. [Google Scholar] [CrossRef] [Green Version]
- Nishi, Y.; Inagaki, T. Performance and Flow Field of a Gravitation Vortex Type Water Turbine. Int. J. Rotating Mach. 2017, 2017, 2610508. [Google Scholar] [CrossRef]
- Chen, Y.-L.; Wu, C.; Ye, M.; Ju, X.-M. Hydraulic Characteristics of Vertical Vortex at Hydraulic Intakes. J. Hydrodyn. 2007, 19, 143–149. [Google Scholar] [CrossRef]
- Shi, X.M.; Yang, F.; Dai, R.; Chen, T.J.; Wu, Y.L. Simulation of free-surface vortex produced by a rotating cylindrical wall below a static barrel. IOP Conf. Ser. Earth Environ. Sci. 2012, 15, 052034. [Google Scholar] [CrossRef]
- Shabara, H.M.; Yaakob, O.B.; Ahmed, M.; Elbatran, A.H.; Muhammad, S.M. CFD Validation for Efficient Gravitational Vortex Pool System. J. Teknol. 2015, 74, 97–100. [Google Scholar] [CrossRef] [Green Version]
- Wanchat, S.; Suntivarakorn, R. Preliminary Design of a Vortex Pool for Electrical Generation. Adv. Sci. Lett. 2012, 13, 173–177. [Google Scholar] [CrossRef]
- Kueh, T.C.; Beh, S.L.; Rilling, D.; Ooi, Y. Numerical Analysis of Water Vortex Formation for the Water Vortex Power Plant. Int. J. Innov. Manag. Technol. 2014, 5, 111–115. [Google Scholar]
- Li, H.F.; Chen, H.X.; Ma, Z.; Zhou, Y. Formation and influencing factors of free surface vortex in barrel with a central orifice at bottom. J. Hydrodyn. 2009, 21, 238–244. [Google Scholar] [CrossRef]
- Sritram, P.; Suntivarakorn, R. The effects of blade number and turbine baffle plates on the efficiency of free-vortex water turbines. IOP Conf. Ser. Earth Environ. Sci. 2019, 257, 012040. [Google Scholar] [CrossRef]
- Ullah, R.; Cheema, T.A.; Saleem, A.S.; Ahmad, S.M.; Chattha, J.A.; Park, C.W. Preliminary experimental study on multi-stage gravitational water vortex turbine in a conical basin. Renew. Energy 2020, 145, 2516–2529. [Google Scholar] [CrossRef]
- Sritram, P.; Treedet, W.; Suntivarakorn, R. Effect of Turbine Materials on Power Generation Efficiency from Free Water Vortex Hydro Power Plant. IOP Conf. Ser. Mater. Sci. Eng. 2015, 103, 012018. [Google Scholar] [CrossRef] [Green Version]
- Wanchat, S.; Suntivarakorn, R.; Wanchat, S.; Tonmit, K.; Kayanyiem, P. A Parametric Study of a Gravitation Vortex Power Plant. Adv. Mater. Res. 2013, 805, 811–817. [Google Scholar] [CrossRef]
- Sritram, P.; Suntivarakorn, R. Comparative Study of Small Hydropower Turbine Efficiency at Low Head Water. Energy Procedia 2017, 138, 646–650. [Google Scholar] [CrossRef]
- Suntivarakorn, R.; Wanchat, S.; Suwanasri, S. An Experimental Study of Electricity Production Using a Vortex Turbine in a Gravitational Water Vortex Power Plant. In Proceedings of the GMSARN International Conference on Innovative Energy Environment, and Development in GMS, Kunming, China, 16–18 November 2016; pp. 16–18. [Google Scholar]
- Adhikari, R.; Wood, D. The Design of High Efficiency Crossflow Hydro Turbines: A Review and Extension. Energies 2018, 11, 267. [Google Scholar] [CrossRef] [Green Version]
- Pradubsri, W.; Chomtee, B.; Thongteeraparp, A. A Study of Small Response Surface Designs for the Full Second Order Model and a Set of Reduced Models in a Spherical Region. Sci. Technol. J. 2015, 23, 362–376. [Google Scholar]
- Koten, H.; Parlakyiğit, A.S. Effects of the diesel engine parameters on the ignition delay. Fuel 2018, 216, 23–28. [Google Scholar] [CrossRef]
- Bao, N.T.; Haechang, J.; Jun-Ho, K.; Jin-Soon, P.; Changjo, Y. Effects of Tip Clearance Size on Energy Performance and Pressure Fluctuation of a Tidal Propeller Turbine. Energies 2020, 13, 4055. [Google Scholar] [CrossRef]
- Bao, N.T.; Jun-ho, K. Design and Analysis of A Pico Propeller Hydro Turbine Applied in Fish Farms using CFD and Experimental Method. J. Korean Soc. Mar. Environ. Saf. 2019, 25, 373–380. [Google Scholar] [CrossRef]
- Williams, S.E.; Freddie, I. Design basics of a small hydro turbine plant for capacity building in sub-Saharan Africa. Afr. J. Sci. Technol. Innov. Dev. 2016, 8, 111–120. [Google Scholar] [CrossRef]
Figure 1.
Working diagram.

Figure 2.
The free-vortex hydro-powerplant.

Figure 3.
The propeller turbine tests.

Figure 4.
Numbers of turbine blades used in the test.

Figure 5.
The sizes of the turbines used in the test.

Figure 6.
Efficiency from different diameters of turbine blades.

Figure 7.
The response surface methodology (RSM) result for the propeller turbines.

Figure 8.
Experimental results of the efficiency obtained when changing the diameter of the turbine.
Figure 8.
Experimental results of the efficiency obtained when changing the diameter of the turbine.

Figure 9.
Experimental results of the efficiency obtained when changing the number of turbine blades.
Figure 9.
Experimental results of the efficiency obtained when changing the number of turbine blades.

Figure 10.
The response surface methodology (RSM) result for the crossflow turbines.

Figure 11.
Comparison of the maximum efficiency of both types of turbines.


Table 1.
Test results for a turbine with a diameter of 0.5 m.
| Q (m3/s) | Efficiency (%) | ||
|---|---|---|---|
| H = 0.2 (m) | H = 0.3 (m) | H = 0.4 (m) | |
| 0.02 | 7.1 | 9.56 | 9.93 |
| 0.03 | 9.47 | 11.33 | 10.57 |
| 0.04 | 11.2 | 12.47 | 12.08 |
| 0.05 | 9.47 | 9.9 | 10.05 |
| 0.06 | 8.83 | 8.98 | 8.81 |
Table 2.
Test results for a turbine with a diameter of 0.6 m.
| Q (m3/s) | Efficiency (%) | ||
|---|---|---|---|
| H = 0.2 (m) | H = 0.3 (m) | H = 0.4 (m) | |
| 0.02 | 10.12 | 10.49 | 11.79 |
| 0.03 | 10.75 | 11.2 | 12.62 |
| 0.04 | 12.07 | 12.08 | 12.15 |
| 0.05 | 9.75 | 9.54 | 9.83 |
| 0.06 | 8.62 | 7.81 | 7.96 |
Table 3.
Test results for a turbine with a diameter of 0.7 m.
| Q (m3/s) | Efficiency (%) | ||
|---|---|---|---|
| H = 0.2 (m) | H = 0.3 (m) | H = 0.4 (m) | |
| 0.02 | 12.49 | 12.53 | 13.92 |
| 0.03 | 11.67 | 11.96 | 12.99 |
| 0.04 | 10.83 | 10.13 | 10.14 |
| 0.05 | 8.49 | 8.02 | 7.87 |
| 0.06 | 7.43 | 6.94 | 6.1 |
Table 4.
Test results for a turbine with a diameter of 0.8 m.
| Q (m3/s) | Efficiency (%) | ||
|---|---|---|---|
| H = 0.2 (m) | H = 0.3 (m) | H = 0.4 (m) | |
| 0.02 | 13.04 | 13.07 | 13.35 |
| 0.03 | 12 | 11.8 | 11.59 |
| 0.04 | 9.79 | 9.35 | 8.74 |
| 0.05 | 7.67 | 7.4 | 6.7 |
| 0.06 | 6.29 | 6.06 | 4.9 |
Table 5.
The 24-blade crossflow turbine at a height of 0.3 m.
| Q (m3/s) | Efficiency (%) | |||
|---|---|---|---|---|
| D = 0.4 (m) | D = 0.5 (m) | D = 0.6 (m) | D = 0.7 (m) | |
| 0.02 | 21.91 | 21.78 | 9.17 | 4.05 |
| 0.03 | 19.63 | 12.00 | 5.18 | 2.49 |
| 0.04 | 18.35 | 9.79 | 3.62 | 1.68 |
| 0.05 | 15.7 | 8.24 | 3.14 | 1.43 |
| 0.06 | 13.05 | 7.34 | 2.99 | 1.39 |
Publisher’s Note: MDPI stays neutral with regard to jurisdictional claims in published maps and institutional affiliations. |
© 2021 by the authors. Licensee MDPI, Basel, Switzerland. This article is an open access article distributed under the terms and conditions of the Creative Commons Attribution (CC BY) license (https://creativecommons.org/licenses/by/4.0/).
Share and Cite
MDPI and ACS Style
Sritram, P.; Suntivarakorn, R. The Efficiency Comparison of Hydro Turbines for Micro Power Plant from Free Vortex. Energies 2021, 14, 7961. https://doi.org/10.3390/en14237961
AMA Style
Sritram P, Suntivarakorn R. The Efficiency Comparison of Hydro Turbines for Micro Power Plant from Free Vortex. Energies. 2021; 14(23):7961. https://doi.org/10.3390/en14237961
Chicago/Turabian StyleSritram, Piyawat, and Ratchaphon Suntivarakorn. 2021. "The Efficiency Comparison of Hydro Turbines for Micro Power Plant from Free Vortex" Energies 14, no. 23: 7961. https://doi.org/10.3390/en14237961
Note that from the first issue of 2016, this journal uses article numbers instead of page numbers. See further details here.