2020 | Buch

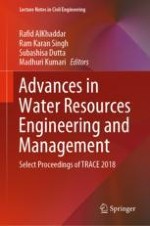
Advances in Water Resources Engineering and Management

Select Proceedings of TRACE 2018

herausgegeben von: Prof. Rafid AlKhaddar, Prof. Ram Karan Singh, Prof. Subashisa Dutta, Dr. Madhuri Kumari

Verlag: Springer Singapore

Buchreihe : Lecture Notes in Civil Engineering

insite
SUCHEN

Über dieses Buch

This book comprises select papers presented at the International Conference on Trends and Recent Advances in Civil Engineering (TRACE 2018). The book covers inter-disciplinary research and applications in integrated water resource management, river ecology, irrigation system, water pollution and treatment, hydraulic structure and hydro-informatics. The topics on water resource management include technological intervention and solution for climate change impacts on water resources, water security, clean water to all, sustainable water reuse, flood risk assessment, interlinking of rivers and hydro policy. The contents of this book will be useful to researchers and professionals working in the field of water resource management and related policy making.
Inhaltsverzeichnis

Frontmatter
Performance Evaluation of Five Penman Forms of Models by Means of Lysimetric Evapotranspiration Under Water Stress Environments at New Delhi, India
Abstract
A global scale has been recommended using the Penman–Monteith method of FAO (56) on reference water evapotranspiration (ETo) calculations or irrigation design, which provides good results under different climatic conditions. In addition to this method, various forms of popular Panamanian equations such as FAO 24 Penman (1977), Kimberly–Penman (1996), and Penman (1948) are widely used throughout the world including India. The evaporation in the Hydrology and Irrigation Committee of the American Society of Civil Engineers has formed a committee recommended by reference standard (standardized Penman–Monteith equation). This method works in a manner similar to that of FAO Penman–Monteith using the short reference station (ETos) used in the present study. The main objective of this study is to assess the performance of these five common forms of Penman forms of the equations established on the daily predictions of the ET indicators under climatic conditions in New Delhi. The ET (ETc) harvest can be obtained using crop factor (Kc). One can develop and use different types of crop coefficients, i.e., single Kc and single Kc with weather correction. The choice of Kc depends on the accuracy required in the ETc accounts. For the evaluation of the performance of five models, the use of selected data from seventeen harvest seasons from 1976 to 2006 of maize (Zea mays L.) was used. Each harvest season requires information on lysimetric ET along with other meteorological parameters and soil moisture monitoring. The statistical indicators used to evaluate the performance were the least squares difference (RMSD), mean bias error (MBE), and t count. From the study, we can conclude that the performance of the Penman–Monteith ASCE and FAO 56 Penman–Monteith is slightly higher than that of the other models under the above-mentioned water conditions, using all four types of crop coefficients.
Ram Karan Singh, Javed Mallick, P. S. Pawar
A Methodology to Measure Flow Fields at Bridge Piers in the Presence of Large Wood Debris Accumulation Using Acoustic Doppler Velocimeters
Abstract
Bridge failure due to scour in flooding conditions has been at the center of attention of hydraulic engineers for decades. Large wood debris accumulation on bridge piers has been found as one of the main causes for bridge collapse. The combined action of enhanced scouring at the base of the pier and increased hydrodynamic load is viewed as the main force driving the enhanced failure probability. It is therefore fundamental to understand the distribution of the flow field around the accumulation and in the proximity of the pier, in order to be able to understand the potential acceleration and turbulence enhancement that could help understand what drives the failure and reduces its probability. However, this particular configuration poses physical constraints to flow measurements, as the accumulated mass of logs hinders a direct access to instrumentation directly immersed in water. This paper proposed a new methodology to measure the flow fields in the presence of debris accumulation using an acoustic Doppler velocimeter (ADV). The methodology consists in applying a matrix of rotation on the instantaneous velocity measured in the three dimensions to access locations underneath the debris that could not be accessed using the standard rotation of the debris. The methodology shows the potential to provide accurate measurements in the proximity of the debris and the groove and is able to maintain the statistics of the flow fields in terms of both average velocity and turbulence intensity.
Iacopo Carnacina, Aleksandra Lescova, Stefano Pagliara
Real-Time Reservoir Operation Policy: A Case Study of Tanahu Hydropower Project
Abstract
For water resources engineering community, reservoir operation is a complex job. Real-time reservoir operation is furthermore complex as it has to consider the real-time hydrological uncertain events. In this paper, a real-time operation model is presented for Tanahu Hydropower Reservoir System in Nepal. To handle the real-time hydrology, it has to predict the reservoir inflow, which is done by using genetic programming (GP). For this, GP-based inflow forecasted models are developed. The reservoir optimization model is solved using EMPSO method for few years’ inflow data, and the optimal solutions are obtained and used to generalize the operational policies. The release policies are used that obtained from EMPSO model and generalization is done with the function of initial storages and inflows to it by using GP model. Finally, the reservoir operation policies are formulated with the forecasted inflow. Performance of models is measured by using coefficient of determination (R2) and root mean squared error (RMSE) and found that the real-time operational model shows good accuracy.
Bhola N. S. Ghimire, Rabindra Nath Shrestha, Upendra Dev Bhatta
Nexus of Water Footprint with Energy and GDP of Saudi Arabia and Solution for Sustainable Water Usage
Abstract
The Kingdom of Saudi Arabia (KSA) is the largest oil-producing country in the Arabian Peninsula and the Middle East. The country is fast developing under the dynamic leadership and undergoing a transition between modernization and tradition. On the one hand, KSA is among the most stressed regions of the world from the water resource point of view; on the other hand, it is a country with the highest oil reserves in the world. The water footprint (WFP) per capita of Saudi Arabia is among the top 10 countries, and the energy footprint is among the top 20 countries in the world. About 50% of the water in KSA is derived from the desalination, at a high cost, which is subsidized by the government. Hence, a large part of the economy is compromised to cater to this subsidy, adversely affecting the growth of the GDP of the country. In the present study, a state of art and most recent analysis has been done for nine years on the factors contributing to the development index of KSA. The focus is on per capita water footprint. About 70% of the electric power in the KSA is consumed for the purpose of air-conditioning, which generates condensate water as a by-product, often drained. A most effective measure to recycle wastewater is suggested by harnessing the condensate from the air-conditioning and using it for sanitation, without any purification or filtration. The proposed solution can cater to the daily water need of 0.4 million residents of KSA and can save more than 30 million USD per annum, almost 4.37% of the GDP of 2018.
Vineet Tirth
Statistical Parameters of Hydrometeorological Variables: Standard Deviation, SNR, Skewness and Kurtosis
Abstract
Global spatial patterns of standard deviation, signal-to-noise ratio (SNR), skewness and kurtosis of eight hydrometeorological variables, i.e. potential evapotranspiration (PET), average temperature (Tavg), precipitation (Pre), maximum temperature (Tmax), minimum temperature (Tmin), wet day frequency (Wet), diurnal temperature range (DTR) and vapour pressure (Vap) are studied and discussed in this chapter. Global high resolution gridded hydrometeorological data provided by Climate Research Unit (CRU) is used. Not much variation is found in the annual values of Pre, DTR and Wet with respect to mean. High values of standard deviation in annual values of Tavg, Tmax and Tmin are found. It is found that higher variability in the dataset is generally associated with a lower mean value. Only a few regions of the world are found to be significantly skewed. About 3.5–9.5% regions of the world are found to be significantly leptokurtic for all variables except for PET for which almost all datasets are found significantly leptokurtic.
Chetan Sharma, C. S. P. Ojha
A New Approach to Analyze the Water Surface Profile Over the Trench Weir
Abstract
To divert water from streams containing streams for its usage in different purposes like irrigation, hydropower, water supply, etc., the most appropriate kind of weir is trench weir. It involves a trench constructed transversely at the streams, underneath of its bed level. The uppermost level of this trench is roofed with bottom rack bars to avoid the incoming of sediment into the trench. Bottom rack is kept porous, so when water flows above it, a part of it moves into the trench and get collected to an intake well. This kind of weir has certain benefits as it does not disturb much the flow of the river. Because of the fact that it is constructed below the river bed, the sediment of size less than the spacing of the rack bars moves into the trench. As a result, post-monsoon cleaning of the trench is mandatory. Design of sidewalls and size of the trench requires water surface profiles over the bottom racks. This paper deals with a new approach to analyze the water surface profile over the bottom rack. The equation proposed has been and compared with the observed water surface profile. By using proposed equation, water surface profile was computed and it was found comparable to the observed ones and also the proposed equation is more suitable to compute water surface profile above the bottom rack for various slope of rack.
Swati Bhave, Sanjeev Kumar
Soil Loss Assessment in Imphal River Watershed, Manipur, North-East India: A Spatio-Temporal Approach
Abstract
Land and water resources are vital resources. Whenever these resources are under stress and pressure which may be natural or anthropogenic, heavy loss is incurred. Soil loss is one of such significant environmental problems. Various models such as USLE, RUSLE, USPED and LISEM are developed for rapid assessment of soil loss. Assessment of soil loss is considered as a significant, as it leads to loss of top layers of soil and thus reduces the fertility and quality of the soil, which eventually leads to soil degradation and thus affects the sustainability of the inhabitants. Soil loss in the Imphal River watershed, of Manipur, a north-eastern state of India, is assessed using RUSLE for the time period of 2006 and 2017. The rate of soil loss is classified on the basis of classification by NBSS&LUP, India. Positive changes in the spatial extent is observed in ‘No Erosion’ and ‘Extreme’ and Negative changes are observed in ‘Slight’; ‘Moderate’ and ‘High’ class of erosions. The area under ‘No Erosion’ is increased by 13.64 and 5.57% in the ‘Extreme’ class of erosion from 2006 to 2017. Land use of the study area also significantly affects the rate of soil loss.
Loukrakpam Chandramani, Bakimchandra Oinam
Analysis of the Extreme Rainfall Events Over Upper Catchment of Sabarmati River Basin in Western India Using Extreme Precipitation Indices
Abstract
Analysis of extreme rainfall events provide an idea of the probable occurrence of such events in future, and catchment response to such events can be utilized for assessing the flood characteristics of the river basins. This study focuses on the analysis of the extreme precipitation events in the upper catchment of Sabarmati River in western India. Extreme precipitation indices such as the number of rainy days, annual precipitation, daily intensity index, consecutive wet spells, one-day maximum rainfall were calculated as per the norms suggested by Expert Team on Climate Change Detection Monitoring and Indices (ETCCDMI) of Intergovernmental Panel on Climate Change (IPCC). These precipitation extremes were analysed using the IMD gridded precipitation datasets, and associated flood characteristics of the river basin were analysed with the available daily streamflow data for the period 1992–1994. This chapter explains the spatial variation in extreme rainfall events and its effect on the streamflow of the river. Finding of the study reveals no significant trend in the extreme rainfall events of the basin, but catchment response to the extreme rainfall events is evident which could be verified with longer period streamflow data analysis.
Shivam Gupta, Ankit Gupta, Sushil K. Himanshu, Ronald Singh
Rainfall Runoff Modelling of Urban Area Using HEC-HMS: A Case Study of Hyderabad City
Abstract
Uncontrolled urbanization and climate change play a significant role in urban flooding. The condition in which rainfall excess exceeds the drainage capacity of storm water drains is called urban flooding. Urbanization disrupts the natural water balance by increasing impervious areas and reduction in infiltration. This increases runoff from urban catchments and leads to higher flood peaks even for short-duration low-intensity rainfall. Such flash floods significantly increase the expenses on mitigation efforts owing to their destructive nature. Urban flood management is one of the important topics of concern as frequent disasters are happening in almost all the urban areas. This is the indication of poor storm water management in urban areas particularly in developing countries like India. Thus, to improve the situation proper storm water drains and sewage network need to be planned and installed considering present land use pattern and probable future development. Present study focuses on the simulation of critical storm event for analysing drainage capacity for part of Hyderabad city (Zone XII). This study area is the most flooded catchment in Hyderabad, and it is ranked as priority number 1 in urban flooding. The drainage network exists in certain parts of the study area. Rainfall data is collected from the Indian Meteorological Department (IMD), and extreme rainfall events are found out. The response of the catchment to the extreme rainfall is modelled using HEC-HMS and HEC-Geo HMS. The simulated model gives a peak discharge of 590.5 m3/s at the outlet (Hussain Sagar Lake) for the August 2008 rainfall event having 221.4 mm precipitation for the duration of 34 h.
Vinay Ashok Rangari, V. Sridhar, N. V. Umamahesh, Ajey Kumar Patel
Hydrodynamic Simulation of River Ambica for Riverbed Assessment: A Case Study of Navsari Region
Abstract
Physically based hydraulic or hydrological model will simulate the dynamics flow water of a river network against space and time with varying reach boundary conditions that may be enforced for the case of Ambica river stream. Such stream models refers to the physically based hydrologic or hydraulic models which usually helps in crucial part of flood prediction, flood forecasting and fluctuation of tidal that forecasts river levels in flood prone areas off the center stream of Ambica river. For the setting of a any river model, the measurements of river geometry, bed depth/slope, floodplain mapping and boundary condition flow are essential. The discharge and water level in the river reach of Ambika are controlled by Jhuj and Kelia dam which is 68.9 and 57.6 km away from Navsari city, respectively. Major flood events occurred in the years 1981, 1994, 1997, 2001, 2003, 2004, 2005, 2006, 2007, 2013 and 2014. Therefore, it becomes highly necessary that flood events are studied and analysed properly in order to propose adequate flood control and protection measures in time to come. At present, the carrying capacity of Ambica River is approximately around 2.5 lakhs cusecs (7079 m3/s). In this paper, we used one-dimensional model which is released by US Army Corps of Engineers, i.e. HEC-RAS 5.0.4. over the river reach of Ambica, Navsari. In this paper, hydrodynamic simulation is performed to compute the water surface profiles for five-peak flood discharge of year 1981, 1994, 1997, 2004 and 2006. Thus, in this present paper from Ichhapore to Salej village which is approximately 1170 m long is selected for study purpose. The computed sections are then compared with existing sections on the river reach and are checked whether the sections are critical or not. Based on above study, it is recommended that the cross sections which the water is overtopped on the existing section, levees or retaining is to be constructed or need to be raised.
Darshan Jayeshbhai Mehta, Sanjay Madhusudan Yadav
Evaluation of the SWAT Model for Analysing the Water Balance Components for the Upper Sabarmati Basin
Abstract
Evaluation of various components of hydrologic cycle is necessary for planning and management of a river basin/watershed. The present study evaluated the water balance components in parts of upper Sabarmati basin (6211.56 km2) of central India using the soil and water assessment tool (SWAT) hydrologic model. The river basin was delineated to 31 sub-basins encompassing 116 hydrologic response units (HRUs). Monthly calibration (1992–1999) and validation (2000–2005) of the SWAT model were carried out using observed discharge data at Derol Bridge, Gujarat, India. Trend analysis results over the period of 1992–2005 for run-off and evapotranspiration shows an insignificant decreasing trend, along with decrease in precipitation with a magnitude of 21 mm/year, The model simulation results indicated a reduction in surface run-off (323.49–232.14 mm) and potential evapotranspiration(1935.71–1875.71 mm) between years 1992 and 2005. The present study also revealed a considerable decrease in water yield (493.2–317.6 mm) for same duration.
Ankit Gupta, Sushil K. Himanshu, Shivam Gupta, Ronald Singh
Rainfall-Runoff Modelling and Simulation Using Remote Sensing and Hydrological Model for Banas River, Gujarat, India
Abstract
This research developed a small-scale flood model that integrates Geographic Information and hydrological models. HEC-RAS model helped in simulation and to develop a relationship between runoff and rainfall in Banas River, Gujarat, India. Banas River has been taken as the study area because it is a region which was mostly flooded and having a severe effect on the Gujarat 2017 flood. This model compromises two models, a rainfall-runoff model that converts rainfall excess to surface flow and river runoff, and a second model as a hydraulic model that covers unsteady state flow through the river channel network. In HEC-RAS model, new GIS tool RAS Mapper has been used which is compatible with GIS facilities and modelling has been done with this tool. Results are also available in different parameters such as flood inundation depth, flood water velocity and time. Validation of the model is important, the results at the end of the simulation were compared with the previous observed flood water level data from past flood events in a particular fixed location. The results of this research will benefit in flood management and also used in future modelling for flood disaster forecasts.
Anant Patel
GIS-Based Morphometric Analysis and Prioritization of Upper Ravi Catchment, Himachal Pradesh, India
Abstract
Morphological parameters have been recurrently used to assess the hydrological response of a watershed. Due to a strong mutual correlation between the run-off characteristics and the terrain of a watershed, the method is significantly popular, especially in an un-gauged catchment. In the present study, the hydrologic response of a Himalayan watershed and its sub-watersheds is discussed using various morphological parameters, and accordingly, the sub-watershed prioritization has been done. Morphological parameters have been extracted from digital elevation model (SRTM-DEM) in conjunction with Survey of India toposheets (1:50000 scale). Arc Hydro tools have been used for the preparation of watershed and sub-watershed boundaries, to calculate flow directions, flow accumulation and for stream ordering. Morphometric parameters categorized under linear, aerial and relief aspects are calculated for the entire catchment and also for its eight sub-watersheds separately. The drainage pattern is mostly sub-dendritic to dendritic in nature. The studied catchment has been categorized as an eighth order drainage catchment with a drainage density of 3.15 km/km2. The progressive increase in stream length ratio is a depiction of the attained geomorphic maturity of the basin. Considerable conformity between the sub-watersheds and their major catchment characteristics has been established. However, two sub-watersheds have been observed to behave in a different manner. In order to prioritize the catchment, a compound index was calculated by considering the individual rank assigned to all eight sub-watersheds based on 11 morphological parameters. The study reveals that SW6 sub-watershed has the highest priority and SW2 watershed has the least priority. Such maps have immense significance for field engineers for prioritizing the watershed management activities within the watershed especially in un-gauged condition.
D. Khurana, S. S. Rawat, G. Raina, R. Sharma, P. G. Jose
Estimation of Domestic Water Demand and Supply Using System Dynamics Approach
Abstract
Water is a basic need for survival and well-being of all, and therefore, it is required to provide adequate quantity and potable quality of water to all. Water is used for all purposes such as domestic, agriculture and industrial needs, navigational, recreational, and power generation. In this study, water demands and supply for domestic sector have been presented. Based on various factors, e.g., the level of economy, technological advancement, and pricing policy, level of urbanization, ratio of private to public water supply, and population coverage under public water supply, the unit water demand and supply at the user end for domestic sector is calculated and discussed. With the help of Vensim simulation software, a system dynamics-based simulation model (domestic water sector model) for estimating the domestic water demand and supply has been developed. Domestic water sector model is validated on the available data, and the simulated results showed good agreement. Study showed that the water supply is meeting the projected water demand of 87.35 BCM in the year 2050 (for a projected population of 1.645 billions) because the highest priority is given to meet the domestic water demand as per National Water Policy of India, GOI.
Bharti Chawre
Sustainable Development and Management of Groundwater in Varanasi, India
Abstract
Groundwater is the main source of drinking water for half of the world’s population. Therefore, it is very important to conserve and manage this resource. Sustainable development and management of groundwater resource mean to the efficient management of the existing groundwater resources to meet the requirement of the present and future demand without affecting the risk associated with the damage to aquifer physical characteristics. In this paper, Varanasi was taken for the study of groundwater and its sustainable development. Varanasi is the oldest living city, situated on the bank of the holy river Ganga. Varanasi is the third most congested city of the Uttar Pradesh as per census 2011. Due to its religious importance, groundwater extraction is increasing day by day. A steady state of groundwater model was developed for the study area using groundwater flow modelling programme. This model was built in three layers to simulate the different type of soil layers. For conceptualization of the model, different layers and maps were prepared in GIS environment. Data collection was done in the field, and aquifer data was provided by different government organizations. For preparing maps, Landsat 8 satellite imagery was used and for DEM SRTM data was used. Modelling results were also calibrated and validated with the field data. Results reveal that Kashi Vidya Peeth block of the Varanasi is the most groundwater vulnerable regions. Results of this study are very helpful in applying sustainable development and management strategies for the groundwater.
Padam Jee Omar, S. B. Dwivedi, P. K. S. Dikshit
Applications of GIS in Management of Water Resources to Attain Zero Hunger
Abstract
The sustainable development goals as proposed by United Nations give huge importance to ending hunger and attaining food security for all by 2030. According to World Health Organization (WHO), food security can be achieved if everyone has access to sufficient, safe and nutritious food throughout the year. Every one in nine persons is deprived of sufficient and safe food. To meet the growing population demand, United Nations aims to double the productivity in agriculture by 2030. Though, by 2015 there is around 10% reduction in critically hungry population of world, yet, the food security for all is a far-sighted dream. Crunch of land and water resources is posing the biggest threat in meeting this target. Per capita availability of land has been decreased with the increase in population, and the water resources are either unavailable or polluted. For sustainable agriculture, there is a need to identify and map locations having adequate water and land resources. GIS models help in analyzing ground profiles, soil water content, rainfall patterns, and geographical terrain and crop conditions. Thus, GIS technologies can help in developing models for water resource management. Continuous monitoring and assessment of natural water resources can help in capacity building, mapping and/or monitoring of cultivable land. Advances in GIS technologies could be an efficient tool to achieve the “zero hunger” goal. The present chapter covers various developments in GIS for water resource modeling across the globe.
Ashita Sharma, Manish Kumar, Nitasha Hasteer
Electrocoagulation as an Eco-Friendly River Water Treatment Method
Abstract
Electrocoagulation (EC) is an effective water and wastewater treatment technology, where the coagulants are produced in situ by electrolytic oxidation of a sacrificial anode. In this technique, pollutant removal is done without adding chemicals; therefore, it remarkably reduces the sludge produced and consequently reduces the cost of sludge handling. This method has been efficiently used to remove, up to 99%, of a wide range of pollutants such as heavy metals, oil, dyes, and fluoride. Therefore, the EC method could be the cost-effective, safe, and reliable option to face the growing water scarcity. However, like any other treatment method, the EC technology still has some drawbacks that could limit its applications. This chapter has been therefore devoted to present the principles, history, applications, limitations, advantages and disadvantages of the electrocoagulation technology, the role of key operating parameters on the performance of the EC reactors, and highlight the differences between the traditional coagulation process and EC technology. More importantly, this chapter will highlight the defects of EC technology that need to be enhanced.
Khalid S. Hashim, Rafid AlKhaddar, Andy Shaw, P. Kot, Dhiya Al-Jumeily, Reham Alwash, Mohammed Hashim Aljefery
Wetland Dynamics Using Geo-Spatial Technology
Abstract
Wetlands are very significant part of our environment. They improve water quality of its area and also makes local climate fairly moderate. Among the fertile areas of environment system, wetlands are the one. As the wetland decreases, it brings changes to weather pattern and diminution of water level below soil. Like many wetlands in India, wetland of Varanasi district is also facing with danger and diminishing day by day. Due to the rapid increase in urbanization of the city and population explosion over the last two decades, the encroachment process is taking place at a brisk rate; therefore, wetland area is reducing accordingly. So objective of this work is the mapping of wetland area in Varanasi district with the help of remote sensing using multi-date Landsat satellite data for two particular years 1990 and 2016. Water pixels have been demarcated by using Normalized Difference Water Index (NDWI). In the result of the study, it has been found that wetland area’s reduction has been around 43% for the period spanning around 26 years. This is a cause of great concern that wetland area is reducing at a very fast rate; therefore, it is urgent need to protect these wetland area as this is one of the major components for sustaining balance in our ecosystem.
Nilendu Das, Anurag Ohri, Ashwani Kumar Agnihotri, Padam Jee Omar, Sachin Mishra
Inland Waterway as an Alternative and Sustainable Transport in Kuttanad Region of Kerala, India
Abstract
The purpose of this study is to illustrate the advantage of waterways over roadways in Kuttanad, Kerala. The paper also discusses how the neglect of waterways and growing preference over roadways has led to the environmental pollution in the area. The study area has been visited multiple times and interaction with the locals to understand the problems has been done for a comprehensive solution. Planning of waterways is done by collecting the data from the study area in focus. Travel times were estimated by travelling a route multiple times and distance is estimated from Google earth. Using the GPS device, tracks were saved while travelling by the route, on car and on boat. The tracks and the coordinates were then plotted in Google earth for representation. The study demonstrates how improvements in waterways can outrank roadways in the study area. The paper is also an attempt to prove the development of waterways can be an answer to the stagnant water in the locality.
Madhuri Kumari, Sarath Syamaprasad, Sushmit Das
Metadaten
Titel
Advances in Water Resources Engineering and Management
herausgegeben von
Prof. Rafid AlKhaddar
Prof. Ram Karan Singh
Prof. Subashisa Dutta
Dr. Madhuri Kumari
Copyright-Jahr
2020
Verlag
Springer Singapore
Electronic ISBN
978-981-13-8181-2
Print ISBN
978-981-13-8180-5
DOI
https://doi.org/10.1007/978-981-13-8181-2