


ABSTRACT
We present the discovery of RR Lyrae (RRL) variable stars in two fields of M33 to the southeast of its center using Gemini North observations. In the outermost field (45' to the southeast of the M33 center; projected distance of 10.8 kpc; deprojected distance of about 19 kpc; about 5 V-band disk scale lengths) we detected two RRLs, consisting of one RRab star and one RRc star. An additional variable was found in this field that is a possible Cepheid. The mean g'-band magnitude for the two RRL stars is 25.60 ± 0.04 mag. In the other field (25' to the southeast of the M33 center; projected distance of 5.6 kpc; deprojected distance of about 10 kpc; about 3 V-band disk scale lengths) we found 12 RRL stars, all of which are RRab stars. We also detected two candidate Cepheid variables in this field. The mean magnitude for the RRL stars in this field is 25.64 ± 0.14 mag. We found a distance modulus of 〈(m − M)0〉 = 24.69 ± 0.17 mag from the RRab stars in the field 25' from M33. The mean periods of the RRab stars in both fields (0.630 ± 0.002 days, 45' southeast; 0.628 ± 0.055 days, 25' southeast) are much longer than found for previously detected RRL stars in the inner regions of M33. This finding argues for a low metallicity for the RRab stars in the field 25' from M33 ([Fe/H] =−1.84 ± 0.30 dex). Given these properties, we conclude that the RRLs we have detected belong to the halo of M33 and thus that there is an old component in the outer regions of M33.
Export citation and abstract BibTeX RIS
1. INTRODUCTION
A fundamental question that astronomers are still trying to answer today is how galaxies are formed? Current observations argue that larger galaxies are built up from smaller ones. This agrees with cold dark matter models except for the dwarf satellite problem (Klypin et al. 1999; Moore et al. 1999). Simulations of galaxy formation predict significant stellar halos and thick disks around Milky Way-like galaxies (Abadi et al. 2003). Our Galaxy shows both of these features and M31 has a halo and a possible thick disk. Both galaxies have been observed to contain a number of stellar streams from tidally disrupted smaller galaxies (e.g., Belokurov et al. 2006; McConnachie et al. 2009). In comparison, M33 (the Triangulum galaxy) shows evidence of a minor stellar substructure and appears to have gone through its evolution in relative isolation (Ferguson et al. 2007) with the exception of a possible pass by M31 (McConnachie et al. 2009). While it has also been shown to contain a halo (e.g., Chandar et al. 2002), the extent of that halo is uncertain (e.g., Tiede et al. 2004).
While M33 is a spiral galaxy (Sc II–III) similar to the Milky Way and M31 galaxies, its R25 optical radius is about one-third that of Andromeda (de Vaucouleurs et al. 1991) and represents the most common spiral galaxy type in the Local universe (Marinoni et al. 1999). M33 has been shown to contain a number of globular clusters (Sarajedini & Mancone 2007, and references therein). M33 also has an insignificant bulge (McLean & Liu 1996), which is thought to be an indicator of a small rate of merging. The lack of a significant halo and bulge suggests that the disk of M33 may have been in place since early epochs, since minor mergers are expected to heat and disrupt disks (Steinmetz & Navarro 2002).
There have been a number of recent studies to investigate the extent of the halo and disk of M33. Ferguson et al. (2007) used ground-based observations to create a star count map of M33. Their survey showed that M33 has a truncated disk at Rdp ∼ 8 kpc. Using deep Advanced Camera for Surveys images of fields ∼9–13 kpc in a deprojected radius to the southeast of M33, Barker et al. (2007a) found that the metallicity gradient in their fields was consistent with the inner disk. This argues that the M33 disk extends out to about 13 kpc, although they caution that a small thick disk or halo component may be present as well. Analysis of the color–magnitude diagrams (CMDs) in the Barker et al. fields indicated stars with ages from ∼100 Myr to several gigayears. In a follow-up paper on the star formation history of these fields, Barker et al. (2007b) observed that the inner field tended to be younger and more metal-rich than the outer field. This indicates an outside-in growth of the disk, contrary to expectations. This differs from the inside-out growth seen by Williams et al. (2009) for the inner disk of M33, who observed four fields along the southwest major axis of M33, all of which fall within the disk break at 8 kpc. Recently, Grossi et al. (2011) studied the northwest and southeast outer regions of M33 out to 120'. They concluded that the observed surface density was more consistent with an extended disc rather than a smooth stellar halo, with the caution that their fields are along the H i warp.
While M33 was once thought of as a "pure disk" galaxy, it has become clear that a halo component is present in the galaxy. The M33 clusters have been separated into disk and halo components due to their kinematics (Chandar et al. 2002). McConnachie et al. (2006) were able to separate M33 red giant branch (RGB) stars located at approximately 9 kpc along the southwest major axis into halo, disk, and a third unknown component using spectroscopy. The halo component showed an average metallicity of −1.5 ± 0.3 dex.
As noted above, surveys of M33 have shown that it had few, if any, mergers with dwarf galaxies, but that does not mean it had no interactions with other galaxies in the past. As part of the PAndAS survey of M31, McConnachie et al. (2009) found that M33 is surrounded by a stellar structure that was previously undetected. This structure is most prominent to the northwest of M33 with a secondary feature to the south. It also coincides with the H i warp seen in the M33 disk. McConnachie et al. used simulations to show this structure and the warp may be due to a previous encounter with M31.
In an effort to discover the extent of the M33 halo and disk, we started a program to study the RR Lyrae (RRL) stars in three different fields to the southeast of M33. By studying three fields in M33 we can search for radial trends in the stellar populations. RRL stars are used because they are excellent tracers of old stellar populations (age >10 Gyr). These stars also yield important information about the system they belong to such as distance, reddening, and metallicity.
There have been very few studies of the RRL population in M33. Pritchet (1988) presented preliminary results for seven candidate RRL stars, but the precise nature of these stars remains unconfirmed. Sarajedini et al. (2006) used Hubble Space Telescope observations to detect RRL stars in two inner regions of M33 on either side of the minor axis. They detected 72 RRL stars (64 RRab and eight RRc stars). One very interesting result from their study is that the RRLs could be separated into disk and halo populations by examining the distributions according to their metallicity and reddening. Although not optimized for variable star detection, Barker et al. (2011) found five and zero candidate RRLs in two fields 9.1 kpc and 11.6 kpc (deprojected distance) along the northeast major axis. No periods were given because of the lack of phase coverage. Yang et al. (2010) presented results for a variable star search in fields extending from about 2.5–6 kpc in deprojected distance along the southwest major axis of M33. A total of 122 RRLs were detected (96 RRab, 23 RRc, and 3 RRd stars). They note that the RRLs in these fields likely belong to the halo.
In this paper, we present the results from time series observations of two outer fields to the southeast of M33 that lie at deprojected distances of about 10 kpc and 19 kpc. A third, inner field was too crowded, even at 0.6 arcsec seeing, to find many RRLs. We used an inclination angle of 56°, a position angle of 23° (Regan & Vogel 1994), and distance to M33 of 809 ± 24 kpc (McConnachie et al. 2005) to determine the distances. It may not be valid to assume a constant inclination and position angle due to the warp in the disk of M33. Therefore, we also include the projected distances of 5.5 kpc and 10.8 kpc for each field, respectively. These distances correspond to V-band disk scale lengths of about 3 and 5, respectively, where the V-band disk scale length for M33 is ∼9 5 (Guidoni et al. 1981). In Section 2 we discuss the observations and reductions of our data. The variable stars we found are listed in Section 3. In Section 4 we analyze the properties of the RRL stars that were detected. Finally, the conclusions are given in Section 5.
2. OBSERVATIONS AND REDUCTIONS
The GMOS-N instrument of the Gemini North Observatory was used in the classical observing mode to image three fields in M33. The three fields are located at the right ascensions and declinations of (01:34:57.12, +30:36:00.0), (01:35:28.42, +30:28:52.0), and (01:36:52.56, +30:15:56.9). The projected distances are 14' (SE14), 25' (SE25), and 45' (SE45) to the southeast of the center of M33 (see Figure 1), respectively. From 2005 October 2 to October 6, we cycled through the three fields taking multiple Sloan Digital Sky Survey g' observations and occasionally one r' of each field. There was no dithering between observations. The g'-band observations were used to detect the variable stars, while the r'-band ones (exposure time of 900 s) were used to obtain colors of the stars. During each visit to a field, two 900 s g'-band exposures were taken, which were later combined to increase the signal-to-noise ratio. The sky was clear on each night with a typical seeing of 0 66 (g') and 060 (r') for night one, 079 (g') and 065 (r') for night two, 056 (g') and 059 (r') for night three, and 067 (g') and 065 (r') for night four.
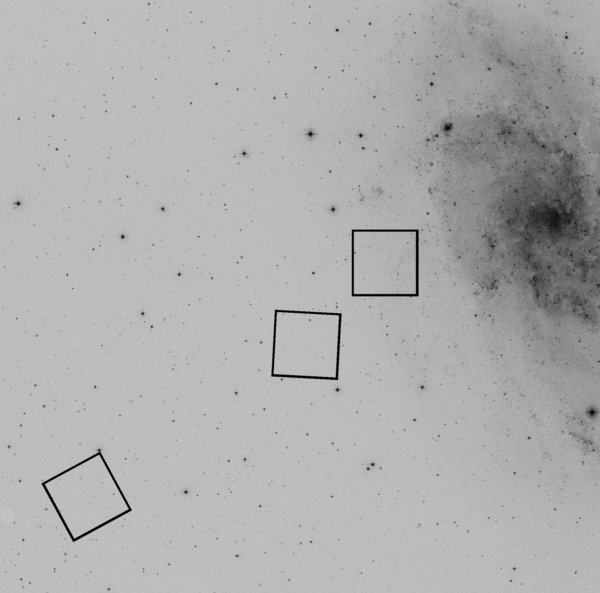
Figure 1. Locations of the SE45 (lower left), SE25 (middle), and SE14 fields (upper right) in M33. North is at the top and east is to the left. The field of view for the GMOS-N images is approximately 55 × 55. The full field of view of this image is 50' × 50'. The image is a Second Palomar Observatory Sky Survey image produced from the STScI Digitized Sky Surveys archive. (The Second Palomar Observatory Sky Survey (POSS-II) was made by the California Institute of Technology with funds from the National Science Foundation, the National Geographic Society, the Sloan Foundation, the Samuel Oschin Foundation, and the Eastman Kodak Corporation.)
Download figure:
Standard image High-resolution imageImages were reduced to bias-subtracted/flattened/trimmed data using the GMOS part of the Gemini IRAF package. Gemini-recommended reduction procedures and parameters were used. After some experimentation, we chose to combine each pair of g'-band images that were taken at each visit, which were done by simple co-addition. We used the DAOPHOT II and ALLFRAME routines (Stetson 1987, 1994), analyzing the three CCD chips in GMOS-N separately. Point-spread functions for each image on each chip were created, as is common practice, from uncrowded stars on each chip. The images with the best seeing were used to create an object list that was applied to all of the other images to search for objects. The data were photometrically calibrated using images of the globular cluster NGC 2419 on photometric nights. Ground-based images of NGC 2419 from the WIYN telescope (A. Saha 2006, private communications) provided the calibrated photometry for the cluster. The calibration equations had the general form of

where g' and r' are the calibrated magnitudes, g and r are the uncalibrated magnitudes, A and B are coefficients, X is the airmass, and C is the zero-point offset. Table 1 lists all the parameters used to calibrate the photometry.
Table 1. Calibration Equation Coefficients
| Chip | A | B | C |
|---|---|---|---|
| Chip 1: g' | −0.065 ± 0.020 | 0.140 ± 0.001 | 2.998 ± 0.013 |
| Chip 1: r' | −0.030 ± 0.023 | 0.110 ± 0.001 | 3.440 ± 0.010 |
| Chip 2: g' | −0.059 ± 0.014 | 0.140 ± 0.001 | 2.996 ± 0.009 |
| Chip 2: r' | −0.030 ± 0.018 | 0.110 ± 0.001 | 3.421 ± 0.013 |
| Chip 3: g' | −0.070 ± 0.014 | 0.140 ± 0.001 | 2.999 ± 0.010 |
| Chip 3: r' | −0.029 ± 0.014 | 0.110 ± 0.001 | 3.459 ± 0.010 |
Download table as: ASCIITypeset image
After analyzing the photometry, we discovered that the inner field (SE14) is too crowded, given typical ground-based seeing, to make detection of RRL stars satisfactory. Only a handful of RRL stars were detected in that field, which is not on the order found by Sarajedini et al. (2006) in a neighboring field. We also used the image subtraction routine ISIS (Alard 2000) to search for the RRL stars, but we were unable to significantly increase the number of RRL detected in that field.
The completeness of our photometry in the two outer fields was determined by adding artificial stars to our images and running those images through the reduction process to see which of those stars made it through the full process. This was done for each chip individually. The percentage of stars found at a given magnitude in each field and for each filter is shown in Figure 2. The 50% completeness limits are g' = 26.1 and r' = 25.7 for SE45, and g' = r' = 25.9 for SE 25. We attribute this difference between the r' and g' bands to the seeing in the SE45 r'-band being typically worse than the other cases, even in the best seeing frame.
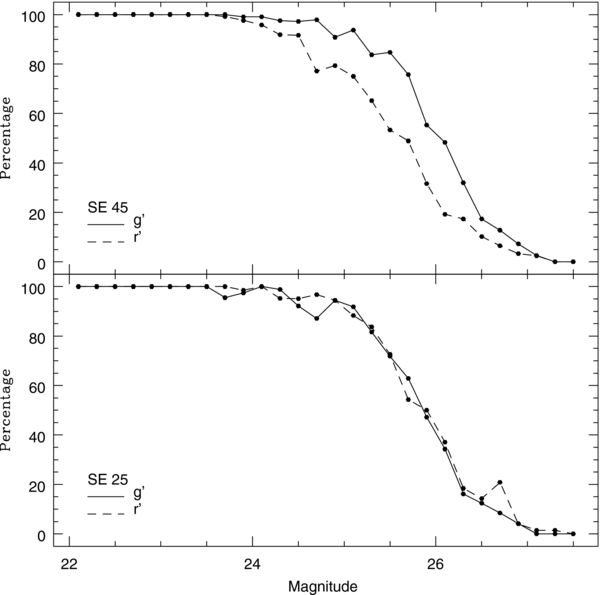
Figure 2. Completeness as a function of magnitude for the g'- and r'-band data in both the SE45 (top) and SE25 fields (bottom).
Download figure:
Standard image High-resolution imageVariable stars were detected using both the variability index from the ALLFRAME output and from the output of the calibration program NEWTRIAL (P. B. Stetson 2006, private communications). NEWTRIAL is a program that converts the instrumental magnitudes to the standard system after applying aperture corrections to each image. Part of its output is the weighted mean magnitude of each star using all the epochs along with a variability index. After plotting the variability index versus magnitude, we found that the majority of stars have indices of two or less. Our initial threshold cut was 2.5 to search for the variable stars. All candidate variable stars were searched by eye for periods using the period dispersion minimization (PDM) in IRAF.6 Once candidate RRL stars were found, we lowered the threshold cutoff to 2.0 for stars that fell within a magnitude range of ±1 mag from the RRL mean magnitude to ensure we did not miss any with low amplitudes or with high errors in their magnitudes. When using PDM to search for periods within a range of 0.2–1.0 days, there was typically a clear minimum near the actual period of the variable star with a secondary minimum near an alias. The light curves were visually inspected near each of the minima until the period yielding the best light curve was found. In nearly all of the cases the period found at the primary minimum yielded the best light curve with the light curve from an aliased period showing clear scattering.
To study the probability of discovering a variable star, we followed the method described in Saha & Hoessel (1990). This method takes into account the completeness of the stars at a given magnitude and how many observations occur in a given phase interval. Figure 3 shows the probability of discovering an RRL star versus the period in days. This figure does not include the overall completeness as shown in Figure 2. As expected, there are difficulties in finding RRL stars with periods of 0.25, 0.33, and 0.50 days. This figure also shows that there is a lower probability of discovery for RRc stars (P < ∼ 0.4 days). However, there is a high probability of detecting the RRab stars (P > ∼ 0.5 days).
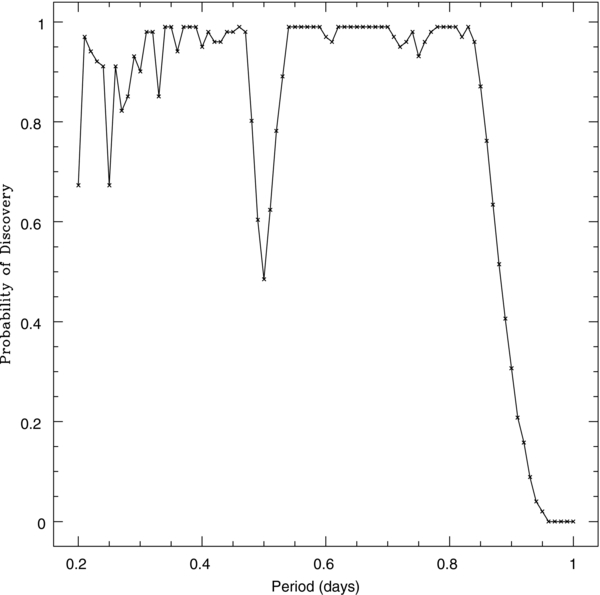
Figure 3. Probability of discovering an RR Lyrae star as a function of the period.
Download figure:
Standard image High-resolution imageSince discovery of RRc variables will prove to be important in the analysis, we also injected artificial variable stars into the data. We created sinusoidally varying stars with amplitudes of 0.025, 0.1, 0.2, and 0.3 mag (150 artificial stars for each amplitude), at the mean g' magnitudes of the RRLs, with periods ranging from 0.3 to 0.7 days. We sampled the artificial variables at the same epochs as the real data, along with the same exposure times as the real data, and used those magnitudes with photon-statistics noise to place the artificial stars into the data. We were able to detect 87.3%, 88.7%, 88.7%, and 84% of the stars with amplitudes of 0.025, 0.1, 0.2, and 0.3 mag, respectively. This is consistent with our completeness analysis above. Of the stars detected, 41.2%, 70.0%, 97.7%, and 99.2%, respectively, had a variability index above our original threshold of 2.5. Of those stars, we were able to accurately determine the periods for 20.4%, 40.6%, 76.7%, and 91.3% of the stars for the sequence of amplitudes listed above. An observed period was considered accurate if it fell within 0.02 days of the input period. As expected, the higher the amplitude, the greater the success in detecting the variable star using the variability index and in accurately determining its period. The typical amplitude for an RRc star in the V band is around 0.5 mag. We are confident that any variable with an amplitude greater than about 0.3 mag should be detected even with our 16 epochs.
3. VARIABLE STARS
3.1. Southeast 45' Field
Three variable stars were detected in the SE45 field. As the CMD in Figure 4 shows, one variable star (SE45 V01) appears to be a candidate Cepheid-type variable, while the other two are in a location where we might expect RRL stars to be found. Many of the sources shown in the CMD are likely unresolved background galaxies. Figure 5 shows their light curves and Table 2 lists their properties. The columns in Table 2 are as follows: Star ID, right ascension and declination, the period, the mean g' and mean r' magnitudes, the g' amplitude, and the variable star classification. Table 3 lists the epoch-by-epoch photometry for the variable stars. In Figure 6, we show the locations of the three SE45 variables within the field of view. The one caveat about the candidate Cepheid is that it is found near the edge of the field and was not visible in the r'-band images. While it clearly shows variability as seen in Figure 5, its precise nature is uncertain. It may be that its photometry is being affected by its location near the edge of the chip, making it brighter than it actually is. There is also another star nearby that may be affecting its photometry. The existence of a possible Cepheid star is curious. There is no clear young stellar population seen in the CMD. Follow-up observations of this field would be needed to clear up the precise nature of this variable star.
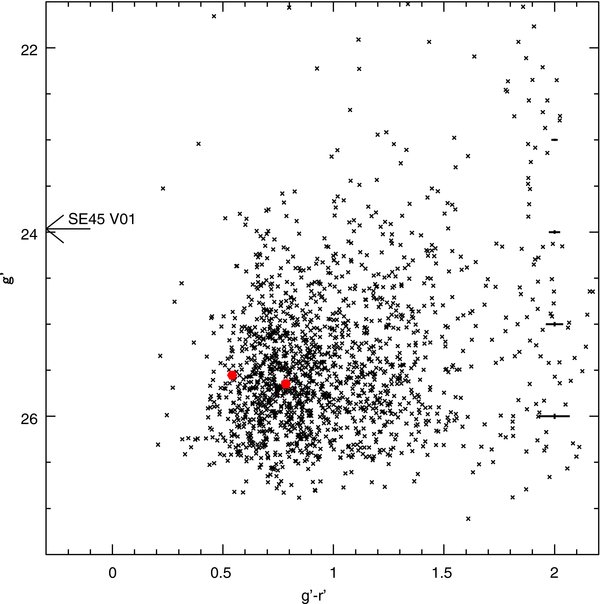
Figure 4. Color–magnitude diagram for the SE45 field including the variable stars (filled circles). A total of 1660 sources are plotted. The arrow marks the g'-band magnitude of SE45 V01, which has no r'-band data. The bold cross symbols located along g' − r' = 2.0 are the average uncertainties. The bins were ±0.2 about the selected g' magnitude.
Download figure:
Standard image High-resolution image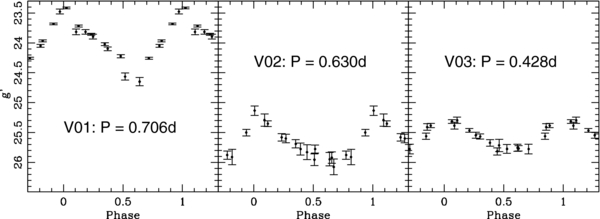
Figure 5. Light curves for the three variables found in the SE45 field.
Download figure:
Standard image High-resolution image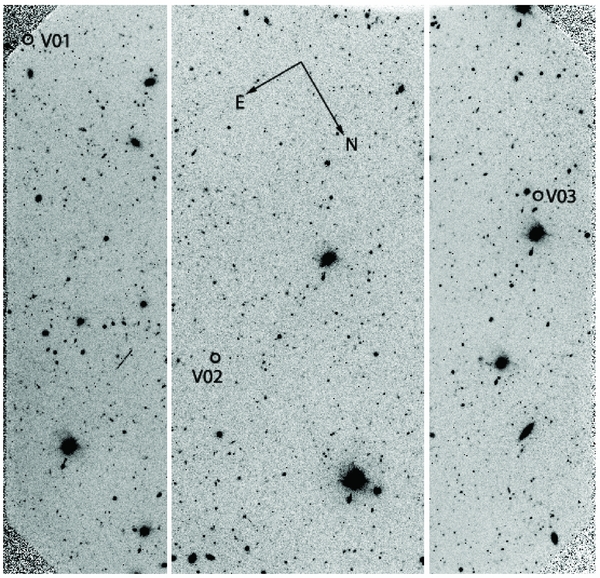
Figure 6. Finding chart for the three variables found in the SE45 field. The directions of north and east are indicated by the arrows.
Download figure:
Standard image High-resolution imageTable 2. Light Curve Properties for M33 SE45 Variable Stars
| ID | (R.A., Decl.) | Period | 〈g'〉 | 〈r'〉 | A'g | Classification |
|---|---|---|---|---|---|---|
| J2000.0 | (days) | |||||
| SE45 V01 | (01:36:57.7, +30:12:35.5) | 0.706 ± 0.002 | 23.965 | ⋅⋅⋅ | 1.20 | Cepheid? |
| SE45 V02 | (01:36:57.0, +30:16:13.1) | 0.630 ± 0.002 | 25.642 | 24.862 | 0.82 | RRab |
| SE45 V03 | (01:36:40.5, +30:16:18.9) | 0.428 ± 0.002 | 25.555 | 25.012 | 0.51 | RRc |
Download table as: ASCIITypeset image
Table 3. Epoch-by-epoch Photometry for M33 SE45 Variable Stars
| SE45 V01 | SE45 V02 | SE45 V03 | ||||
|---|---|---|---|---|---|---|
| HJD | g' |  |
g' |  |
g' |  |
| (+2453600.0) | (mag) | (mag) | (mag) | (mag) | (mag) | (mag) |
| 48.79277 | 24.049 | 0.024 | 25.777 | 0.099 | 25.386 | 0.058 |
| 48.86979 | 23.682 | 0.017 | 25.776 | 0.068 | 25.545 | 0.050 |
| 48.94729 | 23.413 | 0.014 | 25.947 | 0.113 | 25.815 | 0.060 |
| 49.05992 | 23.816 | 0.037 | 25.909 | 0.130 | 25.775 | 0.081 |
| 49.81029 | 23.895 | 0.040 | 25.133 | 0.078 | 25.716 | 0.102 |
| 49.87992 | 24.020 | 0.022 | 25.352 | 0.046 | 25.765 | 0.046 |
| 49.97492 | 24.223 | 0.028 | 25.599 | 0.073 | 25.561 | 0.054 |
| 50.05728 | 24.648 | 0.068 | 25.830 | 0.124 | 25.294 | 0.053 |
| 50.84772 | 24.258 | 0.016 | 25.918 | 0.096 | 25.383 | 0.037 |
| 50.92382 | 23.965 | 0.015 | 25.878 | 0.068 | 25.314 | 0.031 |
| 51.02583 | 23.476 | 0.041 | 25.501 | 0.056 | 25.566 | 0.044 |
| 51.12233 | 23.817 | 0.048 | 25.292 | 0.101 | 25.774 | 0.076 |
| 51.84283 | 23.716 | 0.016 | 25.581 | 0.061 | 25.464 | 0.031 |
| 51.91741 | 23.857 | 0.016 | 25.689 | 0.068 | 25.672 | 0.055 |
| 52.01577 | 24.097 | 0.031 | 25.955 | 0.096 | 25.755 | 0.059 |
| 52.11937 | 24.563 | 0.060 | 26.075 | 0.130 | 25.408 | 0.054 |
Download table as: ASCIITypeset image
The two RRL stars consist of one RRab star (SE45 V02) and one RRc star (SE45 V03). Their respective periods are keep together 0.630 ± 0.002 days and 0.428 ± 0.002 days, where the uncertainties were determined by adjusting the period about the best value until the scatter in the light curve increased. These classifications match with the colors of the stars, with the RRc star being bluer than the RRab star. The mean g'-band magnitude for the RRL stars is 25.60 ± 0.04 mag. From the completeness noted in Section 2, the percentage of stars found in the SE45 field at the RRL level is 80.2%. Theoretically, we should have found 2.5 RRL stars in this field, which compares well with the two we did find.
3.2. Southeast 25' Field
In this field (SE25), we found 14 candidate variable stars. Of these, 12 are RRL stars and two are candidate Cepheid-type stars. Figure 7 shows the CMD of the SE25 field. Compared to the SE45 field, the RGB and the red clump are better defined. The location of the variable stars falls in line with the red clump as expected. The light curves are shown in Figure 8, while Table 4 lists the properties of the variable stars, Table 5 lists the epoch-by-epoch photometry, and Figure 9 shows their location within the field. SE25 V07 does not have any r'-band photometry likely due to its proximity to a bright star as shown in Figure 9. The mean g'-band magnitude for SE25 V07 is an estimate since we cannot correct for color using Equation (1).
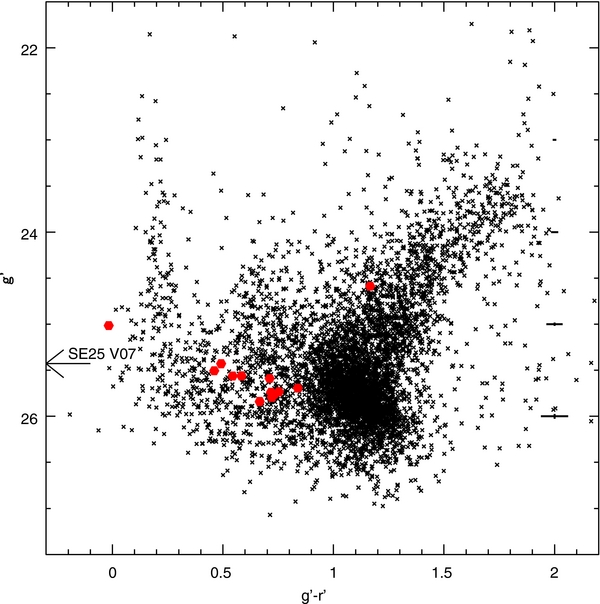
Figure 7. Color–magnitude diagram for the SE25 field including the variable stars (filled circles). A total of 5843 sources are plotted. The two brighter variable stars are candidate Cepheid stars. All of the RRL are of ab type. The bold cross symbols located along g' − r' = 2.0 are the average uncertainties. The bins were ±0.2 about the selected g' magnitude.
Download figure:
Standard image High-resolution image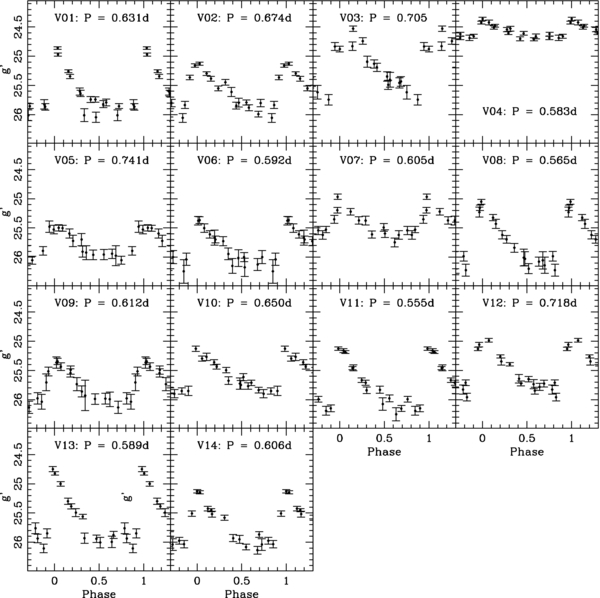
Figure 8. Light curves for the variable stars found in the SE25 field.
Download figure:
Standard image High-resolution image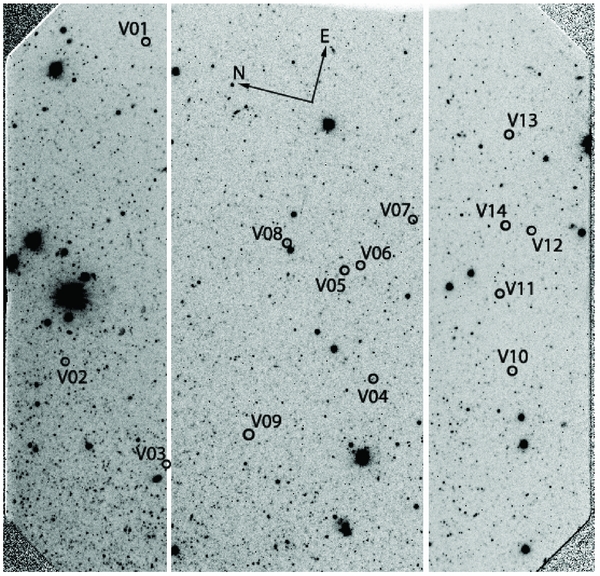
Figure 9. Finding chart for the variables found in the SE25 field. The directions of north and east are indicated by the arrows.
Download figure:
Standard image High-resolution imageTable 4. Light Curve Properties for M33 SE25 Variable Stars
| ID | (R.A., Decl.) | Period | 〈g'〉 | 〈r'〉 |  |
Classification |
|---|---|---|---|---|---|---|
| (days) | ||||||
| SE25 V01 | (01:35:38.4, +30:30:37.7) | 0.631 ± 0.005 | 25.541 | 25.044 | 1.14 | RRab |
| SE25 V02 | (01:35:23.4, +30:30:55.2) | 0.674 ± 0.005 | 25.590 | 24.879 | 0.89 | RRab |
| SE25 V03 | (01:35:19.4, +30:29:46.5) | 0.705 ± 0.01 | 25.049 | 25.031 | 1.20 | Cepheid? |
| SE25 V04 | (01:35:24.8, +30:27:53.2) | 0.583 ± 0.005 | 24.591 | 23.422 | 0.40 | Cepheid? |
| SE25 V05 | (01:35:29.5, +30:28:20.6) | 0.741 ± 0.01 | 25.795 | 25.073 | 0.52 | RRab |
| SE25 V06 | (01:35:29.9, +30:28:12.1) | 0.592 ± 0.004 | 25.834 | 25.173 | 0.77 | RRab |
| SE25 V07 | (01:35:32.4, +30:27:45.6) | 0.605 ± 0.005 | 25.429 | ⋅⋅⋅ | 0.62 | RRab |
| SE25 V08 | (01:35:30.3, +30:28:56.3) | 0.565 ± 0.002 | 25.721 | 24.981 | 1.15 | RRab |
| SE25 V09 | (01:35:21.4, +30:29:00.5) | 0.612 ± 0.005 | 25.760 | 25.026 | 0.76 | RRab |
| SE25 V10 | (01:35:26.2, +30:26:33.0) | 0.650 ± 0.01 | 25.562 | 24.977 | 0.75 | RRab |
| SE25 V11 | (01:35:29.6, +30:26:47.3) | 0.555 ± 0.005 | 25.727 | 25.021 | 1.17 | RRab |
| SE25 V12 | (01:35:32.6, +30:26:34.6) | 0.718 ± 0.004 | 25.431 | 24.937 | 0.82 | RRab |
| SE25 V13 | (01:35:36.8, +30:26:55.8) | 0.589 ± 0.005 | 25.567 | 25.018 | 1.30 | RRab |
| SE25 V14 | (01:35:32.7, +30:26:50.1) | 0.606 ± 0.005 | 25.698 | 24.855 | 0.93 | RRab |
Download table as: ASCIITypeset image
Table 5. Epoch-by-epoch Photometry for M33 SE25 Variable Stars
| SE25 V01 | SE25 V02 | SE25 V03 | SE25 V04 | SE25 V05 | SE25 V06 | SE25 V07 | SE25 V08 | SE25 V09 | SE25 V10 | SE25 V11 | SE25 V12 | SE25 V13 | SE25 V14 | ||||||||||||||||||||||||||||
|---|---|---|---|---|---|---|---|---|---|---|---|---|---|---|---|---|---|---|---|---|---|---|---|---|---|---|---|---|---|---|---|---|---|---|---|---|---|---|---|---|---|
| HJD | g' |  |
g' |  |
g' |  |
g' |  |
g' |  |
g' |  |
g' |  |
g' |  |
g' |  |
g' |  |
g' |  |
g' |  |
g' |  |
g' |  |
|||||||||||||
| (+2453600.0) | (mag) | (mag) | (mag) | (mag) | (mag) | (mag) | (mag) | (mag) | (mag) | (mag) | (mag) | (mag) | (mag) | (mag) | (mag) | (mag) | (mag) | (mag) | (mag) | (mag) | (mag) | (mag) | (mag) | (mag) | (mag) | (mag) | (mag) | (mag) | |||||||||||||
| 48.8187 | 25.603 | 0.061 | 25.795 | 0.077 | 25.094 | 0.095 | 24.687 | 0.046 | 25.477 | 0.097 | 25.377 | 0.073 | ⋅⋅⋅ | ⋅⋅⋅ | 26.055 | 0.149 | 25.703 | 0.144 | 25.747 | 0.076 | 25.453 | 0.050 | 25.642 | 0.073 | 25.761 | 0.093 | 26.039 | 0.100 | |||||||||||||
| 48.8961 | 25.741 | 0.052 | 25.882 | 0.049 | 25.191 | 0.071 | 24.423 | 0.025 | 25.498 | 0.054 | 25.611 | 0.064 | 25.620 | 0.076 | 26.223 | 0.102 | 25.346 | 0.054 | 25.712 | 0.047 | 25.712 | 0.044 | 25.649 | 0.044 | 25.848 | 0.077 | 26.034 | 0.065 | |||||||||||||
| 48.9851 | 25.820 | 0.061 | 25.802 | 0.064 | 25.492 | 0.078 | 24.480 | 0.024 | 25.594 | 0.078 | 25.727 | 0.077 | 25.619 | 0.072 | 25.155 | 0.047 | 25.543 | 0.071 | 25.898 | 0.071 | 25.830 | 0.061 | 25.781 | 0.061 | 25.000 | 0.039 | 25.130 | 0.030 | |||||||||||||
| 49.0859 | 26.012 | 0.093 | 25.835 | 0.060 | 25.433 | 0.082 | 24.528 | 0.041 | 25.698 | 0.105 | 26.016 | 0.143 | 24.966 | 0.045 | 25.432 | 0.078 | 25.928 | 0.260 | 25.849 | 0.081 | 26.250 | 0.114 | 25.828 | 0.078 | 25.492 | 0.068 | 25.520 | 0.051 | |||||||||||||
| 49.8355 | 25.867 | 0.055 | 25.159 | 0.029 | 25.618 | 0.116 | 24.660 | 0.040 | 25.906 | 0.095 | 25.998 | 0.111 | 25.372 | 0.064 | 26.028 | 0.120 | 25.983 | 0.093 | 25.297 | 0.044 | 25.127 | 0.030 | 25.956 | 0.066 | 26.005 | 0.090 | 25.930 | 0.062 | |||||||||||||
| 49.9242 | 24.859 | 0.022 | 25.297 | 0.031 | 25.745 | 0.089 | 24.688 | 0.028 | 25.960 | 0.082 | 26.037 | 0.105 | 25.611 | 0.061 | 26.076 | 0.078 | 26.133 | 0.105 | 25.359 | 0.042 | 25.459 | 0.028 | 25.131 | 0.028 | 25.877 | 0.061 | 26.081 | 0.048 | |||||||||||||
| 50.0118 | 25.345 | 0.037 | 25.551 | 0.044 | 24.877 | 0.050 | 24.660 | 0.034 | 25.956 | 0.089 | 25.366 | 0.061 | 25.596 | 0.066 | 25.985 | 0.084 | 26.037 | 0.128 | 25.494 | 0.048 | 25.839 | 0.056 | 24.983 | 0.031 | 25.937 | 0.074 | 25.868 | 0.050 | |||||||||||||
| 50.1123 | 26.010 | 0.109 | 25.613 | 0.079 | 24.827 | 0.073 | 24.422 | 0.041 | 25.975 | 0.171 | 25.666 | 0.131 | ⋅⋅⋅ | ⋅⋅⋅ | 25.229 | 0.087 | 25.365 | 0.097 | 25.723 | 0.097 | 26.075 | 0.106 | 25.347 | 0.062 | 24.749 | 0.043 | ⋅⋅⋅ | ⋅⋅⋅ | |||||||||||||
| 50.8223 | 25.741 | 0.048 | 25.845 | 0.058 | 24.529 | 0.045 | 24.604 | 0.026 | 25.942 | 0.081 | 26.151 | 0.127 | 25.527 | 0.055 | 25.618 | 0.070 | 25.492 | 0.070 | 25.767 | 0.057 | 25.990 | 0.049 | 25.261 | 0.027 | 25.386 | 0.045 | 25.147 | 0.028 | |||||||||||||
| 50.8991 | 25.793 | 0.058 | 25.791 | 0.045 | 24.739 | 0.057 | 24.701 | 0.034 | 26.052 | 0.067 | 25.999 | 0.078 | 25.197 | 0.049 | 25.840 | 0.076 | 25.860 | 0.095 | 25.837 | 0.050 | 26.148 | 0.060 | 25.393 | 0.028 | 25.562 | 0.037 | 25.451 | 0.027 | |||||||||||||
| 50.9889 | 25.853 | 0.040 | 25.991 | 0.047 | 25.131 | 0.071 | 24.709 | 0.026 | 25.893 | 0.073 | 26.125 | 0.103 | 25.222 | 0.056 | 26.197 | 0.086 | 25.989 | 0.090 | 25.851 | 0.055 | 25.185 | 0.026 | 25.722 | 0.040 | 25.940 | 0.062 | 25.581 | 0.045 | |||||||||||||
| 51.0907 | 25.824 | 0.079 | 26.056 | 0.075 | 25.347 | 0.078 | 24.621 | 0.033 | ⋅⋅⋅ | ⋅⋅⋅ | 26.244 | 0.203 | 25.374 | 0.074 | 26.138 | 0.140 | 25.994 | 0.123 | 25.128 | 0.047 | 25.667 | 0.039 | 25.734 | 0.077 | 25.994 | 0.099 | 25.952 | 0.068 | |||||||||||||
| 51.8185 | 24.972 | 0.029 | 25.365 | 0.038 | 25.403 | 0.126 | 24.361 | 0.028 | 25.527 | 0.074 | 25.503 | 0.074 | 25.491 | 0.066 | 25.051 | 0.042 | 25.976 | 0.097 | 25.268 | 0.062 | 25.977 | 0.058 | 25.846 | 0.058 | 26.107 | 0.075 | 26.138 | 0.064 | |||||||||||||
| 51.8928 | 25.259 | 0.024 | 25.128 | 0.026 | 25.457 | 0.088 | 24.507 | 0.031 | 25.504 | 0.052 | 25.698 | 0.060 | 25.748 | 0.077 | 25.322 | 0.053 | 25.517 | 0.076 | 25.435 | 0.039 | 26.152 | 0.051 | 25.724 | 0.060 | 24.822 | 0.028 | 25.977 | 0.059 | |||||||||||||
| 51.9793 | 25.637 | 0.055 | 25.385 | 0.040 | ⋅⋅⋅ | ⋅⋅⋅ | 24.542 | 0.037 | 25.720 | 0.098 | 25.945 | 0.100 | 25.543 | 0.070 | 25.695 | 0.068 | 25.435 | 0.064 | 25.674 | 0.064 | 26.190 | 0.075 | 25.711 | 0.050 | 25.300 | 0.053 | 25.510 | 0.047 | |||||||||||||
| 52.0883 | 26.046 | 0.089 | 25.445 | 0.049 | 24.832 | 0.068 | 24.608 | 0.032 | 25.923 | 0.019 | 26.174 | 0.157 | 25.351 | 0.067 | 26.008 | 0.144 | 25.733 | 0.111 | 25.614 | 0.062 | 25.162 | 0.035 | 25.060 | 0.039 | 25.932 | 0.086 | 25.426 | 0.040 | |||||||||||||
Download table as: ASCIITypeset image
As one can see in the CMD, the colors for the two bright variable stars show that they are displaced from the RRL stars. SE25 V03 falls near the edge of one chip, which may affect its photometry. We examined the r'-band data to see at what phases that data fall. The phases occur at locations that suggest that the "odd" colors are a result of inadequate phase coverage. On the other hand, the candidate RRL stars fall within the expected color region. The percentage of stars found in the SE25 field is 67.4% from the completeness study done in Section 2. Therefore, we could possibly have found 17.8 RRL stars or about six more in this field.
All of the RRL stars in this field are of RRab type. The mean period for these stars is 0.628 ± 0.055 days. The large uncertainty follows from the scatter among the periods as seen in Table 4. The mean g'-band magnitude for the RRL stars is 25.64 ± 0.14 mag. The uncertainties in both cases are the standard deviation of the mean.
4. ANALYSIS
In the following analysis, we make the assumption that the RRL stars in M33 have the same properties as those found in the Milky Way. This may not be the case given the different star formation histories and chemical abundances. For example, differences in helium and [α/Fe] abundances can affect the evolution of horizontal branch (HB) stars (e.g., Catelan 1993).
4.1. RR Lyrae Properties
The mean magnitudes for the RRL stars in each field are the same considering the uncertainties. This confirms that the two RRLs found in the SE45 field belong to M33. It is interesting to detect RRL stars in a field so distant from the center of M33. Looking at the CMD for this field (Figure 4), the lack of a clear RGB as compared to the SE25 field might lead one to conclude that there is a lack of an old stellar population in this field. The existence of the RRL stars, whose magnitudes match those from an inner field, clearly indicates that M33 extends out to this distance and contains an old stellar population. For comparison, Davidge (2003) observed a field adjacent to SE45 using GMOS on Gemini North. Using multiple filters with the GMOS instrument at Gemini North, Davidge studied the upper RGB and detected asymptotic giant branch stars. This was seen as representative of an intermediate-age population occurring well outside the M33 star-forming disk. Although our CMD (Figure 4) is deeper than the Davidge CMD, no clear main-sequence plume or RGB is present. Grossi et al. (2011) observed a field near our SE45 field. The CMD produced from that field (Figure 2, Grossi et al.) does show a clear RGB. This leads us to conclude that our field happened to be sparsely populated.
The mean period of the RRL stars can be used to classify what type of population they derive from. There is a general relation between the metallicity of a stellar population and the mean period of the RRL stars (e.g., Sandage 1993; Layden 1995). In general, the shorter the mean period, the more metal-rich the population is. For example, the globular clusters in the Milky Way typically break down into one of two groups (Oosterhoff 1939): Oosterhoff I (metal-rich; shorter mean period for the RRL; 〈Pab〉 ∼ 0.55 days, 〈Pc〉 ∼ 0.32 days, Nc/NRR = 0.17; Smith 1995; M. Catelan et al. 2012, in preparation) and Oosterhoff II (metal-poor; longer mean period; 〈Pab〉 ∼ 0.65 days, 〈Pc〉 ∼ 0.35 days, Nc/NRR = 0.48; Smith 1995; M. Catelan et al. 2012, in preparation). We must be cautious when referring to the Oosterhoff dichotomy when discussing the RRLs in M33 since it is unknown if such a dichotomy exists for that galaxy. Although we will reference these classes, we will mainly concentrate on the general trends we observe.
Due to the lack of RRL stars in SE45, we cannot draw any firm conclusions about the nature of the population that these stars derive from. The mean period in SE25 (0.628 ± 0.055 days) classifies that population as an Oosterhoff II type. This argues that the RRab stars we detected in the SE25 field (and the one found in the SE45 field) derive from a more metal-poor stellar population (see Section 4.2 for further discussion). The mean period for the RRab stars in the SE25 field is much longer than that found by Sarajedini et al. (2006) for inner fields of M33. The two different fields they observed had RRab mean periods of 0.489 ± 0.094 days (Field U49, 29 RRab stars) and 0.468 ± 0.091 days (Field M9, 35 RRab stars). The average of both fields is 0.478 ± 0.092 days. Sarajedini et al. argue that they have found a disk and halo population of RRL stars. For their halo population, they determined a mean period of 0.54 days from a histogram of the logarithm of the periods. In either situation, these periods are much shorter than what we have found. The RRL described in Yang et al. (2010) for the innermost field along the southwest major axis have a longer mean period (P ∼ 0.553 ± 0.008 days) compared to the halo population of Sarajedini et al. The Sarajedini et al. sample contains only three stars out of 64 that have periods equal to or longer than 0.600 days, while approximately 23% of the RRab stars in the innermost field of Yang et al. fall in that range. From our data for the SE25 field, 67% (eight out of twelve) have periods in this range. Also, none of the RRc stars in Yang et al. have a period as long as the one detected in the SE45 field.
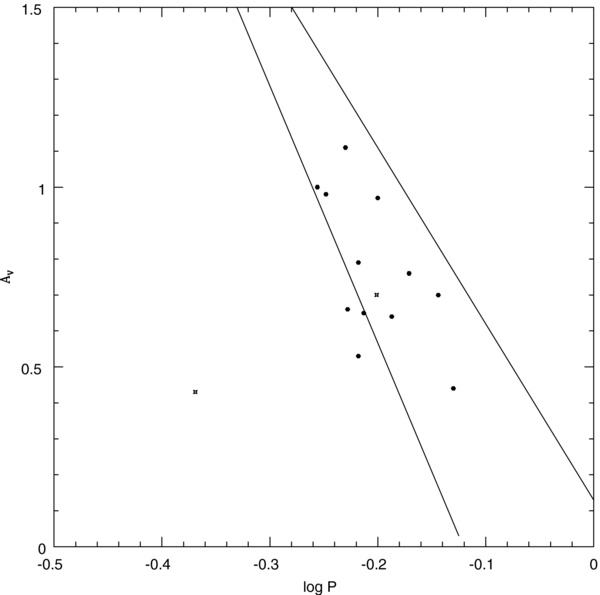
Figure 10 shows the period–amplitude diagram for the RRL stars in the two fields we observed. The g' amplitudes were converted to V amplitudes via the relation  (de Lee 2008). The lines on the left and on the right are the Oosterhoff I and Oosterhoff II lines, respectively (Clement & Rowe 2000). Although the mean period for the RRab stars in SE25 falls closer to the typical Oosterhoff II mean period, their location in the period–amplitude diagram places them somewhere between the two lines. This is clearly different from what is seen in the inner field of M33 as seen in Figure 18 of Yang et al. (2010). In that figure, the majority of RRab stars fall to the left of or near the Oosterhoff I line. We do not include the RRL from the Sarajedini et al. (2006) paper given there is more uncertainty with those periods due to the limited phase coverage as compared to Yang et al. From the differences in the period-amplitude diagram and the mean periods, it is clear that the RRLs from the inner and outer fields derive from different stellar populations with the outer fields apparently deriving from a more metal-poor population.
Figure 10. Period–amplitude diagram for the RR Lyrae stars in M33 (SE45, starred; SE25, points). The Oosterhoff I and Oosterhoff II lines (left and right, respectively) are from Clement & Rowe (2000).
Download figure:
Standard image High-resolution image
Another interesting property is the lack of RRc stars in the SE25 field. We would expect to detect at least a couple of RRc stars, given Sarajedini et al. (2006) and Yang et al. (2010) found a small number of them. On average, RRc stars have smaller amplitudes than RRab stars. This lower amplitude combined with the errors in the measured magnitude may have led to the variability indices of these stars not being high enough to be detected. We searched through lower variability indices for RRc stars and were not successful in finding any. As noted in Section 2, the lack of RRc stars is not due to our detection methods. The Sarajedini et al. (2006) RRc stars have some unusual properties as well. Most of them have unusually long periods (>0.5 days) for that class of RRL star, especially when you factor in the short periods of the RRab stars also detected in that data. Sarajedini et al. note that these stars may be misclassified RRab stars.
In an effort to check the classification of the RRc stars and the shorter period RRab stars, we requested the photometric data for the RRL detected by Sarajedini et al. (2006) from A. Sarajedini et al. (2010, private communications). The periods were re-examined using the same methods as outlined in this paper. For the most part, the periods we determined matched those found by Sarajedini et al. Of the eight RRc stars, we found that four of them had light curves closer to the standard RRab type. All of these RRc stars had periods greater than 0.50 days. Another of the longer period RRc stars had a shorter alternate period. This confirms the uncertainty Sarajedini et al. mentioned about their RRc stars. For our analysis of the Sarajedini et al. RRab stars, 12 had period changes to longer periods, four had a type change to RRc stars, and six others had notable scatter that made it difficult yield firm periods. The majority of these changes were for the short-period RRab stars that were suggested to belong to the disk. With these changes, there is less of a distinction between possible disk and halo RRab stars in the Sarajedini et al. paper. In fact, using data with better phase coverage, Yang et al. (2010) did not detect similar short-period RRab stars, but they did detect a number of RRc stars (Nc/NRR = 0.22).
Studying the mean periods of the different RRL types and their distribution gives us some clues to the nature of the HB morphology and the stellar populations in M33. Metallicity is the main parameter that will determine the HB morphology. For Galactic globular clusters, we see a transition from an HB with most of the stars toward the red side to most of the stars on the blue side with decreasing metallicity (see Catelan 2009 and references therein). This change in the HB morphology is used to understand the general properties of RRL stars. Metal-rich globular clusters tend to have more RRab stars, which fall toward the red side of the instability strip. Metal-poor globular clusters tend to have a higher percentage of RRc stars along with longer period RRL stars. This makes the SE25 field we observed in M33 a contradiction according to our data set. The RRab stars have long periods, but lack RRc stars. Therefore, it does not fit in the Oosterhoff II category by the strictest definition. On the other hand, the inner field noted in Yang et al. (2010; 〈Pab〉 ∼ 0.553 day, 〈Pc〉 ∼ 0.352 days, Nc/NRR = 0.22) falls in line with the typical Oosterhoff I classification. Galaxies are more complex systems compared to globular clusters, which makes them likely to have more than one property affecting the HB morphology. From the properties of the RRL stars in M33, there must be an additional parameter besides metallicity that is affecting the HB of M33 to cause its morphology to be redder yet keep the longer periods for the RRab stars. This agrees with the finding by Sarajedini et al. (2000) that the halo globular clusters in M33 have another parameter besides metallicity affecting their HB morphology. The M33 globular clusters they studied tended to have redder HBs than expected for their metallicities. They suggested age as being the secondary parameter affecting the HB of the globular clusters.
4.2. RR Lyrae Metallicities
As noted above, RRL stars show a general trend of decreasing periods with increasing metallicity. We can use this property to estimate the metallicity of the RRL stars. We will use the formula derived by Sarajedini et al. (2006) using data from 132 Galactic RRL stars in the solar neighborhood. The relation is

For our data, we find a metallicity on the Zinn & West (1984) scale for the one SE45 RRab star to be −1.86 dex. For the SE25 field, the RRab stars yield a mean metallicity of [Fe/H] = −1.84 ± 0.30 dex, where the uncertainty is the standard error of the mean. This mean metallicity is much more metal-poor than that found by Sarajedini et al. (−1.3 dex for the halo RRL). It is unclear why there is such a clear difference between the metallicities from our study and Sarajedini et al. The mean metallicity for the RRab stars we have measured here is among the most metal-poor measurements made for M33. Sarajedini et al. (2000) found the most metal-poor of the M33 globular clusters to be [Fe/H]] = −1.64. McConnachie et al. (2006) studied the kinematics of the stars in a field about 38' in projected distance along the southern major axis. They were able to separate the stars into a halo, a disk, and an unknown component. For the halo and disk components they found metallicities of −1.5 ± 0.1 dex and −0.9 ± 0.1 dex, respectively. Tiede et al. (2004) found that the metallicity distribution function for a field 20' in projected distance to the southeast of M33 had a peak near [Fe/H] = −1.1 that tailed off to lower metallicities, which overlaps with our mean metallicity measurement. They conclude from the radial gradient that the vast majority of the stars in that field actually belong to the disk and not the halo.
We must be slightly cautious about drawing any firm conclusions regarding the metallicities we have calculated. As noted above, there may be another parameter besides metallicity affecting the HB and there may be some chemical abundance differences between the M33 and Milky Way RRL populations. For example, Feast et al. (2010) found a small radial gradient in the mean periods of RRL stars within the Large Magellanic Cloud. This can affect the metallicities estimates made from these RRL stars. Therefore, our calculated metallicities may not reflect the true metallicity of the RRL stars within M33.
4.3. M33 Distance
One of the most useful properties of RRL stars is their nearly constant mean luminosity that makes them ideal standard candles. Before we can determine the distance to M33, we need to convert the g'-band magnitudes to Johnson V-band magnitudes. The mean g'-band magnitude for the RRL stars is 25.64 ± 0.06 mag for the SE25 field, where the error is the standard error of the mean. The conversion from Fukugita et al. (1996) is

which is valid for stars with B − V ⩽ +1.5. Taking the typical B−V for RRL stars to be 0.293 mag (Wilhelm et al. 2007), we find V(RR) = 25.60 ± 0.06 mag, where the error is the standard error of the mean.
To determine the absolute magnitude of the RRL stars, we use the relation

from Cacciari & Clementini (2003). Taking the mean metallicity of the SE25 RRL to be −1.84 ± 0.30 dex, we find MV(RR) = 0.51 ± 0.16 mag, where the errors were determined in quadrature.
We have adopted a reddening toward M33 to be E(B − V) = 0.12 ± 0.02 (Massey et al. 2007) and an extinction relation of AV = 3.1E(B − V). This yields a value of AV = 0.40 mag. Together these data give a true distance modulus of 〈(m − M)0〉 = 24.69 ± 0.17 mag. This is very close to the value found by Sarajedini et al. (2006) for their RRL stars (24.67 ± 0.08 mag). Our distance also matches very well with other distance measurements based on the tip of the RGB (24.64 ± 0.15, Galleti et al. 2004; 24.69 ± 0.07, Tiede et al. 2004).
Although it is encouraging that our distance modulus agrees well with previous estimates given the assumptions we have made, we cannot in turn say that this confirms the metallicity we found in Section 4.1 as being the true metallicity. If we would have used a metallicity of [Fe/H] = −1.60 dex, the absolute magnitude would then be MV(RR) = 0.56 ± 0.16 mag. This yields a true distance modulus of 〈(m − M)0〉 = 24.64 ± 0.17 mag. This is a bit shorter than what we previously found, but still matches well with the other estimates.
4.4. Halo RR Lyrae?
A key question we wanted to answer in this investigation was: does M33 have a halo RRL population? The initial observational plan was to make use of three different fields along the southeast minor axis of M33 to observe the trends we see in the RRL properties along with an investigation of the stellar populations within those fields. As noted in Section 2, the innermost field in our survey was too crowded to detect RRLs accurately. However, we can make use of the Sarajedini et al. (2006) and Yang et al. (2010) results for two inner fields to aid in our analysis. Although Sarajedini et al. argued that some of the RRLs they detected belonged to the disk, the RRLs found by Yang et al. and our reanalysis in Section 4.1 tend to argue against a clear distinction between disk and halo RRLs. However, there is a noticeable difference between the properties of the RRLs of the inner and outer fields. The inner field RRL have shorter periods on average and are likely to be more metal-rich. Sarajedini et al. and Yang et al. suggest that all of these RRLs belong to the halo, but they clearly have different properties from the RRLs seen in the two fields observed in this paper.
The SE25 field overlaps with fields studied by Tiede et al. (2004) using the WIYN 3.5 m telescope and Barker et al. (2007a) using the Hubble Space Telescope. Analysis of the CMD by Tiede et al. revealed a metallicity distribution function that is consistent with variations seen in the inner disk regions of M33. They concluded that the vast majority of stars in the field belong to the disk rather than the halo. Barker et al. found that the radial distribution and metallicity gradient in their fields are similar to the inner disk, but they could not rule out a small thick disk or halo component, particularly in their outermost field. If most of the stars in the SE25 field belong to the disk, it would seem to argue that the RRL stars would belong to the disk as well, even though the mean period of the RRab stars would argue that they are more metal-poor than those in the inner fields. However, the ratio of RRLs in the two fields indicates the RRLs are from a halo distribution. If we correct for completeness, there are approximately 18 and 2.5 RRL in the 10 kpc and 19 kpc fields (deprojected distances), respectively (see Section 4.1). That ratio of about 7.2 is more consistent with the expectations from an R−3.5 halo distribution than an exponential disk.
We look to recent RRL studies in M31 to provide another point of view for the difference we are seeing between the inner and outer fields of M33. Brown et al. (2004) studied a field about 11 kpc to the southeast of M31 along the minor axis. They found 29 RRab stars (〈Pab〉 = 0.594 days), 25 RRc stars (〈Pc〉 = 0.316 days), and one RRd star. As was noted in their paper, the mean period for the RRab stars is Oo-Int (between the two Oosterhoff types), while the RRc mean period is more like Oo-I. The ratio of RRc to RRL stars is 0.46, which matches with the Oo-II class. Brown et al. determined that the mean metallicity of the M31 halo is −0.8 dex through an analysis of the CMD, while the mean metallicity for the RRab stars they detected is −1.77 dex.
Sarajedini et al. (2009) presented the results of a variable star search for two fields at 4 and 6 kpc to the southeast of M31. The two fields have 〈Pab〉 of 0.553 days and 0.561 days, 〈Pc〉 of 0.326 days and 0.327 days, and Nc/NRR of 0.18 and 0.19, respectively. Both of these fields are quite similar to each other, yet quite different from the Brown et al. (2004) field. All of the RRL properties point to an Oo-I classification for these RRLs. The mean metallicities derived from the RRLs are −1.46 dex (Field 1) and −1.54 dex (Field 2). In comparing their metallicity distribution to that from Brown et al., Sarajedini et al. found that their sample contained a small, but noticeable metal-rich ([Fe/H] < −1) population. It was argued that even though this is the case, these RRLs also belong to the halo since their metallicity is more metal-poor than the disk.
Comparing the inner and outer fields observed in M31 shows that the RRLs in the outer field have a longer mean RRab period and therefore tend to be more metal-poor. The majority of the RRab stars in the Brown et al. (2004) field fall between the Oo-I and Oo-II lines in the period–amplitude diagram (see their Figure 9), whereas most of those in the inner fields fall to the left of the Oo-I line (toward shorter periods; Figure 10 in Sarajedini et al. 2009). This is the same pattern we see when comparing the RRab stars in the outer fields of this study and those from Sarajedini et al. (2006) and Yang et al. (2010). Although we are only comparing two data points (inner versus outer), the question may be asked that if all of the RRLs belong to the halo, why is there such a difference between the two fields seen in both galaxies? It is possible that the inner fields are "contaminated" by disk RRLs that might tend to be more metal-rich, while we are observing a "purer" halo RRL population in the outer fields. Or, could we be seeing a distinction between an inner and outer halo? Clearly, a more detailed study of RRL stars in numerous fields in both M33 and M31 are needed to better resolve this issue.
5. SUMMARY AND CONCLUSIONS
We present the detection of RRL stars in fields 45' (projected distance of 10.8 kpc; deprojected distance of about 19 kpc) and 25' (projected distance of 5.6 kpc; deprojected distance of about 10 kpc) to the southeast of M33. Their discovery in the SE45 field is the most distant any RRL stars have been detected from the center of M33. The mean periods for the RRab stars (0.630 ± 0.002 days for one star in SE45 and 0.628 ± 0.055 days for 12 stars in SE25) are much longer than those found in the inner fields (Sarajedini et al. 2006; Yang et al. 2010). It is unclear why there is such a stark difference.
In general, longer RRL periods means the stellar population is metal-poor. From our data, we find 〈[Fe/H]〉 = −1.84 ± 0.30 dex for the RRab stars in the SE25 field and −1.86 dex for the one RRab star in the SE45 field. These are among the most metal-poor measurements for stars in M33. However, we must be cautious with these metallicity estimates given secondary parameters may affect the HB. From the mean magnitude of the RRL stars, we determined a true distance modulus of 〈(m − M)0〉 = 24.69 ± 0.17 mag. This matches with previously determined distance measurements.
Using the properties of the RRL stars (period distribution, metallicity, and reddening), Sarajedini et al. (2006) argued for detecting two distinct populations, a disk and a halo component. In our data, we do not see a clear separation in the properties of the RRab stars. The longer periods for the RRL in our study compared to that of Sarajedini et al. (2006) would argue that we are looking at the halo population of M33. Examining the SE25 field, there is clearly a young stellar population associated with the disk. As noted above, Tiede et al. (2004) concluded that the majority of stars in a field 20' to the southeast of M33 belonged to the disk. If the RRLs we see in the SE25 field do belong to the halo, then we may conclude that the disk is too metal-rich to create RRLs or the disk stars are not old enough or a combination of the two. If the RRLs in that field do belong to the disk instead, we can conclude that M33 has a weak old (>10 Gyr) halo population and components of the disk are old and may be quite metal-poor.
Looking at the SE45 field, we see that the CMD is lacking any young stellar population. This would tend to argue that the two RRLs we detect in this field belong to the halo. Their long periods and distance match those seen in the SE25 field. Combining the properties we see in the RRLs we have detected in both fields, we conclude that we are primarily seeing a halo distribution.
We thank A. Sarajedini for generously sharing his data, P. B. Stetson for the use of his data reduction programs, A. C. Layden for the use of his light curve analysis programs, and N. De Lee for helping with the conversions from the g' band to the Johnson V band. We especially thank M. Buttermore who helped with the first run through of the data reductions.
E.O. was partially supported by NSF grant AST0807498. This research has made use of the NASA/IPAC Extragalactic Database (NED) which is operated by the Jet Propulsion Laboratory, California Institute of Technology, under contract with the National Aeronautics and Space Administration.
Footnotes
- *
Based on observations obtained at the Gemini Observatory, which is operated by the Association of Universities for Research in Astronomy, Inc., under a cooperative agreement with the NSF on behalf of the Gemini partnership: the National Science Foundation (United States), the Particle Physics and Astronomy Research Council (United Kingdom), the National Research Council (Canada), CONICYT (Chile), the Australian Research Council (Australia), CNPq (Brazil), and CONICET (Argentina).
- 6
IRAF is distributed by the National Optical Astronomy Observatory, which is operated by the Association of Universities for Research in Astronomy, Inc., under cooperative agreement with the National Science Foundation.