


ABSTRACT
We have used the Photodetector Array Camera and Spectrometer and Spectral and Photometric Imaging REceiver instruments on the Herschel Space Observatory to observe Cir X-1 both in and out of outburst. We detected Cir X-1 during outburst at 70 μm. Unfortunately, a cold background source dominates Cir X-1 at longer wavelengths. We have assembled optical and infrared (IR) data for Cir X-1 to model its spectral energy distribution (SED) in both quiescence and outburst and find that in both states it is consistent with a heavily reddened, 10,000 K blackbody. We believe this behavior is completely consistent with previous suggestions that these outbursts are due to accretion disk events, not unlike those of dwarf novae. To explore the behavior of other low-mass X-ray binaries with reported synchrotron jets, we have extracted and/or compiled optical and near- and mid-IR data sets for five such systems to construct their SEDs. The Z-source GX 349+2 and the black hole system GRS 1915+105 have strong and variable mid-IR excesses that suggest synchrotron emission. The other Z-sources have rather weak (or no) IR excesses that can be explained as reddened blackbody spectra with the addition of either synchrotron or bremsstrahlung components.
Export citation and abstract BibTeX RIS
1. INTRODUCTION
Cir X-1 was discovered during a rocket-borne X-ray experiment in 1969 (Margon et al. 1971). Follow-up observations showed that the source was unusual in that it exhibited periodic X-ray and radio emission that repeated on a 16.6 day cycle (see Whelan et al. 1977 and references therein). Within a few years of its discovery, a model was proposed for Cir X-1 that remains to this day: an eccentric binary that undergoes increased mass transfer at periastron passage (Kaluzienski et al. 1976). The visual counterpart was quickly identified as a V ≃ 20 star with strong Hα emission (Mayo et al. 1976). The arguments then began about the composition of the underlying system. Follow-up spectra, however, could not derive any further information on the masses of the components in this binary. The nature of the non-degenerate mass donor in Cir X-1 continues to be a mystery, as does the exact distance and reddening of this source.
Observations of Cir X-1 showed that it shared properties with both black hole and neutron star X-ray binaries. For example, near-infrared (IR) monitoring of this source by Glass (1994) found that in the late 1970s, Cir X-1 maintained a very high luminosity, ∼3 mag brighter in the K band than it is at present. At that time, it reached K = 7.7 in outburst! During this epoch, the radio flares at periastron passage reached ∼1 Jy (e.g., Haynes et al. 1978). This high luminosity state is reminiscent of black hole systems, especially the soft X-ray transients (see Gelino et al. 2010 and references therein). Then in the early 1980s, X-ray observations using EXOSAT showed the presence of "Type I" X-ray bursts (Tennant et al. 1986). A Type I X-ray burst is due to a thermonuclear runaway on the surface of a neutron star. No black hole systems show these types of events. Thus, evidence mounted for a neutron star primary. Unfortunately, the Type I X-ray bursts from Cir X-1 stopped shortly after they were first discovered, and only resumed recently (Linares et al. 2010; Sell et al. 2010).
Eventually, X-ray observations with improved sensitivity and temporal resolution were obtained and the case was closed as to the identity of the compact object in Cir X-1: the source was observed to exhibit "Z-like" behavior (Shirey et al. 1999). Z-sources are low-mass X-ray binaries (LMXBs) where the neutron star primary is accreting mass at a rate that is close to the Eddington limit. The Z-source moniker arises from the pattern that these sources trace out in an X-ray color–color diagram. Cir X-1, however, is not a normal Z-source in that it only occasionally exhibits this type of behavior. In addition, no Z-source has ever been observed to undergo a dramatic, long-lived bright phase like that observed in the 1970s for Cir X-1.
The main characteristic that makes Cir X-1 unusual among X-ray binaries is that it has been shown to have an ultrarelativistic jet, which has been imaged in both the radio and X-ray and extends to parsec scales. Sell et al. (2010) find that the X-ray morphology of this jet is completely consistent with the structures seen at radio wavelengths (e.g., Fender et al. 2004). This jet displays an X-ray/radio termination shock, similar to those seen in radio galaxies. Sell et al. conclude that these shocks are due to cooled synchrotron emission.
The investigation into the mid-IR emission of LMXBs with black hole primaries has shown that synchrotron emission from their relativistic jets is important at these wavelengths (Gallo et al. 2007; Gelino et al. 2010). As discussed in Gallo et al., the critical region for characterizing jet emission from stellar mass objects often occurs in the near- to mid-IR spectral region, where the "break frequency" of the self-absorbed jet emission is present (e.g., Russell et al. 2013; Gandhi et al. 2011). With the assumption of non-thermal synchrotron emission for their mid-IR excesses, Gallo et al. estimate that the jets in the black hole systems that they studied have luminosities of 1032-34 erg s-1. Fender et al. (1997) found that the flares in the K band and radio (15 GHz) for the black hole system GRS 1915+105 have similar durations, suggesting that these features are related. Assuming a synchrotron spectrum, they found that the luminosity from the jet was of the order of 1036 erg s-1. The fact that the decay times at these two disparate frequencies were roughly the same showed that synchrotron and/or inverse Compton losses were not dominant. They suggested that adiabatic expansion losses could explain the frequency-independent flare durations.
A similar set of results does not yet exist for LMXBs with neutron star primaries. Russell et al. (2007) compiled much of the data on such objects available up to that time, and found that synchrotron emission appeared to dominate the near-IR light for objects with LX ≈ 1036 erg s-1, and in the optical for systems with LX ≈ 1037 erg s-1. Sell et al. (2010) estimate the jet power in Cir X-1 to be 3 × 1035 ⩽ Pjet ⩽ 2 × 1037 erg s-1 if the termination shocks have a cooling age of 1600 yr.
In the following, we assemble multi-wavelength data to investigate the spectrum of Cir X-1 in and out of outburst to examine the nature of its outburst emission. To allow us to put these observations in context, we have compiled similar data sets for other persistent LMXBs that have been reported to have synchrotron jets from radio observations, and have the necessary mid-IR data sets needed to explore both their variability and spectra energy distributions over a large range in wavelength. In Section 2 we present the data set and the reduction process, in Section 3 we discuss the data sets for each individual system, and in Section 4 we present our conclusions.
2. OBSERVATIONS
We observed Cir X-1 using Herschel during outburst and during quiescence. We used the ephemeris of Nicolson (2007) to set up observing windows for our program. Due to its location on the galactic equator (b = −0 1), Cir X-1 was serendipitously observed with Spitzer on several occasions as part of the "GLIMPSE" (PI: Churchwell) and "MIPSGAL" (PI: Carey) surveys. Cir X-1 was also detected by Wide-field Infrared Survey Explorer (WISE). Thus, we have been able to construct a considerable IR photometric data set for Cir X-1.
To compare to our results for Cir X-1, we have also sought mid-/far-IR observations of similar systems, including the Z-sources Sco X-1, Cyg X-2, GX 5-1, GX 13+1, GX 17+2, GX 340+0, and GX 349+2. In addition, we obtained and reduced observations of the black hole system, GRS 1915+105. Due to their locations near the Galactic Center, several of these sources were observed serendipitously with both Herschel and Spitzer (GX 13+1, GRS 1915+105, GX 340+0). In addition, GRS 1915+105, Sco X-1, Cyg X-2, GX 17+2, and GX 349+2 were specifically targeted for Spitzer observations. All of these sources were also observed by WISE. We discuss the reduction process for these data below.
2.1. Herschel Data
We observed Cir X-1 in both outburst and quiescence using the Photodetector Array Camera and Spectrometer (PACS; Poglitsch et al. 2010) and the Spectral and Photometric Imaging REceiver (SPIRE; Griffin et al. 2010) on the Herschel Space Observatory (Pilbratt et al. 2010). PACS obtains photometric observations in two bands simultaneously, one blue (60–85 μm, or 85–125 μm) and one red (125–210 μm), while SPIRE obtains data in three bands simultaneously: 250, 350, and 500 μm. For our observations of Cir X-1, we selected the bluest PACS bandpass (λeff = 70 μm), along with the default red bandpass (λeff = 160 μm).
The preferred observing mode with PACS is the "mini-scan map" mode,6 where repeated scans of the bolometer array across the field of view are acquired to reduce the dominant 1/f noise. Details can be found in the PACS Data Reduction Guide.7 For these observations the scans spanned 4.0 arcminutes, at two different orientations on the sky (at the recommended 70° and 100° position angles). Our observation request included nine "repetitions" to allow us to increase the depth of our observations. The 1σ flux density limits for the blue data were of the order of ±3.5 mJy, and for the red were ±50 mJy. The PACS outburst images are shown in Figure 1.
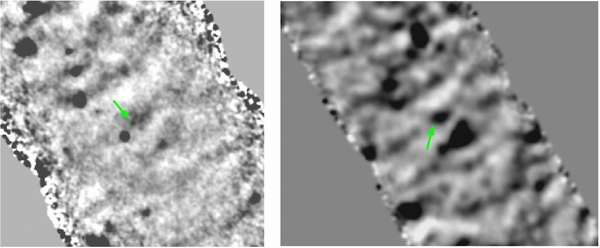
Figure 1. PACS 70 μm "blue" (left) and 160 μm "red" (right) images of Cir X-1 during outburst (north is up, east to the left). The position of Cir X-1 is indicated with a green arrow. As noted in the text, the source at the center of the red image is a cool background object that overwhelms the light from Cir X-1 (note that the bright star to the southeast of Cir X-1 in the blue image is no longer visible in the red image). The vertical extent of the blue image is 3 6, while for the red it is 41.
Download figure:
Standard image High-resolution imageThe PACS data were reduced using the Herschel Interactive Processing Environment (HIPE8). Reduction of mini-scan mode data is performed using a python-based data reduction template contained within HIPE. Since the PACS data reduction pipeline does not properly propagate errors (see Popesso et al. 2012), we have followed the recommended procedure for estimating the error bars on point source fluxes (or 1σ flux density limits) by performing aperture photometry on numerous source-free regions in the final processed images, and calculating the rms error for the resulting sets of flux densities. Due to the high background and the brightness of the sources in the red image, the high pass filtering scheme used to reduce the noise of the individual scans was problematic. If a small value of this parameter was chosen ("HPFRADIUS" ⩽ 7''), to attempt to achieve a smoother and quieter background (as was used to create the blue image), artificial objects are created in the image near bright sources. This is especially true at the position of Cir X-1. With small values of the high pass filtering radius, the very bright amorphous object just to the southwest of Cir X-1 led to an artificially brightened object at roughly the same approximate position as the object centered in Figure 1. Thus, we were forced to use HPFRADIUS = 12''; the result is an image with numerous ripples and defects that does not go as deep as originally desired. As we discuss below, the object centered in the red image is a cool (Teff = 15 K) background source that overwhelms Cir X-1 beyond 70 μm. This object is located approximately 5'' to the northwest of the nominal position of Cir X-1. A hint of this source is present in the blue PACS image. The final flux densities at 70 and 160 μm for both epochs are presented in Table 1.
Table 1. Herschel Observations of Cir X-1
| Start Date | 70 μm | 160 μm | 250 μm | 350 μm | 500 μm |
|---|---|---|---|---|---|
| (UT) | (mJy) | (mJy) | (mJy) | (mJy) | (mJy) |
| 2012 Sep 10 15:50:19 | 12.3 ± 3.5 | 218.0 ± 45.6 | 303.3 ± 21.1 | 389.5 ± 48.5 | 493 ± 102 |
| 2012 Oct 1 16:08:24 | 4.8 ± 3.4 | 162.3 ± 61.4 | 310.9 ± 17.5 | 364.6 ± 32.1 | 380 ± 89 |
Download table as: ASCIITypeset image
The SPIRE data was reduced using the SPIRE Photometric Interactive Analysis (SPIA) package.9 The final SPIRE 250 μm ("PSW") map of Cir X-1 in the high state is shown in Figure 2. The SPIRE images cover an unvignetted field of ∼8' ×10'. The source at the center of the image in Figure 2 is the same object centered in the red image of Figure 1. The two bright sources to the northeast and southwest of this source in the PSW image are the same sources seen in the red image (though the extended object to the northeast is much brighter in the SPIRE data). As discussed in the SPIRE Data Reduction Guide (SDRG10), to produce the most reliable point source photometry, the "timeline" extraction method is preferred (see Section 5.7.1.5 in the SDRG). We used the default settings for this algorithm, except for a custom sky annulus with an inner radius of 65'' and an outer radius of 75'' (the default sky annulus, 300''–350'', is too large for our images). While the far-IR environment of Cir X-1 is complicated, it is clear that the central source in these maps can be easily measured. In Figure 3 we present a single bolometer scan that crosses the position of Cir X-1 ("map pixel 0"). There is an obvious point source present in these scans. In every case, this object was offset from the nominal Cir X-1 position by ∼5''. The SDRG suggests that SPIRE astrometry is good to ±2''. The final SPIRE fluxes for this source at both epochs are presented in Table 1.

Figure 2. SPIRE 250 μm (PSW) image of the field of Cir X-1. At this wavelength, the source seen in the red PACS image, and confused with Cir X-1, is indicated. The bright, extended sources to the northeast and southwest of this central source are the same objects visible in the red PACS image (though they have swapped brightness).
Download figure:
Standard image High-resolution image
Figure 3. Signal trace of a single SPIRE bolometer that crosses the position of Cir X-1 ("Data sample index" = 0). In the small map mode, the scan speed of SPIRE is 30 arcsec s−1, and the bolometers have their voltages sampled at a frequency of 18.6 Hz. The central source is well-isolated from the bright, nearby objects in these scans, even though this region seems quite crowded in the images. This particular scan is one that runs from northeast to southwest. The scan direction (see Figure 2) perpendicular to this is not influenced by the two nearby bright sources. The "Timeline" photometric extraction routine fits a point source profile to the mean of all of the various bolometer scans that cross the object position to derive a flux density.
Download figure:
Standard image High-resolution imageIn addition to our observations of Cir X-1, we downloaded and reduced the Herschel PACS and SPIRE data for GRS 1915+105, GX 13+1, and GX 340+0. Due to the "fast" scan mode of these observations, the depth was quite shallow, and none of the sources were conclusively detected.
2.2. Spitzer and WISE Observations
To attempt to constrain the IR spectra of the program objects, we have downloaded and reduced the various Spitzer and WISE observations of these sources. Most of the Spitzer observations consist of Infrared Array Camera (IRAC; Fazio et al. 2004) 3.6–8 μm and MIPS (Rieke et al. 2004) 24 μm photometry. To achieve flux densities for the IRAC and MIPS 24 μm observations we have used MOPEX (Makovoz et al. 2006). Sco X-1, however, was the target of a pointed observation (PI: Casella) to investigate its variability. As was done for GX17+2 (see Harrison et al. 2011), to generate an IRAC 4.5 μm light curve, we used IRAF to perform aperture photometry and used the mean flux densities derived using MOPEX to flux calibrate the light curve of Sco X-1 to the IRAC magnitude system.11 An observing log of the Spitzer observations and the resulting flux densities for all of the program objects are listed in Table 2. Revnivtsev et al. (2012) previously reported Spitzer data for Cyg X-2 and Sco X-1, and Rahoui et al. (2010) presented the fluxes from the pointed IRAC observations for GRS 1915+105.
Table 2. Spitzer Observations of Program Objects
| Object | Observation Start Date | 3.6 μm | 4.5 μm | 5.8 μm | 8.0 μm | 24 μm |
|---|---|---|---|---|---|---|
| (UT) | (mJy) | (mJy) | (mJy) | (mJy) | (mJy) | |
| Cir X-1 | 2004 Mar 13 06:15:19 | 17.42 ± 0.11 | 15.47 ± 0.11 | 13.12 ± 0.26 | 10.44 ± 0.17 | ⋅⋅⋅ |
| Cir X-1 | 2004 Mar 31 07:37:38 | ⋅⋅⋅ | 10.63 ± 0.14 | ⋅⋅⋅ | 7.42 ± 0.25 | ⋅⋅⋅ |
| Cir X-1 | 2006 Apr 11 03:50:33 | ⋅⋅⋅ | ⋅⋅⋅ | ⋅⋅⋅ | ⋅⋅⋅ | 6.28 ± 0.15 |
| Cir X-1 | 2006 Apr 11 05:00:23 | ⋅⋅⋅ | ⋅⋅⋅ | ⋅⋅⋅ | ⋅⋅⋅ | 6.13 ± 0.15 |
| Cir X-1 | 2006 Apr 11 06:03:25 | ⋅⋅⋅ | ⋅⋅⋅ | ⋅⋅⋅ | ⋅⋅⋅ | 6.40 ± 0.14 |
| Cyg X-2 | 2008 Aug 22 04:02:37 | ⋅⋅⋅ | 1.37 ± 0.01 | ⋅⋅⋅ | 6.62 ± 0.01 | ⋅⋅⋅ |
| Cyg X-2 | 2008 Dec 29 00:24:46 | ⋅⋅⋅ | ⋅⋅⋅ | ⋅⋅⋅ | ⋅⋅⋅ | 0.52 ± 0.01 |
| GRS 1915+105 | 2005 Oct 4 18:51:43 | ⋅⋅⋅ | ⋅⋅⋅ | ⋅⋅⋅ | ⋅⋅⋅ | 27.41 ± 0.18 |
| GRS 1915+105 | 2005 Oct 4 20:01:25 | ⋅⋅⋅ | ⋅⋅⋅ | ⋅⋅⋅ | ⋅⋅⋅ | 40.45 ± 0.20 |
| GRS 1915+105 | 2004 Oct 6 04:13:44 | 5.44 ± 0.01 | 5.31 ± 0.01 | 4.71 ± 0.02 | 3.38 ± 0.01 | ⋅⋅⋅ |
| GRS 1915+105 | 2004 Oct 10 01:06:05 | 4.85 ± 0.02 | 4.84 ± 0.02 | 4.47 ± 0.02 | 3.01 ±0.01 | ⋅⋅⋅ |
| GRS 1915+105 | 2004 Oct 30 17:46:39 | 4.95 ± 0.01 | 4.80 ± 0.01 | 4.34 ± 0.02 | 2.97 ± 0.02 | ⋅⋅⋅ |
| GRS 1915+105 | 2005 May 6 06:52:41 | 8.51 ± 0.01 | 8.06 ± 0.01 | 7.33 ± 0.02 | 5.00 ± 0.02 | ⋅⋅⋅ |
| GRS 1915+105 | 2005 May 10 13:42:17 | 10.00 ± 0.01 | 9.74 ± 0.01 | 8.68 ± 0.02 | 6.05 ± 0.02 | ⋅⋅⋅ |
| GRS 1915+105 | 2005 Sep 23 13:43:06 | 6.02 ± 0.01 | 5.80 ± 0.01 | 5.23 ± 0.02 | 3.68 ± 0.02 | ⋅⋅⋅ |
| GRS 1915+105 | 2005 Nov 2 01:41:01 | 10.52 ± 0.01 | 10.19 ± 0.01 | 9.10 ± 0.02 | 6.45 ± 0.02 | ⋅⋅⋅ |
| GRS 1915+105 | 2006 May 2 14:05:47 | 4.75 ± 0.01 | 4.73 ± 0.01 | 4.23 ± 0.02 | 2.98 ± 0.01 | ⋅⋅⋅ |
| GRS 1915+105 | 2006 Jun 4 19:50:51 | 5.08 ± 0.01 | 4.92 ± 0.01 | 4.37 ± 0.02 | 3.03 ± 0.02 | ⋅⋅⋅ |
| GX13+1 | 2004 Oct 5 20:31:58 | 7.55 ± 0.08 | 6.30 ± 0.23 | 4.38 ± 0.025 | 2.23 ± 0.23 | ⋅⋅⋅ |
| GX349+2 | 2006 Sep 24 07:50:06 | 0.49 ± 0.08 | 0.32 ± 0.08 | 0.38 ± 0.14 | ⋅⋅⋅ | ⋅⋅⋅ |
| GX349+2 | 2008 Sep 17 04:19:57 | ⋅⋅⋅ | 0.818 ± 0.004 | ⋅⋅⋅ | 0.751 ± 0.02 | ⋅⋅⋅ |
| GX349+2 | 2008 Sep 26 01:10:33 | ⋅⋅⋅ | ⋅⋅⋅ | ⋅⋅⋅ | ⋅⋅⋅ | 2.48 ± 0.82 |
| Sco X-1 | 2005 Aug 22 15:52:06 | 9.97 ± 0.05 | 7.47 ± 0.05 | 5.27 ± 0.13 | 3.85 ± 0.07 | ⋅⋅⋅ |
| Sco X-1 | 2006 Apr 2 01:18:47 | ⋅⋅⋅ | ⋅⋅⋅ | ⋅⋅⋅ | ⋅⋅⋅ | 0.88 ± 0.02 |
Download table as: ASCIITypeset image
Two of the targets, Sco X-1 (PI: Bregman) and GRS 1915+105 (PI: Fuchs), were targeted for mid-IR spectroscopy using the Infrared Spectrograph (IRS; Houck et al. 2004) on Spitzer. The IRS data were reduced using the Spitzer IRS Custom Extraction (SPICE12) software. The observations of Sco X-1 did not produce a usable spectrum. GRS 1915+105 was also too faint at the longest wavelengths ("LL") to produce a useful spectrum at each individual pointing, but since it was observed on eight different epochs, we were able to combine all of these data together to extract a mean spectrum that spans the range from 14 to 33 μm. The shorter wavelength ("SL") IRS data for GRS 1915+105 were of sufficient quality to extract individual observational epochs.
The WISE mission (Wright et al. 2010) surveyed the entire sky in four wavelength bands: 3.4, 4.6, 12, and 22 μm. The two short bandpasses (hereafter referred to as W1 and W2) are quite similar to the two short IRAC bandpasses. The 12 μm channel ("W3"; λeff = 11.56 μm), is similar to that of the IRAS 12 μm bandpass, while the 22 μm ("W4"; λeff = 22.09 μm) bandpass closely resembles the Spitzer MIPS 24 μm channel (Jarrett et al. 2011). Due to the scanning nature of its orbit, every object was observed by WISE on at least 12 separate occasions. Thus, it is possible to generate light curves for the brighter program objects using the "single exposure" observations from the WISE mission. We have extracted these data from the IRSA website (http://irsa.ipac.caltech.edu/) with the caveat that transient effects (e.g., cosmic rays) make a small number of the single exposure measurements unusable. Such data are easily recognized, as their astrometry is highly deviant.
2.3. Ground-based Observations of the Program Objects
For most of the targets in our sample, we have used published optical and near-IR data, including Two Micron All Sky Survey (2MASS) observations (Skrutskie et al. 2006), to aid in constructing their spectral energy distributions (SEDs). We obtained V- and K-band photometry of Cir X-1 using ANDICAM (Bloom et al. 2004) on the SMARTS 1.3 m telescope (Subasavage et al. 2010) on 2012 September 11 and obtained JHK data using OSIRIS13 on SOAR on 2011 April 17 (NOAO Proposal 2011A-0328). The SMARTS observations were timed to be contemporaneous with the Herschel observations, and were obtained approximately 8 hr later (at 00:45 UT). For GX 5-1, we obtained JHK photometry using the Near-Infrared Camera & Fabry–Perot Spectrometer (NICFPS14) on the Apache Point Observatory (APO) 3.5 m telescope on 2005 May 20. We obtained VRI observations of Cyg X-2 using the NMSU 1 m telescope on 2005 June 3. To obtain fluxes from the near-IR data, aperture photometry was performed on the source and four nearby field stars using IRAF and the JHK magnitudes were calibrated using the 2MASS values for those field stars. To obtain fluxes from the optical measurements, we used magnitudes from the AAVSO Photometric All-Sky Survey15 for several field stars in our SMARTS and NMSU 1 m images to derive the photometry for Cir X-1 (V = 20.2 ± 0.20) and Cyg X-2 (V = 14.70 ± 0.02, (V − R) = 0.55 ± 0.03, (V − I) = 0.89 ± 0.03).
For GRS 1915+105, we obtained moderate resolution (R ∼ 25,000) K-band spectroscopy using NIRSPEC16 on Keck II. The observations occurred on 2007 August 27, and 300 s exposures were used. The 0 432 × 12'' slit was employed, and the source was nodded between two positions along the slit to allow for sky subtraction. While cross-dispersed, only about one-half of the K band can be covered with a single grating setting using NIRSPEC, and thus two separate sets of observations were obtained to provide coverage of most of the K band. Several A0V stars were observed to provide telluric correction for the range of airmasses covered by our observations of GRS 1915+105 for each grating setting. These data were reduced in IRAF using the standard techniques.
3. RESULTS
As noted above, Cir X-1 clearly has a synchrotron jet, and this appears to be true for the other LMXBs of our program. In the following, we construct SEDs for the various objects to investigate whether synchrotron emission is detectable, and how far into the near-IR such emission reaches. As in our modeling of the mid-IR SEDs of cataclysmic variables (CVs; Harrison et al. 2013b), we assume that the spectra of these sources are combinations of blackbody, free–free, and synchrotron spectra. When the accretion disks in CVs are hot and optically thick, their optical/near-IR SEDs closely resemble 10,000 K blackbodies (see Harrison et al. 2010). We will assume that the LMXBs in our survey have similar hot, optically thick accretion disks. For most of the sources, modeling of non-simultaneous data is necessary. Due to the variability of these sources, such modeling can only give us a general idea of the components that comprise their spectra, but does allow us to examine whether these sources show mid-IR excesses. Thus, no attempt has been made to derive statistically rigorous fits to the data, with all final choices made by visual inspection.
We first discuss our results for Cir X-1, and then proceed through the other sources in the order in which they appear in Table 2. We also discuss GX 5-1, even though we do not list it in Table 2. In the Spitzer and WISE data, GX 5-1 is confused with nearby field stars. We included GX 340+0 in our survey of LMXBs, but it was not detected in the 2MASS survey or by Spitzer, WISE, or Herschel. This is not too surprising given that the near-IR counterpart to GX 340+0 is very faint, with K = 17.3 (Miller et al. 1993), the faintest of the Galactic Z-sources.
3.1. Cir X-1
Before we address the results of our Herschel observations of Cir X-1, it is useful to examine the phasing of the outbursts over the past few decades. Nicolson (2007) provides an ephemeris for Cir X-1 derived from radio observations that spanned 28 yr. This ephemeris is for the "onset times" of the radio flares, and includes a term that accounts for the ever-shortening period between these events. There have also been ephemerides derived from X-ray observations. Parkinson et al. (2003) used X-ray data spanning 30 yr and found that the X-ray maxima can occur both before and after a radio flare. Clarkson et al. (2004) proposed that the X-ray dips seen near phase 0 were a better determinant for constructing an ephemeris. Propagation of either ephemeris forward to the epoch of the observed outburst shows that the Clarkson et al. prediction for outburst is 3.5 days later than that of Nicolson, while the older Parkinson et al. ephemeris is only 0.3 days late. In the following, we will cite the phase of all of our observations to that given by the Nicolson ephemeris. We have phased the near-IR light curve data from Glass (1994) to this ephemeris and present it in Figure 4. We find that there is a slight phase offset (Δϕ = +0.01) between the time of the peak of the outburst in the near-IR and the radio ephemeris. The outburst Herschel observations occurred at an ephemeris phase of ϕ = 0.99, while the low-state observations occurred at ϕ = 0.26. Unfortunately, the high-state observations were obtained somewhat earlier than were requested.

Figure 4. JHK light curves of Cir X-1 from Glass (1994), phased to the ephemeris of Nicolson (2007), but offset in phase by Δϕ = +0.01. The green crosses are the SOAR data, while the red cross in the K-band light curve is the SMARTS observation.
Download figure:
Standard image High-resolution imageAs shown by the contemporaneous SMARTS data and the SOAR observation (red and green crosses in Figure 4), the near-IR outbursts of Cir X-1 at the current epoch are completely consistent with the outbursts observed by Glass in the 1980s and early 1990s. In Figure 5, we present the RXTE All-Sky Monitor (ASM; 1.3–12.1 keV), the Swift Burst Alert Telescope (BAT)17 (15–50 keV) and MAXI18 (0.5–30 keV) light curves of Cir X-1, starting 2000 January 1. The final year of operation of the ASM in 2011 saw an increased level of activity. The Swift BAT and MAXI instruments cover higher energies than the ASM on RXTE, so the outburst peaks are not as dramatic, presumably due to the softer X-ray spectrum exhibited by Cir X-1 near maximum (see D'Aí et al. 2012 and references therein). These light curves clearly show that Cir X-1 appears to be returning to an active phase.

Figure 5. Light curves from RXTE/ASM (black), MAXI (green), and Swift/BAT (blue) of Cir X-1. These light curves represent the sum of counts in their respective bandpasses. The MAXI and Swift/BAT light curves have been arbitrarily normalized to approximate the RXTE/ASM light curve where they overlap by multiplying their count rates by factors of 24 and 380, respectively. The red arrow indicates the timing of the Herschel observations.
Download figure:
Standard image High-resolution imageTo construct the SED of Cir X-1, we used the JHKL data from Glass (1994), and V-, R-, and i-band data from Moneti (1992). Using the Nicolson ephemeris, the observations by Moneti that were closest to outburst were actually obtained at ϕ = 0.15. The SMARTS V-band (V = 20.2) measurement was obtained simultaneous to the K-band measurement, and we believe represents the first V-band magnitude for Cir X-1 exactly at the peak of an outburst. There are two epochs of IRAC data for Cir X-1; the 2004 March 13 observations occurred at ϕ = 0.15, while the 2004 March 31 observations occurred at ϕ = 0.24. The MIPS observations occurred very close to outburst: ϕ = 0.07. WISE observed this source twice, on MJD55249.84 (ϕ = 0.63) and MJD55431.38 (ϕ = 0.62). On neither occasion did Cir X-1 display significant variability (Δm ⩽ 0.25 mag). For the first epoch the mean WISE magnitudes were W1 = 10.89, W2 = 10.48, and W3 = 9.31. On the second epoch these were W1 = 10.86 and W2 = 10.59 (it was not detected in the W3 bandpass due to the higher temperatures of the telescope and focal plane during this second epoch).
In Figure 6, we plot the SED for Cir X-1 assuming that data obtained between 0.75 ⩽ϕ ⩽ 0.25 are "quiescent" and, as suggested by the near-IR light curve, are equivalent. The Moneti (1992) visual data and the first epoch IRAC observations were obtained at identical phases, and the JHK light curves would suggest that Cir X-1 is about halfway between quiescence and outburst at this phase. We consider the MIPS data to be essentially at outburst. As shown in Armstrong et al. (2013), the history of the radio outbursts is complex. Recent data suggest that the outbursts have returned to the point where they can exceed 1 Jy at 8.5 GHz during their peak.

Figure 6. (a) SED of Cir X-1. Quiescent-state data are plotted as filled circles (the 70 μm upper limit as a filled triangle). Outburst fluxes are plotted as stars, while intermediate-state fluxes are plotted as open circles. The fluxes indicated with "×" were obtained by subtracting the low-state fluxes from the high-state fluxes at those wavelengths. Estimated upper limits on the 8.5 and 4.8 GHz fluxes at the time of the onset of the radio rise are indicated as filled triangles. These fluxes were derived by least squares fitting to the data in Figure 3 of Armstrong et al. (2013). The low-state SED has been fitted (red) with a Teff = 10,000 K blackbody (dotted line) plus a free–free spectrum, reddened by AV = 8.5 mag. The SPIRE data at 250, 350, and 500 μm have been fitted with a blackbody with Teff = 15 K (dashed line). The high-state SED has also been fitted with a 10,000 K blackbody + free–free spectrum (blue), but in this case the free–free component has changed very little in total luminosity from that used in the low-state model, while the blackbody component has dramatically brightened. In this figure, and those that follow, error bars on the photometry are delineated when they exceed the size of the plotted symbols. (b) Fit (green solid line) to the high-state SED that includes the blackbody and free–free spectrum from (a) (blue dotted line), plus a synchrotron spectrum (red, short-dashed line). The synchrotron spectrum, generated using the program at http://www.jca.umbc.edu/~markos/cs/comptontoys/comptontoys.html, has an electron index of p = −1.7, and magnetic field strength of B = 0.015 G.
Download figure:
Standard image High-resolution imageThe quiescent SED from V through K can be modeled as a highly reddened hot blackbody. Harrison et al. (2011) demonstrated that the mean, approximate dereddened near-IR colors of Z-sources are 〈(J − H)〉 = 0.17 and 〈(H − K)〉 = 0.03. The mean quiescent (0.4 ⩽ ϕ ⩽ 0.80) JHK colors of Cir X-1 are 〈(J − H)〉 = 1.14 and 〈(H − K)〉 = 0.58, suggesting AV = 8.9. Averaging the JHK data from Glass (1994) for observations where ϕ = 0.0 ± 0.1 leads to 〈(J − H)〉 = 1.05 and 〈(H − K)〉 = 0.56. As noted by Glass, there is very little color change between minimum and maximum light.
In Figure 6(a), we plot the quiescent data as solid circles and the outburst data as stars. Intermediate-state data are plotted as open circles. As shown by the blackbody plotted in Figure 6(a) (dotted line), Cir X-1 has a mid-IR excess. We can easily fit the low-state data with the sum of blackbody (Teff = 10,000 K) and free–free spectra (solid red line), assuming AV = 8.5 mag. While the high-state data suggest that they could be fitted with a simple offset of this low-state spectrum, keeping the same ratio of blackbody to free–free luminosity produces too large of a mid-IR excess (as well as too much visual flux). Thus, while simply boosting the luminosity of the blackbody component fits the V through K fluxes (blue solid line), the free–free component required to be compatible with the high-state spectrum can only change by a small amount from its quiescent luminosity (essentially the difference seen at 400 μm, a wavelength at which the model free–free component is dominant). Given that the blue PACS flux was obtained at a phase where the K-band light curve is only halfway to maximum, the expected blackbody + free–free spectrum at this time is more than two sigma from the Herschel observations.
Up to this point, we have ignored the PACS 160 μm and SPIRE fluxes. As noted above, there is a cold background source that dominates Cir X-1 at these wavelengths. We have fit this source with a 15 K blackbody (dashed line in Figure 6). As demonstrated in Table 1, there are essentially no statistical differences in the PACS 160 μm and SPIRE fluxes between the low and high states. If we do, however, take the observed differences between the high-state 160 and 500 μm fluxes, we arrive at the crosses plotted in Figure 6. Since it has been demonstrated that synchrotron emission is present in this system and is responsible for the radio outbursts, we explore whether the addition of a synchrotron spectrum could explain the observations. In Figure 6(b), we sum the maximum light blackbody + free–free spectrum in Figure 6(a), and add a synchrotron component (red). The benefit of this model, compared to that of Figure 6(a), is that it allows for higher mid-IR fluxes in the high state, while being consistent with the PACS, SPIRE, and projected radio limits at phase 0.
While we certainly can explain the 70 μm flux as due to synchrotron emission, why such emission would be present well before the accretion event has reached its maximum is not obvious. While the PACS and SPIRE fluxes were obtained at ϕ = 0.99, they were actually obtained 5.6 hr before the predicted phase for the onset of the radio flare, and 8 hr before the K-band data were at maximum. The near-IR maxima occur very close to the predicted time of the onset of the radio flares, indicating they are correlated. Armstrong et al. (2013) suggest that the radio outburst of Cir X-1 is consistent with an expanding cloud of synchrotron emitting gas, as in the scenario discussed by van der Laan (1966). van der Laan gives a relation between the maximum flux at two frequencies and the spectral index of the injected relativistic electrons (p), as well as a relation (his Equation (15)) to estimate the time of the initial outburst ("t0"). Using the times of the observed maxima and the flux densities at 8.5 and 1.9 GHz for "Flare II" in Armstrong et al. (2013, see their Figures 3 and 4) we find p = −0.21, and that the flare was initiated at t0 = MJD55933.05. Clearly, however, the flare is already in progress at this time (S8.5 GHz = 0.42 Jy), so their extrapolation to estimate the time of the 1.9 GHz maximum must be incorrect, or a single ejection event cannot be assumed.
Given maxima at 8.5 GHz of ∼1 Jy, the expanding cloud model predicts a flux density at 70 μm of ∼5 Jy if the synchrotron emission was optically thick in this bandpass sometime during the outburst. This would lead to a synchrotron luminosity larger than that of the entire source at outburst maximum, and thus the 70 μm bandpass is blueward of the optically thick part of the synchrotron spectrum (for example, that plotted in Figure 6(b)) at all times. The origin of the PACS detection of Cir X-1 remains unclear.
3.2. Cygnus X-2
Of the Z-sources, Cyg X-2 has the most explicit "Z" of this subclass of LMXBs (Hasinger & van der Klis 1989). Cyg X-2 also has the most prominent secondary star of any of the Z-sources. Optical spectroscopy shows that this star has an early spectral type (A5 to F2, Cowley et al. 1979; A9III, Casares et al. 1998). These detections allowed for the determination of an orbital period for the system: Porb = 9.8444 days (Casares et al. 1998). Orosz & Kuulkers (1999) collected the optical photometry of this source and modeled the resulting B and V light curves to estimate an inclination angle of i = 615. They then derived masses for the components of MNS = 1.78 ± 0.23 M☉ and M2 ≈ 0.73 M☉. They also estimate that the accretion disk in the system provides 32% of the B-band light. Such a wealth of detail for an LMXB is rare.
Cyg X-2 is a rather weak radio source that was first detected by Hjellming & Blankenship (1973). Hjellming et al. (1990) summarize the early radio history of this object, showing that most of the time it was not detected, though on occasion, it had outbursts that reached to 6 mJy at 8 GHz, and 12 mJy at 2.7 GHz. Recently, Spencer et al. (2013) presented very long baseline interferometry (VLBI) 6 cm observations that suggest the presence of a relativistic jet in Cyg X-2. They found that the source appeared to be on the horizontal branch at the time the jet was observed, consistent with the framework elucidated by Migliari & Fender (2006). During the VLBI observations, Cyg X-2 had a 5 GHz flux of ∼0.6 mJy.
To construct the SED of Cyg X-2, we used the mean of the UBV photometry listed in Orosz & Kuulkers (1999), and VRI photometry obtained with the NMSU 1 m telescope. We combined this with the 2MASS JHK, WISE, and Spitzer observations to produce the spectrum shown in Figure 7. Our optical to near-IR data is in agreement with that compiled by Revnivtsev et al. (2012), but their IRAC 8.0 μm (0.8 mJy) and 24 μm (8.5 mJy) fluxes are very different from what we obtained. McClintock et al. (1984) found a color excess of E(B − V) = 0.40, or AV = 1.23 mag. As noted above, the secondary star is a prominent component of the optical luminosity of the system. We attempted using models with a variety of temperatures spanning the spectral type range A0 to F2 with AV = 1.23 mag, but none of these matched the shape of the SED. We obtained much better fits by assuming lower values of extinction. It is obvious that if the secondary star dominates the optical luminosity and if it has a spectral type near A9, this object itself will impart a color excess of E(B − V) ≈ 0.25. Thus, the actual excess due to extinction is almost certainly smaller than the value listed by McClintock et al. We found that the best-fitting model for the observed SED of Cyg X-2 is the sum of a blackbody (Teff = 7000 K) spectrum, and either free–free or synchrotron spectra with AV = 0.46. We note that the U, B, and R fluxes are slightly higher than this model, but these can be explained as being due to variability or the presence of strong emission lines in these bandpasses, as is often seen in CVs.
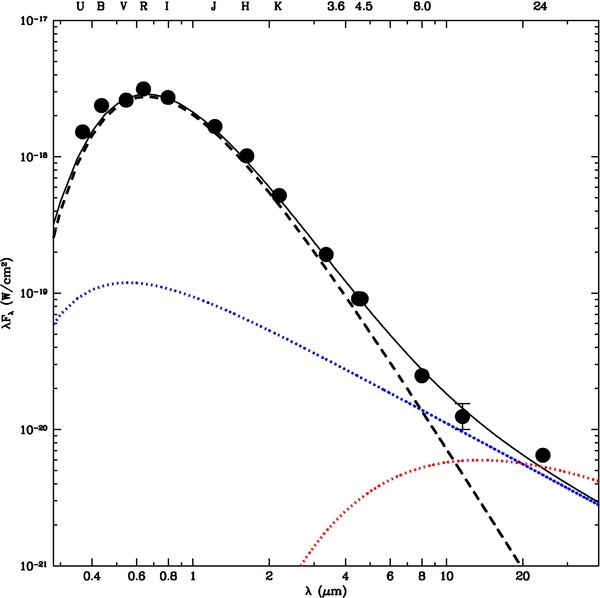
Figure 7. Fit (solid line) to the photometry of Cyg X-2 that includes a blackbody (Teff = 7000 K, dashed line) and free–free spectrum (blue dotted line) reddened by AV = 0.46 mag. A nearly identical fit can be achieved by summing the same blackbody with a synchrotron spectrum (red dotted line).
Download figure:
Standard image High-resolution imageIt is obvious from Figure 7 that Cyg X-2 has a considerable mid-IR excess. At the time of the WISE observations, the MAXI database shows that Cyg X-2 was on the horizontal branch and could therefore possess a synchrotron jet. The RXTE ASM light curves indicate this is also true for the Spitzer MIPS observation. For the epoch of the IRAC observations, however, the RXTE ASM database shows that Cyg X-2 was on the normal branch. The mid-IR excess does not seem to be very sensitive to the X-ray state. The light curves generated from the WISE observations (see Figure 8) do not show the rapid, large-scale variability one might expect for a synchrotron source (see GRS 1915+105 below, or the Spitzer light curves of GX 17+2 in Harrison et al. 2011). The parameters of the synchrotron model (B = 0.25 G, p = −0.5) presented in Figure 7 were adjusted to fit the 5 GHz observation (0.6 mJy) from Spencer et al. (2013). It is interesting to note, however, that the simple extension of the free–free spectrum comes very close to matching the 5 GHz flux density. Thus, either spectral source, when combined with a 7000 K blackbody, can explain the observations. Whatever its true nature, it is clear that this additional spectral component is much stronger relative to the dominant blackbody in Cyg X-2 than that in Cir X-1.
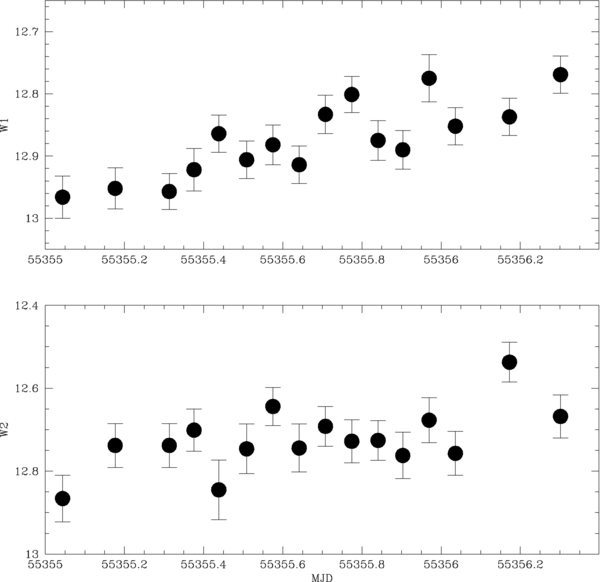
Figure 8. WISE single exposure light curves for Cyg X-2.
Download figure:
Standard image High-resolution image3.3. GRS 1915+105
GRS 1915+105 is an LMXB with a black hole primary that has been the subject of frequent investigations (see Fender & Belloni 2004 for a review). The X-ray light curves are complex, and show a variety of behavior on different timescales. Similarly, the source is highly variable at IR wavelengths (Fender & Pooley 1998), showing large-scale flaring events that appear to have counterparts in the radio. Pooley & Fender (1997) find that the radio varies in concert with the X-ray. These flares have been associated with synchrotron emission. Fender et al. (1998) used MERLIN to detect superluminal outflows in the jet of GRS 1915+105.
The original radial velocity study of Greiner et al. (2001) found the mass of the black hole in GRS 1915+105 to be the largest of stellar-mass systems: MBH = 14 M☉. Recently, Steeghs et al. (2013) completed a year-long IR spectroscopic study of GRS 1915+105 and found that the mass of the black hole is somewhat lower: MBH = 10.1 ± 0.6 M☉. The late-type (K5III) secondary star can clearly be seen in the spectra presented by Steeghs et al., but the continuum of GRS 1915+105 is highly variable, and it can become quite difficult to see the secondary star. In Figure 9, we present a spectrum of GRS 1915+105 obtained with NIRSPEC on Keck II. The CO features are nearly completely washed out due to H i Pfund emission (series limit 2.28 μm), as was also found by Harlaftis et al. (2001). The higher resolution of the NIRSPEC spectrum allows for the detection of the main CO features even when heavily obscured by continuum emission. Close examination of the NIRSPEC spectrum, and that published by Steeghs et al., suggests that 13CO is quite strong in the secondary star of GRS 1915+105. The broadening of the strongest H i emission lines gives a velocity of vFWHM = 456 km s-1. At the time of this observation, GRS 1915+105 had K ≈ 13.9.

Figure 9. NIRSPEC spectrum of the CO region of GRS 1915+105 compared to that of μ Aql (K3III). We have identified the bandhead locations for the 12CO and 13CO features, as well as identified several H i Pfund series emission lines.
Download figure:
Standard image High-resolution imageAs in the near-IR, GRS 1915+105 is highly variable in the mid-IR. In Figure 10, we plot the Spitzer data ordered by epoch as listed in Table 2 along with the RXTE ASM total count rate (as close in time to the IRAC observation as possible). GRS 1915+105 varies by more than a factor of two in all of the Spitzer bandpasses, with the greatest variability at 4.5 μm. Even with only two epochs of data, it is clear that strong variability is present in the 24 μm bandpass. The WISE + MAXI light curves are presented in Figure 11, and show a similar level of variability, including at the intermediate wavelength of 11.6 μm (W3). Given the shallower depth of the survey-mode Herschel observations, GRS 1915+105 was not detected in the PACS data, though there is a ridge of cold dust emission that corresponds to the location of GRS 1915+105 in the red (160 μm) PACS image (Figure 12).
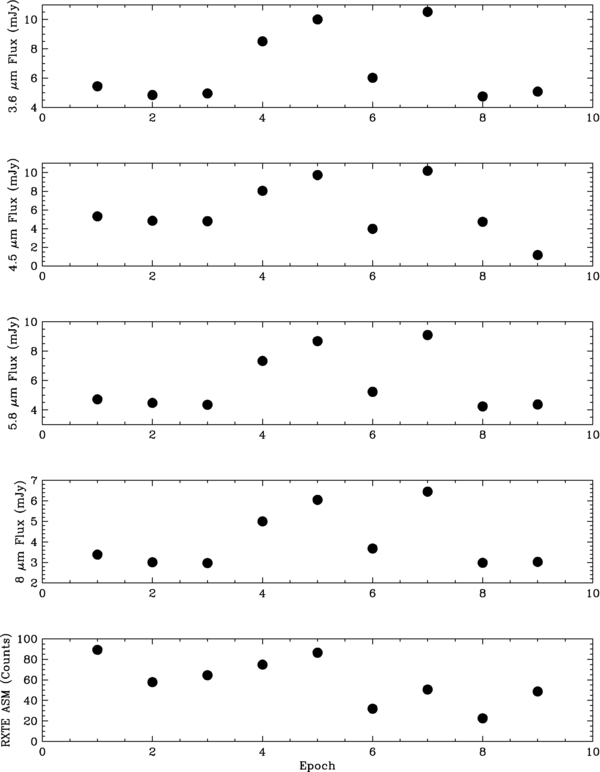
Figure 10. Spitzer data for GRS 1915+105. The epoch of observation, as listed in Table 2, is plotted on the abscissa instead of the date due to the 606 day span of the IRAC data set. The RXTE/ASM light curve is plotted in the bottom panel.
Download figure:
Standard image High-resolution image
Figure 11. WISE light curve data for GRS 1915+105. The MAXI light curve is plotted in the bottom panel.
Download figure:
Standard image High-resolution image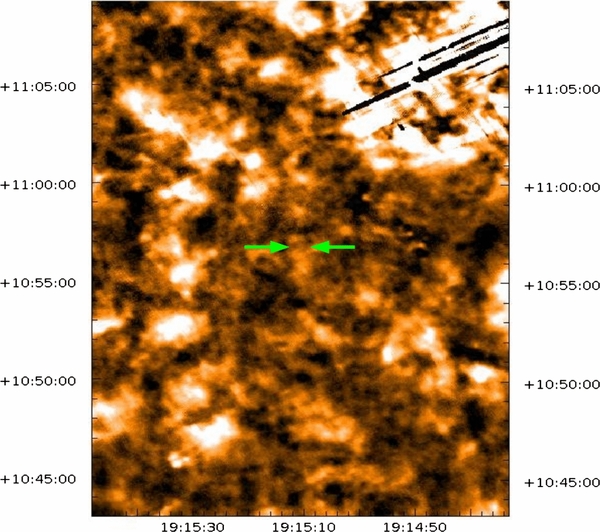
Figure 12. Herschel PACS red (160 μm) image of the field of GRS 1915+105. Its nominal position is located between the green arrows.
Download figure:
Standard image High-resolution imageThe Spitzer IRS spectrum of GRS 1915+105, shown in Figure 13, is quite surprising: it closely resembles the mid-IR spectra of AGN (c.f., Goulding et al. 2012). As first demonstrated by Rahoui et al. (2010), the shorter wavelength portion of the IRS spectrum (SL) is dominated by polycyclic aromatic hydrocarbon ("PAH") emission features, and a very strong 9.7 μm silicate absorption feature. The strong silicate absorption belies the very high line-of-sight extinction that has been estimated for GRS 1915+105. Fuchs et al. (2003) obtained mid-IR filter photometry observations of GRS 1915+105 using Infrared Space Observatory that covered much of the wavelength range of the IRS spectrum, and the SED that results from those data are in agreement with the IRS spectrum. Rahoui et al. attempted to examine how the strength of the PAH features seen in the SL spectra varied with X-ray flux, and believed there was a correlation that led them to propose that the PAH emission came from a circumbinary disk. Our re-reduction of the SL spectra, shown in Figure 14, demonstrates that no significant changes occurred in these spectra over the observed time span. While the PAH feature at 7.7 μm appears to be quite variable, this region is at the end of the spectral orders and is particularly noisy, thus its changing strength is suspect. Overall, these data have fairly low signal-to-noise ratio (S/N), with typical error bars on the individual spectral data points of ±20%. To demonstrate the lack of a correlation with X-ray flux, in Table 3 we present the 12 μm continuum flux versus the RXTE ASM count rate. While there is some evidence for variability at 12 μm, it is clearly not correlated with the X-ray flux. It is unclear if the PAH emission features are intrinsic to GRS 1915+105, are from nearby dust clouds, or are contamination from line-of-sight emission. We cannot rule out the suggestion of a circumbinary disk, but the stability of the spectral shape suggests the PAH emission region is located far enough away that irradiation plays little role in the strength of these emission features. Mirabel et al. (1996) discussed a scenario where a nearby (a few light days) dust cloud was illuminated by a large flare from GRS 1915+105. A future multiwavelength variability study will be necessary to determine the origin of the PAH emission features in this source.
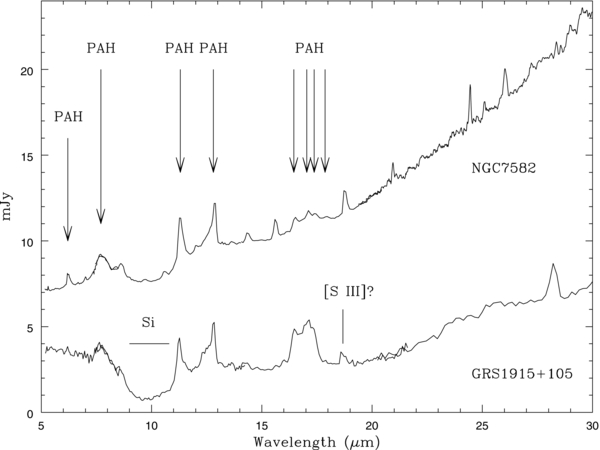
Figure 13. Spitzer IRS spectrum of GRS 1915+105 compared to that of the Seyfert 2 galaxy NGC 7582. We identify the locations of the most prominent PAH emission features as well as the broad silicate absorption feature. The weak emission feature at 18.7 μm could be due to [S iii], while the strong emission feature at 28.3 μm is unidentified and could be an artifact.
Download figure:
Standard image High-resolution image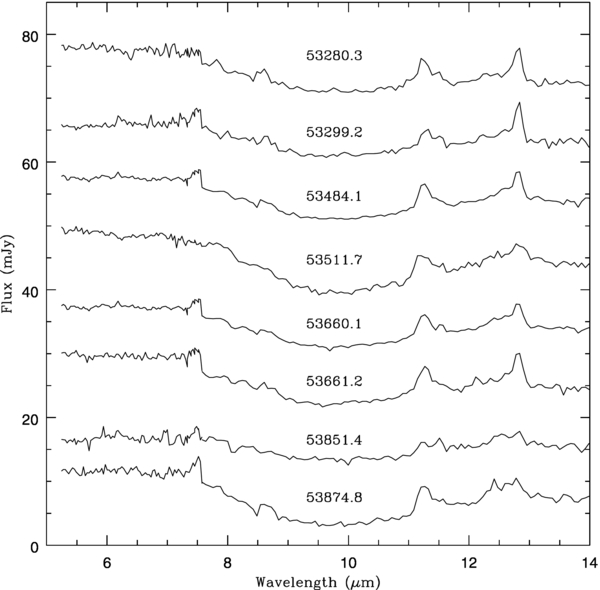
Figure 14. Epoch-dependent short wavelength (SL) Spitzer IRS spectra of GRS 1915+105. Except (possibly) for MJD53511.7, there are no statistically significant changes in these spectra, even though the source exhibited large changes in X-ray flux throughout (see Table 3).
Download figure:
Standard image High-resolution imageTable 3. Spitzer IRS Observations of GRS 1915+105
| Start Date | 12 μm | RXTE ASM |
|---|---|---|
| (MJD) | (mJy) | (Counts) |
| 53280.3 | 2.7 ± 0.7 | 60 |
| 53299.2 | 3.3 ± 0.7 | 90 |
| 53484.1 | 3.7 ± 0.7 | 177 |
| 53511.7 | 4.1 ± 0.9 | 135 |
| 53660.1 | 3.7 ± 0.7 | 68 |
| 53661.2 | 4.1 ± 0.6 | 83 |
| 53851.4 | 2.8 ± 0.7 | 25 |
| 53874.8 | 4.6 ± 0.7 | 35 |
Download table as: ASCIITypeset image
The rapidly rising continuum of the IRS spectrum of GRS 1915+105 at longer wavelengths suggests a synchrotron origin, as does the rapid variability at shorter wavelengths. Due to the highly variable nature of GRS 1915+105, modeling its SED might seem foolhardy, but we believe it provides useful insight. In Figure 15, we plot the average of the observed photometry of GRS 1915+105 as stars, as well as the observed ranges of its variability. The SED of GRS 1915+105 is superficially quite similar to Cir X-1, except that here we know the temperature and approximate contribution to the SED of the secondary star, as Steeghs et al. suggest that the K5III secondary star provides about 25% of the flux in the CO region of the K band. We attempted models similar to those for Cir X-1: two blackbody, and blackbody + free–free. In each case, one of the blackbodies was defined to have Teff = 3900 K to represent the K5III secondary. The two blackbody model, with Tbb1 = 10,000 K and Tbb2 = 3900 K, fits the shorter wavelength data, but fails beyond 3.6 μm. This model, plotted as the solid line in Figure 15, has the cool secondary star providing 30% of the flux at K, with AV = 19.5 mag (using Cardelli et al. 1989). In none of our models was AV ⩾ 20 mag. While there is significant evidence for different extinction relationships on different sightlines, the more extreme values of AV quoted for this source (e.g., Chaty et al. 1996) appear to be ruled out. Our result confirms the conclusion by Fuchs et al. (2003), which was subsequently reinforced by Chapuis & Corbel (2004), that the extinction to this source is lower than originally estimated. It is interesting to note that when GRS 1915+105 is at its faintest in the K band, the two blackbody model suggests that the secondary provides ∼80% of the K-band flux.
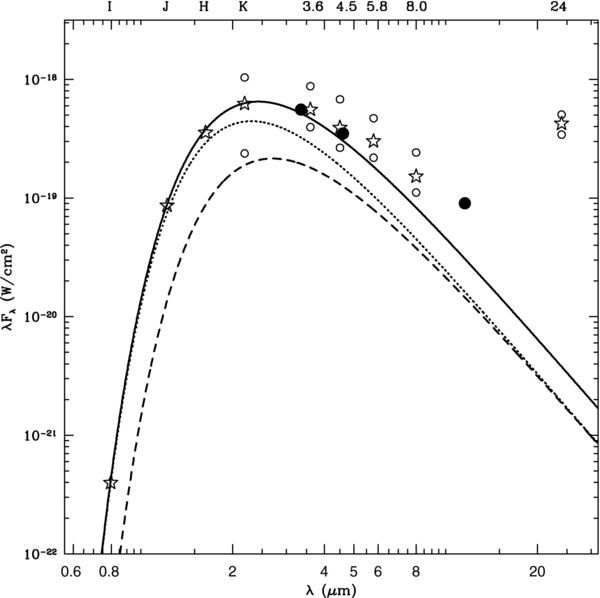
Figure 15. SED of GRS 1915+105. The "stars" are the mean of the photometry for this source, while the small open circles represent the observed range of variability at those wavelengths. The filled circles are the mean of the WISE light curve data. The solid line is the sum of two blackbody spectra reddened by AV = 19.5 mag. The blackbodies summed for this model have Tbb1 = 10,000 K (dotted line) and Tbb2 = 3900 K (dashed line).
Download figure:
Standard image High-resolution imageThe best-fitting model for the spectrum of GRS 1915+105 appears to require at least four components. The two blackbody model falls below the mean photometry past 3.6 μm, requiring an additional component. We experimented by adding a synchrotron spectrum to the two blackbody model. While matching the longest wavelength data points, this model fails to explain the mid-IR excess. Making further progress on characterizing the shape of the spectrum of GRS 1915+105 will require simultaneous observations over a wide wavelength range.
3.4. GX 13+1
GX 13+1 is an LMXB that shares some X-ray properties with Z-sources, and some of the characteristics of their lower luminosity brethren, the Atoll sources. Homan et al. (2004) present simultaneous X-ray and radio observations of this source, and believe that it has more in common with Z-sources than Atoll sources. Naylor et al. (1991) found a bright IR source at the radio position of Grindlay & Seaquist (1986). Bandyopadhyay et al. (1999) present a K-band spectrum of this object, and it shows strong CO absorption features, leading to a classification of K5III. Bandyopadhyay et al. (1999) find that 13CO appears to be strongly enhanced in this object. They derived that this secondary star supplied about 45% of the K-band flux at the time of their observation. Bandyopadhyay et al. (2002) present a K-band light curve of GX 13+1, and find that it varies between 12.6 ⩽ K ⩽ 11.9. Charles & Naylor (1992) observed a similar level of variability, with 12.4 ⩽ K ⩽ 11.8, but with a single bright measurement at K ≈ 11.7. Both X-ray and IR observations suggest an orbital period near 24 days (see Corbet et al. 2010). The extinction remains loosely constrained; Charles & Naylor found that X-ray models for the source suggest 13 ⩽ AV ⩽ 17.6.
We plot the SED in Figure 16, where the solid circles are from the 2MASS catalog, and the open circles are the fainter-state data from Charles & Naylor (as is the R-band upper limit). The Spitzer and WISE fluxes are similar, though GX 13+1 was slightly brighter when it was observed by WISE. The existing data set is consistent with a fainter state (Charles & Naylor plus Spitzer), and a brighter state (2MASS plus WISE). Both can be fit by a two blackbody model where the hot component has Teff = 10,000 K, and the cooler component has Teff = 3900 K (the K5III). In order to be consistent with the R-band upper limit, the model requires AV = 16.5. In the higher state, the secondary only supplies 20% of the K-band flux, increasing to 30% in the (observed) lower state. A solar metallicity K5III has MK = −4.46 (Karaali et al. 2013), and with K = 12.6, leads to a distance estimate of 18.45 kpc. A super-solar metallicity K5III ([Fe/H] = +0.37) has MK = −3.48, giving a distance of 11.7 kpc. Both of these distances are much larger than the 7 kpc estimated from X-ray observations (see Homan et al. 2004). To be consistent with this distance requires MK = −2.4, and would imply a solar metallicity K2/3III secondary star, which we believe remains consistent with the published K-band spectrum. Unlike the other systems discussed above, there is no evidence for a free–free or synchrotron component, and the observed brightness variations appear to be dominated by changes in the accretion disk luminosity.

Figure 16. SED of GX 13+1. The filled circles are the 2MASS data, and the large open circles and the R-band upper limit are from Charles & Naylor (1992). The small open circles and line at the K band show the observed variability range for this object. The WISE data are plotted as stars, while the Spitzer data are open squares (the MIPS 24 μm upper limit is indicated). A model for the brighter state is plotted as a solid line and is comprised of the sum of two blackbodies with Tbb1 = 10,000 K (dotted line) and Tbb2 = 3900 K (dashed line), reddened by AV = 16.5 mag.
Download figure:
Standard image High-resolution image3.5. GX 349+2 (Sco X-2)
GX 349+2 is an X-ray bright Z-source that does not have as extensive of an observational history as the other objects discussed so far. O'Neill et al. (2002 and references therein) discuss the X-ray variability, and find that it behaves most like Cyg X-2. Despite its low extinction, AV < 5, very few ground-based studies have been attempted. A spectrum obtained by Penninx & Augusteijn (1991) confirmed that the optical counterpart to GX 349+2 identified by Cooke & Ponman (1991) was correct. Bandyopadhyay et al. (1999) present a low S/N IR spectrum of GX 349+2 revealing H i and He i emission, but no secondary star features.
As shown in Table 2, GX 349+2 was observed with IRAC on Spitzer at two different epochs, and with MIPS on a third. In Figure 17, we plot the visual data from Cooke & Ponman (1991), Penninx & Augusteijn (1991), and Russell et al. (2007), along with the 2MASS data and the Spitzer observations. In the WISE images, GX 349+2 is lost in the glare of a bright stellar source located 10'' to its north. As is obvious from Figure 17, GX 349+2 exhibited large changes between the two epochs of IRAC data. Note that we had to manually extract the mid-IR photometry using IRAF for the first epoch data, due to the faintness of the source at this epoch and the shallower nature of the GLIMPSE survey data. This also turned out to be true for the MIPS data. Given this limited and somewhat incongruent data set, it is difficult to draw too many conclusions about GX 349+2. We have fit its SED with a reddened (AV = 3), hot (Teff = 10,000 K) blackbody. Clearly, however, there is evidence for both a mid-IR excess and strong variability at both optical and IR wavelengths. GX 349+2 certainly warrants further investigation.

Figure 17. SED of GX 349+2, with visual data from Cooke & Ponman (1991, open circles), Penninx & Augusteijn (1991, filled circles), and Russell et al. (2007, stars with observed variability ranges denoted); JHK from 2MASS; and the Spitzer data listed in Table 2 (first epoch = solid circles, second epoch = open circles). These data have been fitted with a Teff = 10,000 K blackbody reddened by AV = 3.
Download figure:
Standard image High-resolution imageIt is perhaps unexpected that an object located 5 kpc distant (see Homan et al. 2004 and references therein) toward the galactic center (l = 349.1, b = +2.7) could suffer such a low extinction. Figure 18 is a plot of the IR colors of all objects listed in the 2MASS catalog within a radius of 240'' and with K ⩽ 14.5. This diagram shows that this line of sight suffers from a relatively low extinction: all of the red giants in this region are consistent with AV⩽ 5. Nearly all such objects should be more luminous than GX 349+2 (MK = 0.7), and therefore many of them will be much further away, confirming the relatively low line-of-sight extinction at this position.

Figure 18. Infrared color–color plot of all 2MASS objects with K ⩽ 14.5 located within 240'' of GX 349+2. The locus of dwarf star colors is delineated in blue, while the red giant sequence is plotted in red. The reddening vector for AV = 3 mag is indicated. The location of GX 349+2 is plotted with a green cross.
Download figure:
Standard image High-resolution image3.6. Sco X-1
Sco X-1 needs little introduction. Details of its UV, optical, and X-ray variability can be found in Willis et al. (1980), McNamara et al. (2005, 2003), and Hasinger & van der Klis (1989), respectively. By compiling the light curve data on photographic survey plates obtained over an 84 yr period, Gottlieb et al. (1975) were able to derive an orbital period of 18.9 hr for Sco X-1. Using optical spectroscopy, Steeghs & Casares (2002) were able to extract a radial velocity curve for the irradiated secondary star. They found that the most likely fit to their data, assuming an orbital inclination of i = 38° (Fomalont et al. 2001), is M1 = 1.4 M☉ and M2 = 0.4 M☉. With this orbital period, the secondary star must be a subgiant to fill its Roche lobe and, with such a low mass, would suggest that it has a very late spectral type. Bandyopadhyay et al. (1999) failed to detect CO features in their K-band spectra of Sco X-1, but as shown by Harrison et al. (2004, 2005, 2007), the secondary stars in interacting binaries often appear to have carbon deficits, leading to anomalously weak CO features.
Surprisingly, there have been few studies of Sco X-1 in the near- and mid-IR. Neugebauer et al. (1969) found that Sco X-1 varied by 0.5 mag in both H and K. Besides the 2MASS data, Willis et al. (1980) provide the only other published JHK photometry that we could find. The 2MASS photometry for Sco X-1 appears to be somewhat brighter (ΔK = 0.3 mag) than the brightest data point of Neugebauer et al., and ΔK = 0.8 mag brighter than that reported by Willis et al. It is likely that some of this is due to zero point differences between the various photometric systems, with the rest due to intrinsic variability.
A high sample rate light curve of Sco X-1 was obtained with Spitzer in the 4.5 μm bandpass (PI: Casella). We present this light curve in Figure 19. Sco X-1 showed a slow brightening over the 2.6 hr of observation. There appear to have been three minor flares, with much smaller amplitudes and shorter durations than those seen at this wavelength for GX 17+2 (Harrison et al. 2011). The WISE light curves for Sco X-1 are shown in Figure 20. Note that there were two epochs of WISE observations; the second one was during the "3-Band Cryo" survey that had lower sensitivity at long wavelengths due to the higher focal plane temperatures. The amplitude of the variations in each of the WISE bandpasses was quite limited, about 0.3 mag. It is worth noting that both of the first epoch W1 and W2 light curves are consistent with a sine wave with a period of 18.9 hr, though the maximum of the best-fit sine wave falls at a phase of ϕ = 0.33. If these variations were due to ellipsoidal variations, the maximum should occur at ϕ = 0.25; if they were due to irradiation (see Harrison et al. 2013a), the maximum would occur at ϕ = 0.5. In an irradiation scenario, the deepest minimum occurs at ϕ = 0, which happens to correspond to the faintest datum in the W2 light curve, and near the minimum for both epochs of the W1 and W2 light curves.

Figure 19. Spitzer IRAC 4.5 μm light curve of Sco X-1. The typical error bar for an individual data point is shown in the upper left.
Download figure:
Standard image High-resolution image
Figure 20. WISE light curves of Sco X-1. The light curves from the initial 4-Band survey are plotted in the left hand column, and those from the 3-Band survey data are plotted in the right hand column.
Download figure:
Standard image High-resolution imageThe SED of Sco X-1 has been modeled on a number of occasions, such as in Neugebauer et al. (1969), Shahbaz et al. (1996), and Bandyopadhyay et al. (1999). In all cases a power-law-like spectrum over a wide wavelength range was the result. We have assembled the available photometry for Sco X-1 in Figure 21, along with ranges in variability (if published). Revnivtsev et al. (2012) compiled a similar set of data, and the Spitzer fluxes they found are in agreement with the values we derived. Vrtilek et al. (1991) discussed the derivations of the reddening values for Sco X-1 up to that time, including the likelihood that the extinction relation on this sightline might be unusual. Vrtilek et al. found that removal of the 2200 Å feature from IUE spectra using the average extinction law of Seaton (1979) gives E(B − V) = 0.3. As noted earlier, the UV to IR reddening relationships published in Cardelli et al. (1989) are incorporated into our SED modeling, allowing us to investigate the ratio of the total-to-selective extinction (RV).

Figure 21. SED of Sco X-1 with UV data from Willis et al. (1980), UBV data from McNamara et al. (2005 and references therein), gri data from APASS (http://www.aavso.org/download-apass-data), and JHK from 2MASS. The model SED (solid line) is comprised of the sum of hot (Teff = 20,000 K, dotted line) and cool (Teff = 3000 K, dashed line) blackbodies along with a weak free–free spectral component. Variability ranges are denoted by open circles.
Download figure:
Standard image High-resolution image
Obviously, Sco X-1 is a highly variable source, and thus fitting non-simultaneous data is fraught with uncertainty. As shown in McNamara et al. (2005), however, the vast majority of the time, Sco X-1 has V = 12.4 ± 0.2 mag. We will assume that the assembled data set (at least those bandpasses without variability ranges) represents Sco X-1 in a normal state. Shahbaz et al. (1996) fit their optical spectrum of Sco X-1 with a single power law of the form Fλ ∝ λ-2.46. Bandyopadhyay et al. (1999) fit their K-band spectrum with a steeper slope, α = −3.17, and found the discontinuity between the optical and IR spectral slopes to be inconsistent with standard accretion disk model spectra. While a single, reddened power law provided a reasonable fit for the optical to mid-IR SED, we found that when extrapolated to shorter wavelengths it did not agree with the mean UV fluxes. There was also a significant deviation from this power law in the near-IR. We found this to be true for all two-component models, suggesting that the 2MASS data observations might have occurred when Sco X-1 was unusually bright. Our best-fitting model, with AV = 0.9 mag, is one that incorporates two blackbodies, one hot (Tbb1 = 20,000 K) and one cool (Tbb2 = 3000 K), combined with a very weak free–free spectrum. The free–free component contributes 3% of the flux at K. We found that RV = 3.2 provided the best fit to the data, suggesting a rather normal extinction relation for this sightline. Whether the cool blackbody actually represents the secondary star or is simply an artifice necessary to fit an anomalous JHK data set can be easily tested by obtaining phase-resolved IR photometry of Sco X-1: the cool blackbody in this model accounts for 55% of the flux at K. Thus, if true, variations from an irradiated donor star should be easily detected.
3.7. GX 5-1
Naylor et al. (1991) presented near-IR photometry of the field of GX 5-1 and suggested that the IR counterpart to the X-ray source was either star "502" (K = 13.67) or "513" (K = 14.77). A K-band spectrum obtained by Bandyopadhyay et al. (2003) confirmed that star 513 was the correct counterpart. Jonker et al. (2000) present H- and K-band photometry for GX 5-1 (H = 14.1, K = 13.7), and found an unusual (unphysical) dereddened color of (H − K)○ = −0.5, using AV = 14. They suggested that maybe the estimated extinction was somehow incorrect. We have used NICFPS on the APO 3.5 m to obtain photometry of GX 5-1 and find K = 14.69 ± 0.05, (J − H) = 1.60, and (H − K) = 0.72. Our new photometry is in agreement with the results of Naylor et al. (1991). We find that Jonker et al. had an incorrect zero point in their calibration. For example, star 512 is in the 2MASS catalog and has K2MASS = 12.22, whereas Jonker et al. list it as having K = 11.28. The offset of ΔK = 0.94 mag for star 512 reconciles their GX 5-1 photometry with ours and that of Naylor et al. (1991). It is curious that Bandyopadhyay et al. (2003) found magnitudes similar to those reported by Jonker et al., when a simple inspection of the 2MASS point source catalog (PSC) shows no detected source at this position when it almost surely would have if GX 5-1 had the JHK magnitudes they reported. Referring the reader to Figure 1 in Bandyopadhyay et al., note that the 2MASS catalog lists star 512 as having J = 14.75, slightly fainter than their value for GX 5-1 (J = 14.68). As we have seen, it is not improbable to envision one of these objects varying by ΔK ∼ 1 mag, but GX 5-1 would have to show a larger change in J (ΔJ = 2.3 mag) than in K. This type of behavior is not consistent with that of the other Z-sources. As in Jonker et al., we believe that there is a significant zero point error in the flux calibration used by Bandyopadhyay et al. (2003), and that the discrepant photometry is not purely due to variability.
We have not listed fluxes in Table 2 for GX 5-1 because at the scale of the Spitzer images, this source remains partially blended with star "502." Using IRAF, we find that the blend of GX 5-1 with star 502 has a flux of 1.45 mJy at 3.6 μm, and star 502 appears to be the brighter of the two sources. At 4.5 μm, GX 5-1 now appears to dominate star 502, but the derived flux, 0.85 mJy, is still contaminated by its neighbor. The WISE PSC lists a source at the position of GX 5-1, but it is apparently a blend of several nearby objects.
4. DISCUSSION AND CONCLUSIONS
While our Herschel observations of Cir X-1 probably did not capture it at its peak brightness, they were sufficient to show that synchrotron emission is unlikely to strongly affect its optical/near-IR SED. As noted by Glass (1994), the shape of the SED of Cir X-1 changes very little between quiescence and outburst. We have modeled this as a reddened, hot blackbody. The change in luminosity of the fits between the two states is only a factor of 2.8. This supports the long-standing model for Cir X-1 where an increase in the accretion rate onto the compact object occurs as it passes through periastron. In this scenario the accretion disk physically expands in response to the increased mass transfer through the disk, like the outbursts of dwarf novae, leading to an increased optical/IR luminosity. Combining our V-band measurement with those reported by Moneti (1992), we find that the visual outburst lasts about five days and shows a smooth decline from maximum, similar to the eruptions of short period CVs. It is interesting to note that the prototypical dwarf novae SS Cyg shows a transient synchrotron jet during its eruptions (Körding et al. 2008), and that its radio light curve is similar to that of Cir X-1 in both morphology and duration (see Armstrong et al. 2013). D'Aí et al. (2012) discussed a model for the outbursts of Cir X-1 in the framework of the disk instability model originally evolved to explain the eruptions of CVs. D'Aí et al. note that the mass transfer rate itself could increase at periastron passage, increasing the surface density and triggering an outburst. Or, perhaps, the tidal interaction at periastron passage triggers an instability in the disk that leads to an increased surface density within the disk that initiates the eruption. They find that the main problem with these two scenarios is that they imply similar outbursts every cycle, and Cir X-1 has had at least one multi-year span of relatively little activity (2004–2010).
A model to explain the "super outbursts" in the frequently outbursting short period "SU UMa" CVs (Porb ⩽ 2 hr) invokes a tidal instability. Osaki (1989) proposed the Thermal–Tidal Instability model in which an eccentric, precessing accretion disk leads to "superhumps" in the outburst light curves, and periods of enhanced mass transfer (the so-called supercycle). A precessing, tilted accretion disk has been invoked to explain the superhumps in the LMXB GR Mus (Cornelisse et al. 2013). Precessing disks have also been used to explain the super-orbital periods for a number of X-ray binaries such as Her X-1 (Leahy & Igna 2010) and LMC X-4 (Wen et al. 2006). As touched upon by D'Aí et al. (2012), Be star X-ray binaries may be somewhat more relevant to Cir X-1. In Be systems, the non-degenerate star has a "decretion" disk that is tidally truncated by a neutron star companion in a highly eccentric orbit. The disks in these systems are also believed to precess, and these objects can show quasi-periodic, super-orbital periodicities of many years that appear to be related to the formation and depletion of material in the circumstellar disk (see Martin et al. 2011). Perhaps some similar cycle exists in Cir X-1 to explain both the extremely quiet periods, as well as the ultraluminous phase seen in the late 1970s.
4.1. The Other LMXBs
To provide context for our observations of Cir X-1, we felt it would be useful to extract previously unpublished data for other LMXBs with synchrotron jets to construct SEDs covering a wide wavelength regime to search for evidence of synchrotron break frequencies. The results were surprising in that a wide range of behavior was observed, but only some of it could be conclusively attributed to synchrotron emission. The two best-known Z-sources, Sco X-1 and Cyg X-2, revealed little evidence for synchrotron emission in the mid-IR. In fact, the small IR excesses over the blackbody models in their SEDs could be fully explained with a weak free–free component. In Cyg X-2, the secondary dominates the optical/near-IR SED, making it difficult to characterize the nature of the excess. In Sco X-1, we fit its SED with a combination of very hot (20,000 K) and very cool (3000 K) blackbodies, along with a weak free–free component. It is possible that the cool blackbody might be due to its secondary star, and follow-up near-IR spectroscopy of this source is clearly warranted (as would be IR light curves to search for ellipsoidal variations from the irradiated companion). No IR excess was detected for the Z-source GX 13+1, and the SED was simply fit with the sum of two blackbodies.
Both GX 349+2 and GX 17+2 (Harrison et al. 2011) show strong evidence for synchrotron emission that extends into the near-IR. Unfortunately, the data sets for both sources are quite sparse. In GX 17+2, the entire detected SED appears to be due to synchrotron emission, and integrating the model spectrum gives a jet luminosity of Lsync = 3.2 × 1034 erg s-1. Harrison et al. (2011) suggest that the periodic variability of this source is due to a precessing jet. If true, it is likely that we are viewing this source very close to the jet axis, and its observed luminosity might be enhanced by beaming. We estimate that the jet luminosity in GX 349+2 is only about 10% of that of GX 17+2. Both of these sources appear to have synchrotron luminosities that are somewhat smaller than that estimated for Cir X-1.
Homan et al. (2004) tabulated the distances and the mean and maximum radio fluxes for the Z-sources (their Table 4). If we compare the amount of mid-IR excess to the radio luminosity, we find that there is a trend for the lower luminosity radio sources (Sco X-1 and GX 5-1) to have weaker mid-IR excesses, and higher luminosity sources (GX 17+2) to have larger mid-IR excesses. Two objects appear to buck this trend: GX 349+2 has a large mid-IR excess but is the weakest of the radio sources, while GX 13+1 has a large radio luminosity but no detectable mid-IR excess. Both targets appear ripe for follow-up monitoring observations to determine if they might exhibit large flaring events that have previously been missed due to limited temporal coverage.
Since GRS 1915+105 contains a black hole, it is unlike the sources discussed above. As shown many times previously, we found GRS 1915+105 to be highly variable at all wavelengths. The only source discussed above that shows greater variability is GX 17+2. Like GX 17+2, GRS 1915+105 shows large amplitude IR flares that last several tens of minutes that can be attributed to synchrotron emission. While drawing too many conclusions about the SED of GRS 1915+105 is probably dangerous, this spectrum surely contains a significant synchrotron component which we presume is associated with its well-known jet. The issue with such a model, however, is that it does not produce significant emission at short enough wavelengths to be consistent with a synchrotron origin for its near-IR flares. This suggests that the simple, static synchrotron emission model we have used is unrealistic. Corbel et al. (2013) provide multi-epoch, multi-wavelength observations, including Herschel data, for the black hole transient system GX 339-4, and find that power-law fits to the mid-/far-IR fluxes are inconsistent with the observations. They found that the far-IR emission was much greater than a simple extrapolation from the radio to the near-IR. These results suggest the need for more realistic jet models.
Kaiser (2006) constructed model SEDs for both ballistic and adiabatic jets and found that a ballistic jet was consistent with the observations of Cyg X-1. He found that the energy losses in the adiabatic jet were large, requiring a highly constrained geometry to produce the required spectral shape. Malzac (2013) found by assuming that the input bulk Lorentz factor varies with a frequency profile of "flicker" (1/f) noise, internal shocks could provide sufficient re-energizing of the jet to balance the adiabatic losses. The SEDs of the ballistic jet models without radiative losses had much shallower slopes blueward of the break frequency than models with radiative loses, or as compared to the synchrotron spectra we have generated. This also appears to be the case for the flicker noise adiabatic jets. A model spectrum that declines more slowly to the blue would allow near-IR variations to be explained by jet processes. GRS 1915+105 is the obvious source for exploring these notions, but that will require simultaneous near- and mid-IR observations and, unfortunately, this source remains a difficult target beyond 5 μm with existing instrumentation.
This work is based in part on observations made with Herschel, a European Space Agency Cornerstone Mission with significant participation by NASA. Support for this work was provided by NASA through an award issued by JPL/Caltech. This publication makes use of data products from the Wide-field Infrared Survey Explorer, which is a joint project of the University of California, Los Angeles, and the Jet Propulsion Laboratory/California Institute of Technology, funded by the National Aeronautics and Space Administration. This work is also based in part on observations made with the Spitzer Space Telescope, obtained from the NASA/IPAC Infrared Science Archive, both of which are operated by the Jet Propulsion Laboratory, California Institute of Technology under a contract with the National Aeronautics and Space Administration. Swift/BAT transient monitor results were provided by the Swift/BAT team. This research has made use of the MAXI data provided by RIKEN, JAXA, and the MAXI team. M.M.B. is supported by NSF/AST grants 0407063 and 070707.
Footnotes
- *
Herschel is an ESA space observatory with science instruments provided by European-led Principal Investigator consortia and with important participation from NASA.
- 6
- 7
- 8
- 9
- 10
- 11
- 12
- 13
- 14
- 15
- 16
- 17
http://swift.gsfc.nasa.gov/results/transients/ (see Krimm et al. 2013).
- 18
http://maxi.riken.jp/top/ (see Matsuoka et al. 2009).