


ABSTRACT
Electronic spectra of three isomers of protonated anthracene and five isomers of protonated phenanthrene have been detected in 6 K neon matrices following deposition of mass-selected m/z = 179 cations produced from dihydro-anthracene or -phenanthrene. The cations exhibit moderately intense band systems in the 400–550 nm range. Corresponding neutrals have been observed in the UV. The absorptions are assigned to specific isomers of the protonated species on the basis of time-dependent density functional theory calculations. The astrophysical relevance of protonated anthracenes and phenanthrenes as candidates for carriers of diffuse interstellar bands is discussed.
Export citation and abstract BibTeX RIS
1. INTRODUCTION
It has been suggested that protonated polycyclic aromatic hydrocarbons (H-PAH+s) are important constituents of the interstellar medium (ISM). They may play a catalytic role for the synthesis of H2 (Bauschlicher 1998; Hirama et al. 2004), which likely proceeds in the following steps. The first is formation of H-PAH+ in a reaction of PAH+ with H, followed by attachment of a second H atom to produce H2-PAH+. The latter dissociates leading to H2, and PAH+ is recovered. Protonated PAHs can also be formed in the reaction of atomic hydrogen with PAH+ cations, hydrogen-deficient aromatic cations with molecular hydrogen, and that of neutral PAHs with H3+ (Le Page et al. 1997; Snow et al. 1998; Herbst & Le Page 1999). They might be involved in the unidentified infrared (UIR) emission bands (Hudgins et al. 2001) at 6.2 μm, C–H modes of a CH2 group and observed as a shoulder near the strong 3.3 μm IR emission band. This has recently stimulated a few gas-phase IR studies on H-PAH+s using mass-selected photodissociation (PD) spectroscopy and the messenger atom method (Ricks et al. 2009), or IR laser multiphoton PD spectroscopy (Knorke et al. 2009). IR spectra of a number of H-PAH+s have been obtained; the spectrum of protonated coronene (Knorke et al. 2009) resembles to some extent UIRs.
Experimental data on the electronic spectroscopy of this class of molecules are scarce. H-PAH+s are known intermediates in organic chemistry and were subject to spectroscopic studies several decades ago. The arenium ions were generated by dissolving PAHs in strong acidic solutions and their properties were investigated by NMR, IR (Olah et al. 1978), and optical methods (Olah et al. 1966; Perkampus & Baumgarten 1964; Reid 1954). The structure elucidated from these studies is the σ-complex of the proton attached to the aromatic hydrocarbon moiety. Recent gas-phase studies have reported the electronic spectra of protonated naphthalene (Alata et al. 2010b) and some larger protonated linear acenes (Alata et al. 2010a). They consist of a sharp origin band followed by a complex, unclear pattern.
The suggestion that protonated PAHs could be responsible for certain diffuse interstellar bands (DIBs) has been put forward (Pathak & Sarre 2008), because time-dependent (TD) density functional theory (DFT) calculations reveal that some such cations could have strong transitions in the visible domain, where DIBs are detected. To test this, laboratory gas-phase spectroscopic measurements on protonated PAHs are necessary. As a step toward this and to decide which protonated PAHs should be focused on, we have succeeded in measuring the electronic absorption spectra of protonated anthracene and phenanthrene isomers isolated in 6 K neon matrices using mass-selected ions. These data are more useful than just the theoretical DFT values as they show unambiguously the wavelength region of the electronic transition and give an indication of their oscillator strength.
2. EXPERIMENTAL
The apparatus used in this study was described by Fulara et al. (2010). Protonated phenanthrene and anthracene cations were produced in a hot cathode discharge source from 9,10-dihydro-phenanthrene (9,10DHPh) and 9,10-dihydro-anthracene (9,10DHAn) vapors seeded in helium. The cations were extracted from the source by electrostatic lenses and guided to a quadrupole bender, where they were separated from neutral molecules. The ion beam was then directed into a quadrupole mass filter which was set to transmit only m/z = 179 ± 0.5 cations. These were codeposited with neon onto a rhodium-coated sapphire substrate held at 6 K. The current of the cations arriving at the surface was measured during matrix growth (4–5 hr): total charge was 50–65 μC in the case of protonated phenanthrene and 80–85 μC for protonated anthracene.
The detection system is a single-beam spectrometer. It consists of a light source (xenon or halogen lamp) and a spectrograph equipped with an open-electrode CCD detector. Broadband light is focused onto the entrance slit of the matrix and propagates ∼20 mm parallel to the substrate surface through the ∼150 μm neon layer. The beam coming out of the exit slit is focused onto a bundle of 50 quartz fibers, illuminates the diffraction grating of the 0.3 m spectrograph and is detected by a CCD. The absorption spectra are recorded in several sections covering the 220–1100 nm range.
Due to the high intensity of the broadband light source, care was taken to minimize photoconversion of the species during the recordings. Measurements were always started at the longest wavelength and continued into the UV. Appropriate long-pass filters were also used. In order to check whether photoconversion of the isolated species had taken place during the scans, the spectra were recorded anew.
Ions can be trapped in the matrix efficiently if their electrical charge is balanced with counterions. For this purpose chloromethane was added to the neon in the ratio 1:40,000. Some cations hit metal surfaces of the vacuum chamber and release free electrons. These are attracted by the positively charged matrix and captured by CH3Cl, which dissociatively forms Cl− and CH3. The former compensates the charge of the deposited cations. Due to a very low concentration of CH3Cl (and even lower of CH3 and Cl−) these species do not perturb the electronic spectra of the trapped cations.
3. RESULTS AND DISCUSSION
3.1. Protonated Anthracene (H-An+)
Deposition of m/z = 179 cations produced from 9,10DHAn into a neon matrix resulted in a number of moderately strong absorption systems in the visible range (Figure 1, trace (a)). Known absorptions of the anthracene cation (An+) in the near infrared and UV (Szczepanski et al. 1993), and weak ones of the phenanthrene cation (Ph+) in the near IR (Brechignac & Pino 1999; Salama et al. 1994) are also present in the spectrum. The reason why bands of An+ appear when H-An+ cations are deposited could be the contamination of the precursor sample (9,10DHAn) with An or decomposition of the precursor in the ion source. Of 100 anthracene molecules about 15 contain one 13C atom. Parent ions of the latter isotopologues have the same m/z as H-An+ ions. Fragmentation of H-An+ during growth of the matrix could be another reason for the presence of An+. Weak bands of Ph+ in the near IR are likely caused by the contamination of 9,10DHAn with 9,10DHPh, though isomerization of H-An+ in the ion source resulting in H-Ph+ cannot be ruled out.
Figure 1. Absorption spectra recorded in a 6 K neon matrix after deposition of m/z = 179 cations produced from (a) 9,10-dihydro-anthracene and (c) 9,10-dihydro-phenanthrene; (b) spectrum of protonated anthracenes obtained after scaling trace (c) to the same intensity of the distinct absorption at 532 nm and subtracting it from trace (a); (d) spectrum of protonated phenanthrenes obtained after scaling trace (a) to the same intensity of the absorption at 453 nm and subtracting it from trace (c).
Download figure:
Standard image High-resolution imageIn order to test whether the new absorptions seen in Figure 1 (trace (a)) are unique for HAn+, mass-selected H-Ph+ generated from 9,10DHPh were deposited; the obtained spectrum is shown in trace (c). Comparison of the two spectra reveals some similarity. The strongest bands of H-Ph+ are also seen, although weakly, in the spectrum of H-An+, indicating that in the H-An+ experiment H-Ph+ cations were also formed.
To separate absorptions of H-Ph+ from those of H-An+, the spectrum of the former was subtracted from that of the latter after scaling by an appropriate factor so that the distinct, intense bands of H-Ph+ would have the same intensity in both spectra. The result is trace (b). Comparison of traces (a)–(c) indicates that the electronic spectrum of H-Ph+ also contains the absorptions of H-An+. They can again be removed by subtraction, after scaling the H-An+ trace by a factor such that the distinct band at 453 nm has the same intensity in both spectra. The absorption of H-Ph+ is the bottom trace of Figure 1.
The "pure" spectrum of H-An+ is redrawn in Figure 2. The intensities of the bands decrease after UV irradiation of the matrix, confirming its ionic origin. Three band systems are distinguished. The first one with onset at 493.8 nm shows a long progression built on the ∼200 cm−1 mode. Each band of this system has a sharp long-wavelength shoulder, which is spaced from the maximum of the band by ∼50 cm−1. It is the zero phonon line, often observed in spectra of matrix-isolated species. The strongest band at 453.5 nm forms the second system; the third system is a group of broad absorptions around 410 nm. The base line was not corrected in this region and may contain a broad bump underneath the absorptions, which could be artificial, due to light interference upon probing the matrix. Wavelengths of the band maxima are collected in Table 1.
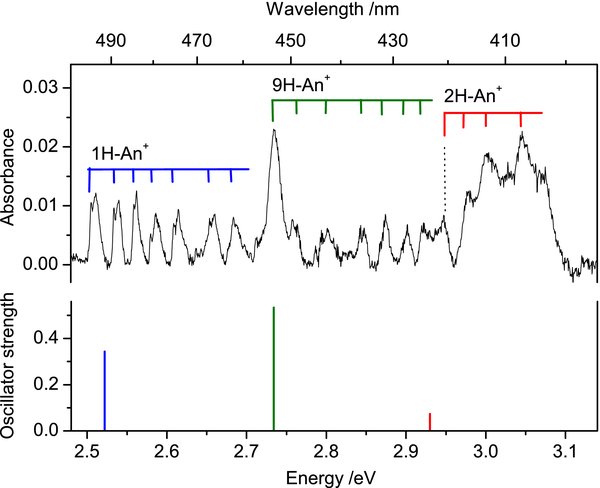
Figure 2. Electronic absorption spectrum of protonated anthracenes compared to the strongest computed excitation energies of the three isomers (stick diagram). Transition energies, calculated with TD DFT at the B3LYP/6–311G(d, p) level of theory, are shifted by −0.65 eV.
Download figure:
Standard image High-resolution imageTable 1. Observed Band Maxima and Their Assignments of Protonated Anthracenes and Phenanthrenes, and Their Neutrals in a Neon Matrix
| λ (nm) |  (cm−1) (cm−1) |
 (cm−1) (cm−1) |
Assignment |
|---|---|---|---|
| Protonated anthracenes | |||
| 493.8 | 20 251 | 0 | 000 (2)1A'←  A' 1H-An+ A' 1H-An+ |
| 488.2 | 20 483 | 232 | ν46 |
| 484.0 | 20 661 | 410 | 2ν46 |
| 479.4 | 20 859 | 608 | 3ν46 |
| 474.2 | 21 088 | 837 | ν38 |
| 466.1 | 21 455 | 1204 | ν28–31 |
| 462.0 | 21 645 | 1394 | ν20–23 |
| 449.8 | 22 232 | 1981 | ν38 + ν28–31 |
| 442.7 | 22 589 | 2338 | 2ν28–31 |
| 453.5 | 22 051 | 0 | 000 (2)1B2←  1A1 9H-An+ 1A1 9H-An+ |
| 442.7 | 22 589 | 538 | ν20 |
| 435.4 | 22 967 | 917 | ν17 |
| 431.4 | 23 180 | 1130 | ν15 |
| 427.4 | 23 397 | 1347 | ν11 |
| 424.5 | 23 557 | 1506 | ν20 + ν17 |
| 420.8 | 23 764 | 0 | 000 (2)1A'←  1A' 2H-An+ 1A' 2H-An+ |
| 416.5 | 24 010 | 246 | ν43 |
| 413.3 | 24 195 | 431 | ν41 or ν42 |
| 407.2 | 24 558 | 794 | ν35 |
| Hydro-anthracenyl radical | |||
| 326.4 | 30 637 | 0 | 000 H-An |
| 320.7 | 31 182 | 545 | |
| 313.2 | 31 928 | 1291 | |
| 305.7 | 32 712 | 2075 | |
| Protonated phenanthrenes | |||
| 596.6 | 16 762 | 0 | 000 (1)1A'←  1A' 9H-Ph+ 1A' 9H-Ph+ |
| 578.2 | 17 295 | 533 | ν42 |
| 561.4 | 17 813 | 1051 | 2ν42 |
| 543.7 | 18 392 | 1631 | ν12 |
| 530.3 | 18 857 | 0 | 000 (2)1A'←  1A' 9H-Ph+ 1A' 9H-Ph+ |
| 518.6 | 19 283 | 425 | ν44 |
| 506.1 | 19 759 | 902 | ν36 or ν37 |
| 495.5 | 20 182 | 1324 | ν22–24 |
| 465.9 | 21 464 | 2607 | 2ν22–24 |
| 583.3 | 17 144 | 0 | 000 (1)1A'←  1A' 2H-Ph+ 1A' 2H-Ph+ |
| 570.1 | 17 541 | 397 | ν45 |
| 564.7 | 17 709 | 565 | ν41 |
| 417.4 | 23 958 | 0 | 000 (2) A'←  1A' 2H-Ph+ 1A' 2H-Ph+ |
| 410.5 | 24 361 | 403 | ν44 |
| 404.0 | 24 752 | 795 | 2ν44 |
| 397.4 | 25 164 | 1206 | 3ν44 |
| 391.3 | 25 556 | 1598 | 4ν44 |
| 385.5 | 25 940 | 1983 | 5ν44 |
| 532.8 | 18 769 | 0 | 000 (1)1A'←  1A' 1H-Ph+ 1A' 1H-Ph+ |
| 518.6 | 19 283 | 514 | ν42 |
| 507.9 | 19 689 | 920 | ν36 |
| 484.5 | 20 640 | 0 | 000 (2)1A'←  1A' 3H-Ph+ 1A' 3H-Ph+ |
| 474.6 | 21 070 | 431 | ν44 |
| 472.3 | 21 173 | 533 | ν42 |
| 465.9 | 21 464 | 824 | 2ν44 |
| 433.1 | 23 089 | 0 | 000 (2)1A'←  1A' 4H-Ph+ 1A' 4H-Ph+ |
| 425.8 | 23 485 | 396 | ν45 |
| 551.8 | 18 123 | Not assigned | |
| 444.7 | 22 487 | Not assigned | |
| Hydro-phenanthrenyl radical | |||
| 375.1 | 26 660 | 0 | 000 9H-Ph |
Download table as: ASCIITypeset image
Several decades ago H-An+ was studied in strong acidic solutions (Aalbersberg et al. 1959; Dallinga et al. 1958; Gold & Tye 1952; Reid 1954) and melted salts (Brigodiot & Lebas 1976; Zingg et al. 1984), and its electronic spectrum was reported. The anthracenium ion H-An+ exhibits a strong, broad absorption with maximum around 410–430 nm in these environments. Because these spectra were measured in strongly perturbing media, it is meaningless to compare them with the present neon matrix data.
In order to assign the observed band systems of H-An+, DFT calculations using the B3LYP functional and the 6–311G(d, p) basis set were carried out for three isomers of H-An+ differing in the proton position on the anthracene skeleton. All computations were done using the Gaussian 03 program suite (Frisch et al. 2004). The lowest energy was found for the isomer which has the proton attached at position 9 of anthracene (9H-An+) (Figure 3). Two other isomers, 1H-An+ and 2H-An+, lie 36.4 and 49.3 kJ mol−1 higher. The values are corrected for zero-point vibrational energies. Excitation energies of these three isomers of H-An+ were calculated using the TD DFT method at the B3LYP/6–311G(d, p) level of theory and are collected in Table 2. The strongest transition for all considered isomers of H-An+ was predicted in the UV and its excitation energy lies within the 3.2–3.6 eV range. Usually, TD DFT overestimates the excitation energy; this can be by as much as 0.5 eV. Taking this into account, the excitation energies of the three isomers are close enough to the onsets of three band systems of H-An+. The match is even better if a shift of 0.65 eV is used. Corrected electronic transition energies of the three isomers of H-An+ and the corresponding oscillator strengths are displayed in Figure 2.
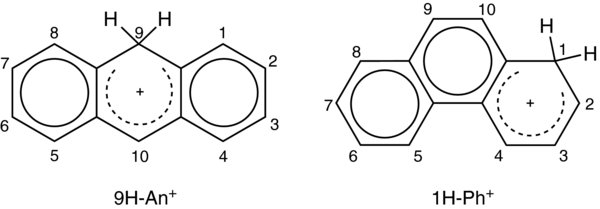
Figure 3. Lowest energy isomers of protonated anthracene and phenanthrene.
Download figure:
Standard image High-resolution imageTable 2. Excited State Symmetries, Calculated Excitation Energies and Oscillator Strengths for Protonated Anthracenes and Phenanthrenesa,b
| Protonated Anthracenes | Protonated Phenanthrenes | ||||
|---|---|---|---|---|---|
| Exc. St. Symm. | ΔE (eV) | f | Exc. St. Symm. | ΔE (eV) | f |
9H-An+,  1A1, C2v (0) 1A1, C2v (0) |
1H-Ph+,  1A', Cs (0) 1A', Cs (0) |
||||
| 1A1 | 2.78 | 0.02 | 1A' | 2.39 | 0.15 |
| 1B2 | 3.13 | 0.0002 | 1A' | 2.64 | 0.02 |
| 1B2 | 3.39 | 0.5 | 1A' | 3.95 | 0.2 |
| 1B1 | 4.78 | 0.0003 | 1A' | 4.33 | 0.005 |
| 1A2 | 4.83 | 0 | 1A'' | 4.66 | 0 |
1H-An+,  1A', Cs (36.4) 1A', Cs (36.4) |
9H-Ph+,  1A', Cs (0.6) 1A', Cs (0.6) |
||||
| 1A' | 1.92 | 0.05 | 1A' | 2.36 | 0.06 |
| 1A' | 3.17 | 0.3 | 1A' | 2.60 | 0.09 |
| 1A' | 3.69 | 0.006 | 1A' | 3.89 | 0.002 |
| 1A' | 4.35 | 0.04 | 1A' | 4.37 | 0.06 |
| 1A'' | 4.56 | 0.0003 | 1A'' | 4.56 | 0.0001 |
2H-An+,  1A', Cs (49.3) 1A', Cs (49.3) |
3H-Ph+,  1A', Cs (2.4) 1A', Cs (2.4) |
||||
| 1A' | 1.91 | 0.07 | 1A' | 2.63 | 0.04 |
| 1A' | 3.42 | 0.006 | 1A' | 2.70 | 0.2 |
| 1A' | 3.58 | 0.07 | 1A' | 4.13 | 0.03 |
| 1A' | 4.57 | 0.04 | 1A' | 4.56 | 0.009 |
| 1A'' | 4.60 | 0 | 1A' | 4.64 | 0.06 |
4H-Ph+,  1A', Cs (4.4) 1A', Cs (4.4) |
|||||
| 1A' | 2.01 | 0.03 | |||
| 1A' | 2.96 | 0.2 | |||
| 1A' | 3.74 | 0.03 | |||
| 1A' | 4.43 | 0.2 | |||
| 1A'' | 4.49 | 0.0002 | |||
2H-Ph+,  1A', Cs (9.0) 1A', Cs (9.0) |
|||||
| 1A' | 2.24 | 0.04 | |||
| 1A' | 3.26 | 0.2 | |||
| 1A' | 3.80 | 0.03 | |||
| 1A'' | 4.58 | 0 | |||
| 1A' | 4.63 | 0.5 | |||
Notes. aExcitation energies were calculated with TD DFT at the B3LYP/6–311G(d, p) level of theory. bRelative ground-state energies (kJ mol−1) with respect to the most stable isomer are given in parentheses.
Download table as: ASCIITypeset image
The onset of the first band system at 493.8 nm lies close to the calculated transition energy of 1H-An+. It agrees also well with recent gas-phase photofragmentation data, where the S1←S0 transition of protonated anthracene was observed at 491.43 nm (Alata et al. 2010a). The origin of the second system at 453.5 nm coincides with the calculated excitation energy of 9H-An+. The broadband system located around 410 nm has energy close to the predicted transition of isomer 2H-An+. Therefore, we tentatively assign each band system of H-An+ to its nearest-in-energy transition of different isomers. The assignment of individual vibrational bands that form these systems is given in Table 1. It is based on calculated ground-state frequencies of the species considered. In some cases the assignment is not unambiguous, because several modes have frequencies falling within ± 30 cm−1 of the observed ones.
Besides the visible absorptions of H-An+ discussed above, the UV range is also relevant for these species. The 295–385 nm section of the spectrum measured after deposition of H-An+ into a neon matrix is depicted in Figure 4 (trace (b)). The strongest bands are the absorptions of anthracene cation (trace (a)) and neutral anthracene (trace (e)). The reason why An+ is present in the matrix when H-An+ was deposited was discussed in the first paragraph of this section. Neutral anthracene appears in the matrix as a result of the neutralization of An+. After stepwise UV irradiation of the matrix new absorptions in the 300–340 nm range appeared and grew in intensity (traces (c) and (d)). They are better seen in the inset of Figure 4 where the bands of An+, which remained after UV irradiation, were removed. The system, which has appeared after UV photobleaching of H-An+ cations, is of hydro-anthracenyl radical (H-An).

Figure 4. UV part of the absorption spectra recorded after (b) deposition of C14H11+ cations in a 6 K neon matrix produced from 9,10-dihydro-anthracene, (c) 20 minute and (d) subsequent 25 minute irradiation with a medium-pressure Hg lamp; (a) and (e) are spectra of anthracene cation (An+) and neutral anthracene (An), respectively. The inset shows absorption of hydro-anthracenyl radical (H–An), appearing as a result of photobleaching of the H–An+ cations.
Download figure:
Standard image High-resolution imageAccording to TD DFT calculations, two isomers of neutral H-An, 9H-An and 1H-An, have strong transition in the UV range around 342 and 337 nm respectively (J. Fulara et al. 2010, electronic excitation energies calculated with TD DFT at the B3LYP/6-311G(d, p) level of theory, unpublished). These are close to the observed band system with onset at 326.4 nm. It is difficult to find out from the present experimental data which H-An isomer is responsible for the absorptions in this region. It is also possible that both 9H-An and 1H-An contribute to the spectrum in Figure 4, as the bands have a peculiar intensity distribution and may belong to two overlapping systems.
3.2. Protonated Phenanthrene (H-Ph+)
The electronic absorption spectrum obtained after mass-selective deposition of m/z = 179 cations produced from 9,10DHPh is presented in Figure 1 (trace (c)), and after removing the absorptions of H-An+ in trace (d). The spectrum is rich in absorption bands, which probably belong to several electronic systems. Thus, a number of UV irradiation experiments were carried out on a matrix containing H-Ph+ ions. These differed in exposure time and wavelength domain of the UV radiation. Spectra recorded after deposition and some irradiation steps are compared in Figure 5. The absorption measured after deposition of the cations is trace (a) and those detected after subsequent UV irradiation are traces (b)–(e). To indicate the changes in intensity of the bands, two spectra measured after different irradiation schemes were subtracted from each other after normalizing them to the same intensity of the specific band (traces (f) and (g)).
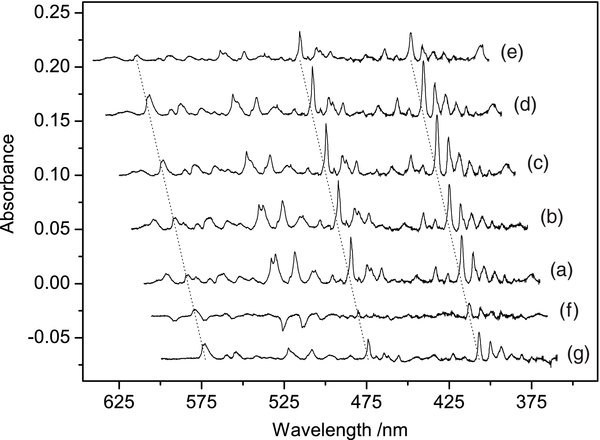
Figure 5. Absorption spectra recorded after deposition of C14H11+ cations in a 6 K neon matrix produced from 9,10-dihydro-phenanthrene after (a) deposition, (b) exposure to the UV radiation of a high-pressure Xe lamp during measurement, (c) 30 minute and (d) additional 30 minute photobleaching with 390 nm > λ > 250 nm, (e) subsequent 20 minute irradiation with a full medium-pressure Hg lamp; (f) = (c)–(a) and (g) = (d)–(e) show changes in the intensities of bands following the irradiation steps.
Download figure:
Standard image High-resolution imageThe spectra in Figure 5 reveal several electronic band systems, which behave differently under irradiation conditions; this indicates their different origin. Eight band systems of H-Ph+ could be distinguished after deposition in a neon matrix. The spectrum is redrawn in Figure 6 and the absorptions belonging to the same isomer of H-Ph+ are marked with a specific color.

Figure 6. Electronic absorption spectrum of protonated phenanthrenes compared to the excitation energies of the five considered isomers (stick spectrum), calculated with TD DFT at the B3LYP/6–311G(d, p) level of theory; n.a.—not assigned bands.
Download figure:
Standard image High-resolution image
Seven of the eight systems decrease in intensity after prolonged irradiation with a medium-pressure Hg lamp (Figure 5, trace (e)). Only the absorption at 375 nm behaves in an opposite way. Therefore, it belongs to neutral species. Most likely it is the hydro-phenanthrenyl radical (H-Ph) which should appear in the matrix as a result of the neutralization of H-Ph+ cations. The most stable neutral fragment (phenanthrene molecule), which could be formed from the H-Ph+ ions, can be excluded as a carrier of this band, because it absorbs at shorter wavelengths (Salama et al. 1994) and its systems were also detected in this experiment.
In the past, 9-hydro-phenanthrenyl radical (9H-Ph) was studied in organic solutions. It was produced by hydrogen subtraction from 9,10DHPh (Koizumi et al. 1997) or by hydrogen addition to phenanthrene (Grodkowski et al. 2003; Kawakubo 1980) following pulse radiolysis. The spectrum consists of a broad band with maximum at 395 nm. This is not too far from the observed absorption at 375 nm for the neutral product in the present experiment. Therefore, the absorption is assigned to the 9H-Ph radical.
The other seven systems have ionic origin, because they decrease upon UV irradiation. They belong to different isomers of H-Ph+. Protonated phenanthrene has been studied in strong acidic solutions and the spectrum exhibits two broad absorptions with maxima at 410 and 520 nm (Dallinga et al. 1958; Reid 1954). These electronic systems were tentatively assigned to two isomers: 1H-Ph+ and 9H-Ph+. The spectrum of H-Ph+ in solution covers the same spectral range as in Figure 6. Interaction of solvent molecules with dissolved ionic species is much stronger than with neutrals. Therefore, detailed comparison of these two spectra is of no relevance, in contrast to the neutral hydro-phenanthrenyl radical.
In order to deduce which isomers of H-Ph+ are responsible for the spectrum in Figure 6 the ground-state energy of the isomers 1H-, 2H-, 3H-, 4H- and 9H-Ph+ have been calculated using the DFT method with the B3LYP functional and the 6–311G(d, p) basis set. All considered isomers have similar energies spanning only 9 kJ mol−1 (Table 2). The calculations predict 1H-Ph+ to be the most stable isomer, but 9H-Ph+ lies only 0.6 kJ mol−1 higher. The highest in energy was found to be 2H-Ph+, located 9 kJ mol−1 above 1H-Ph+. Because the energy difference of the five isomers is so small, their relative order may change with higher-level calculations.
To assign the spectrum in Figure 6 to a specific isomer of H-Ph+, excitation energies are needed. TD DFT calculations were carried out for the five isomers considered above. Computed excitation energies and their oscillator strengths are collected in Table 2 and displayed in Figure 6. All H-Ph+ isomers have two allowed electronic transitions in the visible, where the absorptions of protonated phenanthrenes have been detected. We tentatively assign the observed band systems to specific isomers of H-Ph+ by comparing the excitation energy of its strongest transition with the onset of the nearest system. Dotted lines indicate which isomer is responsible for a certain band system. Individual bands of a given system are assigned using calculated vibrational frequencies of the H-Ph+ isomers in their ground state (Table 1).
4. RELEVANCE OF H-An+ AND H‑Ph+ TO DIBs
It has been considered that H-PAH+s could be carriers of some DIBs (Pathak & Sarre 2008). H-PAH+s can be formed in the ISM in ion–molecule reactions of hydrogen-deficient PAH+ cations with H2, of atomic hydrogen with PAH+ or neutral PAHs with highly abundant H3+. All the above mechanisms assume the presence of PAH+ ions in the ISM; therefore, their astrophysical relevance should also be discussed.
The present spectroscopic studies on protonated anthracene and phenanthrene allow a direct comparison of their transition intensities with the anthracene An+ and phenanthrene Ph+ cations. The electronic transitions of An+ and Ph+ in the near IR are an order of magnitude stronger than the visible absorptions of the protonated species.
The electronic transition of Ph+ in a neon matrix (Salama et al. 1994) and in the gas phase, as the Ph+–Ar complex (Brechignac & Pino 1999), have been reported. The position of all bands reported in neon agrees well with our studies; however, their relative intensities in the near IR system are different. In the present mass-selective experiment, besides Ph+ the absorption of neutral phenanthrene has also been detected in the UV. The oscillator strength of the near IR band system of Ph+ is evaluated to be 0.25 by measuring the change of the intensity of cationic and neutral phenanthrene absorptions induced by UV irradiation of the matrix, and using the experimental oscillator strength of the latter (Clar 1964). This value is about four orders of magnitude higher than that reported by Salama et al. (1994), but is close to the gas-phase value (0.15 ± 0.05; Brechignac & Pino 1999). High oscillator strength of the near-IR transition of Ph+ is confined mainly to the origin band at 892 nm and makes it favorable for the search in the ISM. An+, similarly to Ph+, has a strong electronic transition in the near-IR region with the onset around 709 nm, as well as about a five times stronger system around 349 nm (in a neon matrix). The latter could be used for a sensitive detection of An+.
The results of the present spectroscopic study on protonated anthracene and phenanthrene isolated in neon matrices reveal that their electronic transitions fall in the 400–550 nm range, where a number of broad DIBs are found (Jenniskens & Désert 1994; Hobbs et al. 2008). Several isomers of these species are detected in the neon matrix; they have moderately intense absorption systems. In the case of protonated phenathrene, all five isomers have energies within 9 kJ mol−1 of each other. If H-Ph+ is formed in the reaction of neutral phenanthrene with H3+ in the ISM, then these five isomers should be about equally populated, and hence their column density in a specific line of sight would be lower than for Ph+. This and the lower oscillator strength of the visible transition of protonated phenathrenes in comparison with the near IR one of Ph+ could hamper their optical detection in the ISM. Similar arguments apply to the detection of H-An+. More promising are the protonated PAHs which form fewer isomers (e.g., coronene) and if they have a larger oscillator strength.
This work has been supported by the Swiss National Science Foundation (project no. 200020–124349/1).