
Abstract
Cobalt nanowires, 40 nm in diameter and several micrometers long, have been grown by controlled electrodeposition into ordered anodic alumina templates. The hcp crystal symmetry is tuned by a suitable choice of the electrolyte pH (between 3.5 and 6.0) during growth. Systematic high resolution transmission electron microscopy imaging and analysis of the electron diffraction patterns reveals a dependence of crystal orientation from electrolyte pH. The tailored modification of the crystalline signature results in the reorientation of the magnetocrystalline anisotropy and increasing experimental coercivity and squareness with decreasing polar angle of the 'c' growth axis. Micromagnetic modeling of the demagnetization process and its angular dependence is in agreement with the experiment and allows us to establish the change in the character of the magnetization reversal: from quasi-curling to vortex domain wall propagation modes when the crystal 'c' axis tilts more than 75° in respect to the nanowire axis.
Export citation and abstract BibTeX RIS
1. Introduction
Magnetic nanowires (NWs) are widely investigated nowadays owing to their broad range of applications including but not limited to local drug delivery [1], hyperthermia treatment [2, 3], cell manipulation [4–6], microfluidics [7, 8] and micromechanics [9, 10], conceptually new memory devices [11, 12], or magnetic sensors and actuators [13–16]. Among different growth methods, template-assisted electrodeposition techniques are becoming increasingly used due to high level of control they provide over morphology and packing density of NWs. Other benefits are the low cost of the process and the high degree of reproducibility of the morphology and the magnetic characteristics.
Many studies have been reported on various families of metallic nanowires with diverse composition (particularly Fe and Ni based nanowires) [17–21]. More recently, several studies have been published on Co based nanowires grown in self-assembled porous alumina templates. It has been shown that their crystalline structure can be intentionally controlled by the parameters of electroplating, namely electroplating time and current density as well as bath temperature and electrolyte pH [22–26]. The ac electrodeposition produces mainly nanocrystalline nanowires. The grains of the nanowires grown by direct current (dc) electroplating can be of micrometer size, namely the growth of the nanowires with crystal sizes of 1–2 μm has been reported [27, 28]. For the most of the aforementioned applications it is extremely important to have NWs with very good crystal structure, ideally single crystal NWs.
The performance of magnetic nanostructures is determined by their precisely engineered design and material properties. Cobalt with hcp crystal structure has a very strong uniaxial magnetic anisotropy with easy axis parallel to the c-axis. Single crystal hcp Co nanowires can be very good candidates for designing a system with controllable magnetic properties by simply adjusting the c-axis orientation in respect to the axis of the nanowire. The interplay of the strong shape and magnetocrystalline anisotropy may result in a system with very peculiar magnetic properties. Recently, our micromagnetic simulations [29] have predicted a significant change of the magnetic properties and reversal modes of single crystal hcp Co nanowires with the inclination of the c-axis in respect to the nanowire axis.
A first objective of this work has been the template assisted electrodeposition growth of single-crystal Co nanowires with crystalline structure tailored through the electrolyte pH. Second, we aimed at the determination of the fine crystal structure of single crystal hcp Co nanowires. Particularly, transmission electron microscopy data are decisive for unveiling the true orientation of the hcp c-axis. And third, we would like to establish the correlation of magnetic behavior with such crystal structure. The micromagnetic simulations based on finite elements, performed in experimental conditions, are decisive to understand the magnetic behavior of these NWs.
2. Experimental details
Anodic alumina membranes (AAM) with highly ordered hexagonal self-assembled nanopore arrays were prepared by a two-step anodization process in oxalic acid [30]. Prior to anodization, high-purity (99.999%) aluminum disks were degreased in acetone with ultrasound and cleaned by electropolishing in a mixture of perchloric acid and ethanol (HClO4:C2H5OH = 1:4 in volumetric ration) for 2 min at 6 °C under vigorous stirring. Afterwards, samples were rinsed in an ethanol solution and dried.
The first anodization procedure was performed using a 0.3 M oxalic acid solution as electrolyte at 3 °C temperature and an anodization voltage of 40 V. Following the first anodization, the sample was immersed in chromic acid/phosphoric acid mixture at room temperature until the oxide layer was dissolved. The second anodization was performed for 20 h resulting in the pores reaching a depth of 40 μm. Followed treatment in phosphoric acid increased the pores diameter to about 40 nm. Then, the non-oxidized Al layer at the bottom of the disk was chemically removed as well as the alumina bottom layer. A thin Au layer was then sputtered onto the open backside of the membrane to serve as an electrode for the subsequent Co electroplating.
Cobalt nanowires were grown at 30 °C in an aqueous solution of 250 g l−1 CoSO4 and 40 g l−1 H3BO3. An Ag/AgCl reference electrode was combined into a three-electrode system in which a platinum electrode served as a counter electrode to conduct potentiostatic dc electrodeposition. Electroplating was performed at −1 V. To study NW's arrays prepared under different pH, the solution pH value was gradually increased from 3.5 to 6.0 by addition of diluted NaOH. The electroplating time was tuned to reach an average length of the nanowires of around 7 μm.
The morphological characterization of the samples was performed using a Philips XL3O scanning electron microscopy (SEM). The prepared membranes were broken and the sharp cross-sections have been used for characterization.
An X'Pert PRO x-ray diffractometer was employed for the characterization of the crystal structure. The θ–2θ scans were performed with the scattering vector parallel to the nanowire axes (perpendicular to the plane of AAM). Before the x-ray diffraction (XRD) measurements, the Au metallic contact layer was partially removed using an iodine solution. Nevertheless, figures 1(b)–(d) still shows the presence of peaks ascribed to the remains of Au.
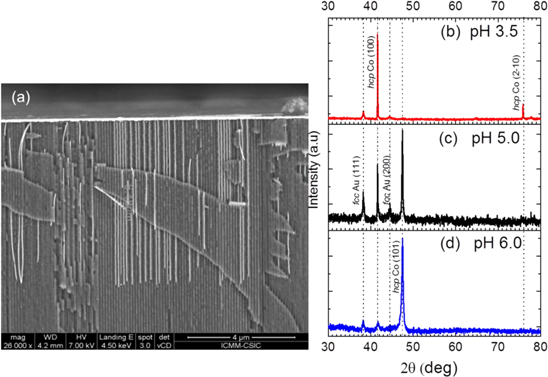
Figure 1. (a) Cross-sectional SEM image of Co nanowires embedded in AAM, where the brighter segments denote the Co nanowires and the Au contact layer on top of the membrane. (b)–(d) XRD patterns of arrays of Co nanowires showing different textural characteristics of the wires grown at different pH.
Download figure:
Standard image High-resolution imageTEM studies were performed on Titan™ G2 60–300 transmission electron microscope (FEI, Netherlands), operated at 300 kV. For the TEM studies of nanowires, the following protocol was applied. Individual nanowires have been released from the AAM. The alumina was dissolved in Cr2O3/H3PO4−H2O solution at 40 °C. Afterwards, we proceeded to clean nanowires in ethanol. Finally, a drop of ethanol containing Co nanowires was placed on a holey carbon on copper TEM grid and then dried. Series of 100 convergent beam electron diffraction (CBED) patterns were recorded using an electron probe positioned at different points along the NW length. Analysis of Kikuchi lines shifts allowed monitoring the rotation of the crystal structure along the wire with a milliradian precision.
The magnetic properties of the nanowire arrays were studied using a vibrating sample magnetometer (VSM) (EV7 KLA-Tencor). The magnetization curves were measured under magnetic fields up to 17 kOe, and the angular dependence of the hysteresis parameters was determined by varying the orientation of the applied field in respect to the nanowire's axis between parallel (||) and perpendicular (⊥).
Micromagnetic simulations have been performed using MAGPAR software package [31] with the typical magnetic parameters of bulk hcp Co (table 1). The demagnetization process has been simulated for ordered hexagonal arrays of 7 nanowires with typical parameters for AAM (40 nm diameter and 105 nm interpore distance) and the NW length of 2 μm (to maintain a high aspect ratio length/diameter). The average finite element discretization size was chosen to be 4 nm. Recently, we have shown that the most important interaction effect is already present in an array of 7 NWs [24]. In the simulations, a particular c-axis orientation for each array prepared under different pH was considered as presented in table 2. As mentioned above, for the NWs prepared under higher pH the c-axis rotates around the NW along its length, keeping the same relative inclination in respect to the NW axis. In order to reproduce this feature in the simulations, the orientation of c-axis in-plane of array was taken randomly for each nanowire. The relative c-axis orientation in respect to the NW axis was chosen in agreement with TEM studies (table 2) and in order to match approximately the observed hysteresis behavior. For arrays prepared under large pH a distribution within 3° around 68° of the c-axis orientations for different nanowires in array was assumed.
Table 1. The magnetic parameters of hcp Co used for simulation
| Saturation magnetisation, T | Exchange constant, J m-1 | Magnetocrystalline anisotropy, J m-3 | |
|---|---|---|---|
| hcp Co | 1.76 | 1.3 × 10⁻¹¹ | 4.5 × 10⁵ |
Table 2. The relative orientation of the c-axis in respect to the NW axis for the simulated nanowires as a function of the pH.
| pH | Angle between c-axis and nanowire's axis |
|---|---|
| 3.5 | 88° |
| 5.0 | 75°°± 2° |
| 6.0 | 68° ± 3° |
3. Results and discussion
3.1. On the crystalline structure
Figure 1(a) shows an SEM image of a cross section of an AAM with Co nanowires prepared under pH = 6.0 and having a diameter of D ∼ 40 nm determined by the pore size. The distance between wires is 105 nm, which is typical for the membranes anodized under oxalic acid.
Extensive structural characterization was done using XRD, TEM, selected area electron diffraction (SAED) and CBED.
Typical XRD patterns are shown in figures 1(b)–(d) for Co nanowires embedded inside the AAM and deposited at pH = 3.5 (b), 5.0 (c), and 6.0 (d). In all the cases the hcp crystal phase is identified, nevertheless significant differences in the crystal orientation are observed, indicating its strong dependence on the electrolyte's pH. For pH = 3.5 (figure 1(b)) the strongest peak of the diffraction pattern appears at 41.6°, so it is ascribed to the {100} reflection of hcp Co. For pH = 6.0 (figure 1(d)), the strongest peak is observed at 47.5°, which corresponds to {101} reflection. Finally, for the intermediate pH = 5.0, (figure 1(c)) both {100} and {101} peaks are visible. The presence of a strong peak {100} and a weaker one {2–10} on the XRD patterns of the NWs array prepared at the lower pH reveals that for the whole array the crystal planes {100} and {2–10} are mainly in-plane of the AAM. It indicates that the c-axis is mainly oriented perpendicular to the NW axis. The appearance of the {101} reflection with the increase of the electrolyte pH can be attributed to the reorientation of the c-axis towards the NW axis.
Interplay of the magnetocrystalline anisotropy (easy axis parallel to c-axis of hcp Co) and shape anisotropy (with easy axis parallel to the NW axis) plays a decisive role in determining the magnetic properties of the NW. Therefore we have studied subtle details of mutual orientation of these two axis in particular using TEM methods.
Figure 2 shows the TEM images of Co nanowires removed from the AAM and grown at: (a) pH 3.5, (b) pH 5.0, and (c) pH 6.0. The nanowires are nearly straight with a uniform diameter of about 40 nm and a smooth surface. The lattice parameter is very close to the standard value of hcp Co [32]. SAED patterns and high resolution transmission electron microscopy (HRTEM) images confirm the single-crystal structure and the dependence of the NW's direction on the electrolyte's pH value. In all cases several (up to 10) randomly selected NWs were studied for a given sample.

Figure 2. TEM images of Co NWs prepared under different electrolyte pH: (a) pH 3.5, (b) pH 5.0, (c) pH 6.0. The insets show the corresponding electron diffraction patterns and HRTEM images. The white arrows indicate the crystal orientation; the green arrows reflect the inclination of c-axis relative the NW's axis as estimated from diffractions.
Download figure:
Standard image High-resolution imageThe average c-axis direction of the studied nanowires prepared under pH 3.5 has an angle of 88° ± 1° in respect to the nanowire axis, as indicated in figure 2(a). The nanowires have monocrystalline structure with {100} growth surface in agreement with the XRD data on figure 1(b). When the electrolyte pH increases to 5.0, the nanowires still grow in a single crystal hcp phase but the average c-axis direction is 75° ± 2° in respect to nanowire axis (see figure 2(b)). The highest pH = 6.0 allows us to prepare the hcp single crystal Co nanowires with the average c-axis inclination of 68° ± 3° as indicated in figure 2(c).
To achieve a deeper insight into the reorientation of the growth direction of the Co nanowires, prepared under different pH, we have applied CBED, which is known to be very sensitive to minor changes in the crystal orientation.
Figure 3 shows a series of CBED patterns obtained at different positions along a nanowire prepared with a pH 3.5 (supplementary data, movie 1). The position of the Kikuchi lines does not change significantly as the probe is moved along the nanowires, indicating that the crystal orientation does not change significantly along NW length. As shown schematically in the inset of the figure 3, the (002) plane maintains the same orientation, i.e. c-axis stays almost perpendicular to the NW's axis. The estimated rotation of the crystal orientation is about 4°, which can be attributed to the bending of the wire on the TEM grid.

Figure 3. STEM image of a single crystal Co NW prepared under pH 3.5 and the series of CBED patterns taken at different positions along the NW (scanning direction shown by blue arrows, the position of the central beam is the red spot, and the numbers are the angles between the central beam and a 〈001〉 zone parallel to the direction of c-axis). The scheme shows the Kikuchi map corresponding to the CBED patterns. The dashed green lines on the CBED patterns correspond to the pair of the Kikuchi lines {1–21} shown on the scheme. The orientation of the (002) plane along the NW length is schematically shown.
Download figure:
Standard image High-resolution imageFor nanowires, prepared under larger pH, CBED analysis indicates that the crystal orientation changes along the nanowire. Figure 4 shows a series of the CBED patterns obtained at different positions along the nanowire prepared under pH 6.0 (supplementary data, movie 2). As shown schematically in the inset of figure 4, the (002) plane continuously rotates perpendicular to the NW's axis, keeping the angle between the c-axis and the NW's axis. The rotation angle of the crystal along the NW is about 40° over a length of about 3 μm. For nanowires, prepared under intermediate pH = 5.0, the change of the crystal orientation is determined to be about 15° on the same length. In short, it is observed that the crystal orientation of hcp Co rotates around the NW axis and the rate of this rotation increases with pH.

Figure 4. STEM image of a single crystal Co NW prepared under pH 6.0 and the series of CBED patterns taken at different positions along the NW (scanning direction shown by blue arrows, the position of the central beam is the red spot, and the numbers are the angles between central beam and a 〈001〉 zone parallel to the direction of c-axis). The scheme shows the Kikuchi map corresponding to the CBED patterns. The dashed green lines on the CBED patterns correspond to the pair of the Kikuchi lines {110} shown on the scheme. The orientation of the (002) plain along the NW length is schematically shown.
Download figure:
Standard image High-resolution imageThe origin of the rotation of the crystal may be related to the increase of the stacking faults density with the increase of the electrolyte pH. Figure 5(d) shows two typical stacking faults defects observed in a single crystal Co nanowire prepared under pH = 6.0. In Co with the crystal structure being close packed fcc or hcp the stacking faults are known to form relatively easily [33, 34]. Hexagonal planes can be packed either in an ...ABAB... sequence, yielding a hexagonal close-packed lattice structure, or in an ...ABCABC... sequence, yielding a face-centred cubic lattice structure. In the hcp structure, the stacking direction corresponds to the (002) axis of the lattice, whereas for the fcc structure, the stacking direction is parallel to the (111) axis of the lattice. In hcp lattice, a stacking fault is denied as an interruption in the ...ABAB... stacking of the hexagonal planes. Defects in figure 5 correspond to different stacking faults: (1) is in (002) plane while (2) is in one of the {101} planes. During the deposition, the Co atoms are easily attached to the step formed by stacking faults (1) which probably leads to the helical twist of the crystal around growth direction. The increase of the stacking faults density with increasing pH (figures 5(a)–(c)) results in the increase of the rotation rate along the NW length. The presence of the dislocations and correlation of their density with the electrolyte pH can be a simple yet powerful tool for manipulation of mechanical properties of the nanowires, in particular, a ductility of nanowires for nanoelectromechanical systems application.

Figure 5. The evolution of the defects density of Co nanowires prepared under different electrolyte pH (a) 3.5, (b) 5.0, (c) 6.0 visualized at [010] zone axis. (d) HRTEM image with higher magnification of the of the area with typical defects (stacking faults) as well as the area without stacking faults.
Download figure:
Standard image High-resolution imageOur HRTEM measurements also indicated the presence of an epitaxial cobalt oxide layer around single crystal nanowires. Partial oxidation of Co may occur at the surface of nanowires due to oxygen diffusion from the alumina or more likely during the process of its release from the membrane, facilitated by the high temperature and oxidation environment [35].
Figure 6 shows an HRTEM image of the epitaxial Co/CoO stack with hcp Co and fcc CoO lattice structures and the corresponding fast Fourier transform (FFT) patterns, which identify the [010] crystallographic zone axis of Co and the [110] zone axis of CoO. The epitaxial relationship in the interface is {002}Co||{111}CoO as shown schematically in the inset of figure 6. The epitaxial CoO layer is continuous and approximately 2 nm thick. It is known that the epitaxial system Co/CoO demonstrates an exchange bias phenomena [36, 37] which may be interesting for future applications of single crystal hcp Co nanowires.
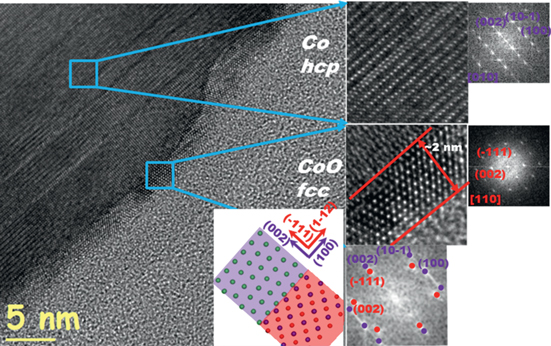
Figure 6. HRTEM images of the epitaxial Co/CoO stack and corresponding FFT patterns for a nanowire prepared under electrolyte pH 5.0.
Download figure:
Standard image High-resolution image3.2. Magnetic properties
As already mentioned, the magnetic properties of hcp Co nanowires should strongly depend on the c-axis orientation in respect to the nanowire axis. Therefore, the controlled synthesis of single crystal NWs with different c-axis orientation opens a new opportunity to manipulate the magnetic properties of Co nanowires without changing the NW geometry.
Figure 7 shows the hysteresis loops, under parallel (||) (applied magnetic field is parallel to the NW's axis) and perpendicular (⊥) (applied magnetic field is perpendicular to the NW's axis) field configurations, for the series of Co nanowire arrays prepared under different pH, while the values of coercivity and remanence are summarized in table 3.
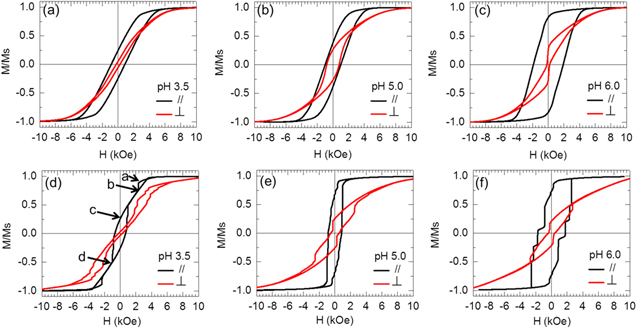
Figure 7. Normalized parallel (||) and perpendicular (⊥), M/Ms, hysteresis loops of Co nanowire arrays prepared under pH = 3.5, 5.0 and 6.0, (a)–(c) measured by VSM, (d)–(f) the results of the micromagnetic simulation.
Download figure:
Standard image High-resolution imageTable 3. Coercivity, Hc, and reduced remanence, Mr/Ms, for parallel (||) and perpendicular (⊥) field configurations.
| pH | Hc (Oe) (||) | Hc (Oe) (⊥) | Mr/Ms (||) | Mr/Ms (⊥) |
|---|---|---|---|---|
| 3.5 | 721 | 172 | 0.16 | 0.04 |
| 5.0 | 960 | 796 | 0.37 | 0.24 |
| 6.0 | 1960 | 130 | 0.87 | 0.28 |
A first qualitative analysis of the hysteresis loops confirms significantly different magnetic behavior for the samples grown under different pH conditions. In spite of the hcp crystal structure found in all cases, the difference in the orientation of the c-axis clearly plays an important role. The c-axis defines a uniaxial magnetocrystalline anisotropy that counter-balances or enhances the longitudinal shape anisotropy of nanowires depending on the inclination angle. In the case of the wires grown at pH = 3.5 the parallel hysteresis loop shows small remanence and coercivity, meaning that the magnetocrystalline anisotropy counter-balances the shape anisotropy (figure 7(a)). This can be related to the large angle (88°) between the c-axis and the nanowire axis, as deduced from the TEM images in figure 2(a). When the pH increases, both remanence and coercivity increase notably. In these cases, according to the structural data, the c-axis rotates toward the nanowire axis (figures 2(b), (c)), and the effect of the magnetocrystalline anisotropy contribution is not sufficient to overcome the shape anisotropy (figures 7(b), (c)).
In the case of the magnetic field applied perpendicular to the NW's axis the coercivity initially increases with electrolyte pH and then decreases for pH 6.0 up to an even lower value then at the lowest pH. It is related to the change of the reversal mode for the NWs with the highest pH which will be discussed later.
In order to obtain further information on the magnetization processes, micromagnetic simulations, using the Magpar software package [31] with finite element discretization, have been performed with the typical magnetic parameters of bulk hcp Co (table 1) and with geometrical and crystal parameters taken from the experiment. For details of the simulation see experimental section.
Figures 7(d)–(f) shows the hysteresis loops simulated for nanowire arrays with the magnetocrystalline anisotropy orientation corresponding to the wires prepared under different pH conditions. The simulated coercivity and remanence are very close to the experimental ones (figures 7(a)–(c)). The shapes of the loops resemble the experimental ones but have steps due to the finite number of nanowires in the simulation. Recently we have shown that the shapes of the loops become smoother when increasing the number of the nanowires in the simulated array [24].
Besides integral magnetization curves the micromagnetic simulations reveal nanoscopic details of the magnetization behavior of Co NW (supplementary movie 3). Figure 8 shows the magnetic structure of the NW's array in the ∥ field configuration in the case of pH 3.5 at different magnetic fields corresponding to the labels on the hysteresis loop presented in figure 7(d). After saturation in a magnetic field parallel to the NW's axis, and still at positive fields, the normalized magnetization of the array decreases with decreasing field due to the change of the local spin orientation at the NW ends (figure 8(a)) because in most of NWs an open vortex structure is formed at the end. In this structure the central spins are parallel to the NWS axis while the shell spins rotate toward the in-plane direction. Furthermore, the demagnetization proceeds by rotation of all outer spins towards the in-plane direction and at the remanence the vortices structure spans the whole nanowire length (figure 8(b)). Note that the spins in the vortex shell at the remanence do not lay exactly in-plane of the NW diameter. Instead, there is a small component of the magnetization parallel to the NW's axis, the magnitude of which is determined by the c-axis inclination in respect to the NW axis. The polarity of the vortices is the same for all nanowires in the array and coincides with the direction of the applied magnetic field while the chirality could be different. At the remanence (figure 8(c)) the local spin configuration in the proximity to the NW ends may consist of either the vortex structure or spins aligned in-plane of the NW diameter. These structures extend over a length of tens of nanometers from the ends due to the decreased magnetostatic fields and the dominant character of the in-plane magnetocrystalline anisotropy close to the NW's ends. Under increasing of the magnetic field in the opposite direction the core of the vortex switches first (figure 8(d)) and then the spins of the vortex shell rotate towards to the applied field direction.
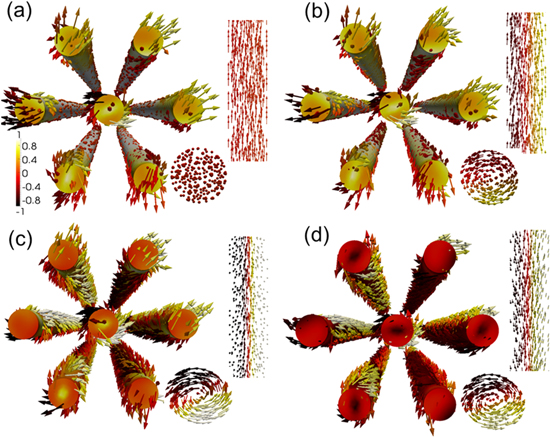
Figure 8. Simulated magnetic reversal after saturation in a magnetic field parallel to the NW's axis for array of seven nanowires with parameters corresponding to the one prepared under pH 3.5. (a)–(d) correspond to applied field values from figure 7(d). The color of the bulk corresponds to the Mz component of magnetization (parallel to the NW's axis), and the color of the arrows corresponds to the Mx component (in-plane of the NW's diameter). In inserts the magnetization configuration for the cross-sections in the middle of the NW along the NW length (up) and in-plane of the NW's diameter (down) are shown.
Download figure:
Standard image High-resolution imageIn case of the highest pH 6.0 NWs the remanence state for the ∥ configuration is mostly represented by a single domain state with the magnetization parallel to the NW axis. However, there are a small number of the NWs which show a vortex state at remanence with a significant magnetization component parallel to the NW axis. Note that for this angle (67°) between the c-axis and the NW axis both magnetic states can co-exist according to the state diagram which can be found in [29]. In the case of the almost single domain nanowires at the remanent state the magnetization reversal occurs through vortex domain wall (VDW) nucleation and propagation. Consequently, the change of the character of the hysteresis process as a function of pH is related to the change in the reversal mode from the situation in the array where most of NWs demagnetize through vortex formation along the whole length and rotation of the outer spins to the situation where most of the nanowires are in the single domain state at the remanence and demagnetize through VDW propagation.
After saturation in a magnetic field perpendicular to the nanowire axis, the remanent states consist of the vortices for the simulations corresponding to pH 3.5 and 5.0 grown wires. Contrary to the saturation along the wires, in this case the polarities of the vortices are randomly distributed over the nanowires in the array. During the demagnetization process in the perpendicular field the vortex core moves to the NW edge (for vortices with different chiralities - to opposite edges), and then spins align parallel to the field direction. The remanence of the NWs corresponding to the ones prepared with the highest pH 6.0 is mostly represented by a single domain state with the magnetization oriented parallel to the NW axis. Some of the NWs in the array show a vortex state with a significant component parallel to the NW's axis. Those are the NWs with the c-axis having the largest angle in respect to the NW axis. The reversal part of the hysteresis corresponds to a rotation of the magnetization in the outer shell towards the field direction. The jump on the magnetic loop (experimental, figure 7(c) and simulated, figure 7(f)) corresponds to the vortices formation (figure 8(b)).
Finally, the angular dependence of coercivity and remanence has been experimentally determined by VSM magnetometer from magnetic loops obtained at different angles between the applied magnetic field and the NW's axis (see figures 9(a), (b)). The corresponding micromagnetic simulation data are shown in figures 9(c), (d), where the respective orientation of the hcp Co easy axis for NWs prepared under different pH has been taken into account. The angular trends measured experimentally and extracted from micromagnetic simulation show similar behavior with the change of the pH. The difference in the shape of the trends, especially for angular dependencies of the coercivity, can be attributed to the small amount the NW's in simulated array in comparison with array measured by VSM [24].

Figure 9. Angular dependence of the coercivity, Hc, (a), (c) and reduced remanence, Mr/Ms, (b), (d) for samples grown under different pH conditions as measured by VSM (a), (b) and simulated (c), (d).
Download figure:
Standard image High-resolution image
We should underline the different angular trends for NWs array prepared under the highest pH, which can be also attributed to the reversal mechanism of the magnetization for NW's array prepared under different pH. The simulational tendencies are in a very good agreement with the experimental ones. We did not observe any change in the magnetization reversal mode as a function of the applied field angle except for the NWs with the highest pH and the field applied exactly perpendicular to the NW axis where the reversal mode is changed from VDW to quasi-coherent rotation. More details on the micromagnetic study of different reversal modes in single crystal nanowires can be found elsewhere [29].
4. Conclusions
The following general conclusions can be extracted from the present study of 40 nm diameter electrodeposited Co nanowire arrays:
- (i)Template-assisted electrodeposition of Co results in monocrystalline NWs of uniform thickness, hcp structure and unique crystal orientation in respect to NW axis. This is confirmed by XRD, HRTEM and CBED studies.
- (ii)Alteration of the electrolyte pH during the NWs growth leads to the substantial changes of stacking faults density in grown NWs and as a result to a controllable variation of c-axis inclination in respect to NW axis. This is confirmed by XRD, TEM and electron diffraction data. As the other consequence of the increasing stacking faults density the crystal structure is twisted around growth direction as determined by CBED.
- (iii)The magnetics properties of monocrystalline Co NWs are determined by the interplay of magnetocrystalline and shape anisotropies. Thus control of the orientation of the c-axis (which is a crystallographic easy axis of hcp Co) provides control over magnetic properties of NW arrays. This is confirmed by hysteresis loops measurements.
- (iv)Micromagnetic simulations are in agreement with experimental VSM measurements. They confirm the key contribution of magnetocrystalline anisotropy to magnetic properties of NWs. From the simulation results, insight can be obtained into the magnetic reversal modes for 40 nm diameter nanowires prepared under different pH. If the c-axis has an angle with nanowire axis of more than 75° (pH ≤ 5.0), the magnetization reverses by a quasi-curling reversal mode forming the vortices along the whole nanowire length at the remanence [38]. For nanowires with the c-axis oriented at smaller angles, the reversal mode consisting in the VDW propagation is deduced from the simulations. Thus, a change of the c-axis orientation by 15° towards the direction of the nanowire's axis, induced by the increase of the pH, causes a transition of the reversal mode from quasi-curling to the VDW propagation.
- (v)In short, the controlled electrodeposition of Co nanowires through tuned electrolyte pH opens new opportunities to grow NWs with specific magnetic properties as derived from the corresponding crystal symmetry characteristics.
Acknowledgments
Financial support from the Spanish Ministry of Science and Innovation, MCINN, under Project No. MAT2010-20798-C05-01 and FIS2010-20979-C02-02 is acknowledged, as well as of the Far Eastern Federal University. A Chuvilin acknowledges the financial support from the Basque Government within the projects CTP11-P14 and Etortek IE11-304. Yu P Ivanov thanks the financial support provided by SABIC. Thanks are due also to C Checa and A Valera for assistance in the SEM characterization.