


Abstract
This paper describes a technique for quantitatively measuring the time-averaged skin friction distribution on a wind tunnel test model. The technique is a hybrid oil film approach that is based on the combination of the qualitative skin friction distribution obtained from luminescent oil film and the quantitative local skin friction measurements obtained from oil film interferometry in another blowing of the same flow condition. To demonstrate its validity, the proposed method was applied to the flow field around a vortex generator on a flat plate, and successfully measured the quantitative skin friction distribution.
Export citation and abstract BibTeX RIS
1. Introduction
Drag reduction is an important technology for aircraft design due to increasing environmental awareness and the depletion of fossil fuel sources. Achieving large drag reduction requires control of each drag factor: profile drag, induced drag and wave drag. Profile drag accounts for the greatest proportion of the total drag on a conventional civil aircraft, and skin friction is the main component of profile drag [1]. Thus, reducing skin friction is one of the most effective ways to reduce drag.
If a technique quantitatively measures the skin friction distribution over an aircraft's surface, it could identify regions of high skin friction to target with detailed flow field diagnosis, leading to improvements in the aircraft's design.
Oil film is widely used for observing the flow field on a wind tunnel test model's surface. There are two oil film approaches to measuring the skin friction on a wind tunnel test model's surface. One is luminescent oil film and another is oil film interferometry. They both use an oil film, but use different methods of determining the skin friction from the image data. The luminescent oil film is an optical skin friction measurement method whereby a small amount of fluorescence dye is added to oil to cause it to emit luminescence. The skin friction distribution is obtained by observing the movement and thickness of the luminescent oil film [2, 3]. The luminescent oil film has the merit that it can be used with complex flow fields, but the drawback that it is a qualitative measurement of skin friction. Oil film interferometry is another widely used optical skin friction measurement method in which a small amount of oil applied to a test model's surface spreads with the airflow in the wind tunnel to form a thin film [4–9]. Localized quantitative measurements of skin friction are obtained by observing changes in the thickness of the oil film. Oil film interferometry has the merit of providing quantitative measurements of skin friction, but its drawback is that it is a point measurement of skin friction.
This paper proposes a measurement method that combines these two oil film techniques to obtain quantitative skin friction measurements over a model surface. The method is applied to a vortex generator to investigate applicability to complex flow. A vortex generator is a widely used aerodynamic device that suppresses flow separation by mixing the outer and inner flows of the boundary layer, but results in vortices that increase skin friction over a large region [10].
2. Measurement method and experimental setup
2.1. Measurement method
Figure 1 shows an outline of the method for measuring quantitative skin friction distribution. A luminescent oil film is used to qualitatively measure the skin friction distribution on a test model, while oil film interferometry gives localized quantitative skin friction. This study combines the merits of these two measurement techniques to measure quantitative skin friction distribution.
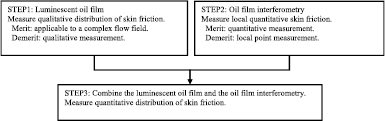
Figure 1. Outline of the quantitative measurement of skin friction distribution.
Download figure:
Standard image High-resolution image2.2. Wind tunnel
This study used a low-speed wind tunnel with a 304 × 304 mm test section. The wind tunnel was the closed-loop type. The possible wind speed was up to 41 m s−1; this study used 31 m s−1. The test section was enclosed in a darkroom to reduce extraneous light that could affect optical measurements.
2.3. Test model
The test model in figure 2 was a 10 mm thick aluminum alloy flat plate measuring 304 mm in width by 800 mm in length. The leading edge had a hemispherical cross-section and the leading edge surface had roughness to promote transition to a turbulent boundary layer over the flat plate surface. The test model was mounted between two black-painted sidewalls of the wind tunnel test section.

Figure 2. Flat plate model with a vortex generator.
Download figure:
Standard image High-resolution imageA vortex generator 15 mm in height, 60 mm in length and 0.3 mm in thickness was fixed to the upper surface at 370 mm from the leading edge and at an angle of 20° to the main stream of the wind tunnel. The Reynolds number was Rex = 7.8 × 10⁵ in length from the leading edge of the model to the location of the vortex generator. The shape factor (H12 = displacement thickness/momentum thickness) of the boundary layer was about 1.3 [8].
2.4. Luminescent oil film
The oil used for the luminescent oil film was a transparent silicon oil of 200 mm2 s−1 (cs) kinematic viscosity (Shin-Etsu Chemical Co. KF-96-200cs), to which a small amount of fluorescence ink was added to cause luminescence. The oil with the ink emits luminescence with a peak wavelength of 542 nm by blue incident light. The oil was applied onto the test model surface in a thin layer. It is important to use a thin layer of oil to ensure a linear relationship between the oil thickness and the intensity of luminescence. A small amount of oil was applied to the surface of the test model using a pipette and then spread into a thin layer by tapping using a sponge.
Figure 3(a) shows the optical measurement system used to measure the luminescence of the oil film. The measurement system consisted of a light source and a camera. The light source was a blue LED array that emitted light with a center wavelength of 470 nm, which excited the fluorescence dye in the oil. The light being in the visible spectrum rather than ultraviolet made the measurement system easy to use. The camera was a monochrome Prosilica GX6600 model with a charge-coupled device sensor of 6576 × 4384 pixels. Although this camera has a large number of pixels, binning of 4 pixels was used to increase the frame rate. The camera captured 8 bits per pixel at 10 fps. The 50 mm focal length lens was set to an aperture of f 5.6, and was equipped with a 530 nm low-pass filter within 10 nm half max and a 750 nm long cut filter to exclude light apart from that emitted by oil luminescence, and so reduce measurement noise. The upper surface of the test model was covered with a thin white resin sheet in order to enhance the luminescent intensity of the oil.
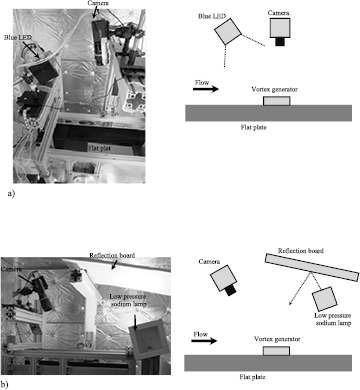
Figure 3. Measurement system. (a) Luminescent oil film. (b) Oil film interferometry.
Download figure:
Standard image High-resolution imageThe relationship between oil thickness and luminescent intensity was measured using the apparatus shown in figure 4 [3]. A 30 mm × 30 mm flat glass plate was placed on a flat acrylic plate covered with a white sheet of the same material as that used in the wind tunnel measurement of the test model. A razor of 0.1 mm thickness was sandwiched between the glass and acrylic plates at an edge. Luminescent oil was introduced into the gap between the glass flat plate and the acrylic flat plate, which were then bound together by adhesive tape, to create a wedge-shaped oil layer in the gap with a precisely controlled, smoothly varying thickness. The relationship between oil layer thickness and luminescent intensity was then measured using the same optical measurement system shown in figure 3(a).
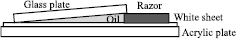
Figure 4. Measurement of relationship between oil thickness and luminescent intensity.
Download figure:
Standard image High-resolution image2.5. Oil film interferometry
The oil used for the oil film interferometry was a transparent silicon oil of 50 mm2 s−1 (cs) kinematic viscosity (Shin-Etsu Chemical Co. KF-96-50cs). The oil layer must be very thin in order to show a fringe pattern. A small amount of oil was applied to the test model surface using a small scraper.
Figure 3(b) shows the optical measurement system used for the oil film interferometry. The measurement system consists of a light source and a camera. The light source was a low-pressure sodium vapor lamp with a center wavelength of about 590 nm. A reflector board was set in order to uniformly illuminate the wide area of the flat plate [5]. The camera was the same model as that used in the luminescent oil film measurement system. A large number of pixels results in better accuracy for oil film interferometry because distances in the fringe pattern are measured directly from images, so binning was not used in the oil film interferometry. The camera captured pixels at 14 bits per pixel since a high frame rate is not necessary for oil film interferometry. The 105 mm focal length lens was set to an aperture setting of f 11, was fitted with a lens spacer ring, and had a 590 nm band pass filter in order to reduce noise.
Because it is difficult to obtain efficient reflections from the naturally oxidized surface of aluminum alloys, the upper side of the test model had a thin kapton sheet applied in order to enhance the reflection of the low-pressure sodium vapor lamp on the model surface.
2.6. Conventional oil film
A conventional oil film was used to visualize to the flow around the vortex generator in order to validate the method proposed in this study. First, a small amount of titanium dioxide was kneaded into a drop of oleic acid, and then mixed into silicon oil with 10 mm2 s−1 (cs) kinematic viscosity (Shin-Etsu Chemical Co. KF-96-10cs). The painting method was same as that used for the luminescent oil film, using a pipette and a sponge.
The upper side of test model had a thin black resin sheet applied in order to increase the contrast with the white titanium dioxide.
2.7. Data processing method for luminescent oil film
This study measured the movement of oil on a model surface using optical flow, which detects moving objects from successive image frames [2, 3, 11].
This study used the following assumptions, which are shown in figure 5. Assumptions (a)–(i) are for the oil film method and the measurement setup. On the other hand, assumptions (j)–(m) are for the optical flow.
- (a)The oil has a slow viscous flow.
- (b)The oil layer on the model surface is of low thickness.
- (c)The surface frictions of both the oil layer and the air flow at the contact boundary are the same.
- (d)The oil directly in contact with the model surface is stationary; thus, a shear is set up in the oil layer between the static oil in contact with the surface and the moving oil in contact with the air flow.
- (e)The velocities of both the oil layer and the air flow at the contact boundary are the same.
- (f)The speed at which the oil layer flows over the model surface, caused by friction with the air flow, is proportional to the thickness of the oil layer.
- (g)The measured velocity of the oil is the average velocity of the oil layer.
- (h)The luminescent intensity of the oil is proportional to the thickness of the oil layer.
- (i)The oil is illuminated by an illuminator which is spatially and temporally unchanging.
- (j)The luminescent intensity of a measurement point in an image frame is the same as the luminescent intensity at a different location in a successive image frame.
- (k)The velocities of observed points at each location in the image change smoothly.
- (l)The camera is set parallel to the model surface.
- (m)The relative positions of the model, the light source and the camera do not change.

Figure 5. Test model surface with the oil in the luminescent oil film.
Download figure:
Standard image High-resolution imageThe skin friction is proportional to the velocity gradient, equations (1) and (2), in which τx x,y and τy x,y are respectively the components of skin friction in the x and y directions at the location of a pixel (x, y) in an image. The ux,y and vx,y are respectively the components of the oil flow velocity of the optical flow in the x and y directions at (x, y), zx,y is the thickness of the oil layer at (x, y) and µ is the coefficient of viscosity of the oil.
First, the velocity components ux,y and vx,y of the oil flow in the optical flow are obtained at locations (x, y). Equation (3) is derived from assumption (j) in the optical flow:

where Ix and Iy are partial derivatives of luminescence intensity in the x and y directions respectively, and It is the partial derivative of luminescence intensity with time. The components of the velocity vector u =  and
and  are values to be obtained from the optical flow. The optical flow is calculated by using a conventional method described in the appendix. Although it would seem difficult to strictly maintain assumption (j) with the oil film, in this study it is considered that approximate values are able to be measured by setting a sufficiently high camera frame rate to capture the movement of the oil. All pairs of images acquired during the measurement were calculated in order to obtain velocities
  and
and  at each location (x, y) in the image and then those velocity values were finally averaged to reduce measurement noise.
Then, the thickness of the oil layer is measured using the luminescent intensity of the oil. The oil thickness is expressed in equation (4) derived from assumptions (h) and (i); that is, the luminescent intensity indicates the thickness of the oil layer [2]:

where Ix,y is the luminescent intensity of the oil at location (x, y), Iex is the intensity of the blue LED light source, and a is a coefficient of the fluorescence dye. Because the constants in equation (4), a and Iex, were set to unity in this study, the luminescent oil film data are qualitatively relative data. Thus reference quantitative data, for example by oil film interferometry, are necessary to convert the luminescent oil film data into quantitative data. zx,y is the thickness of the oil layer at location (x, y) in the image.
Finally, the qualitative skin friction distribution is obtained from equations (1) and (2) from the measured values of ux,y, vx,y and zx,y (=Ix,y). The coefficient of viscosity of the luminescent oil µ is set to 1 in the luminescent oil film measurement.
The processed data are image frames captured by the camera from the time when the flow attains a steady velocity to the time when sufficient oil remains around the vortex generator. About 250 images were processed in the luminescent oil film measurement.
2.8. Data processing method for oil film interferometry
The thickness of the oil layer applied to the model surface decreases with time as the oil is spread by skin friction with the air flow. Skin friction can be measured by this phenomenon, and is calculated from equation (5) [5, 6].
Cf is the skin friction coefficient, τ is the skin friction and q∞ is the dynamic pressure of the main air flow in the wind tunnel. n0 is the refractive index of the oil, λ is the wavelength of the light emitted by the light source, θr is the angle of refraction, and Δs is a distance in the fringe pattern. n and n + 1 are image numbers that correspond to the increase of Δs with time t.
The coefficient of viscosity of the oil µ changes with the temperature of the oil [5, 8]. In this study, the oil was assumed to be at the same temperature as the main air flow in the wind tunnel, and the coefficient of viscosity of the oil was corrected accordingly by using the catalog specification of the oil.
2.9. Matching locations between the luminescent oil film and the oil film interferometry
The locations around the vortex generator (X, Y, Z) are measured using a scale in the oil film interferometry, whereas the location of the luminescent oil film in the image (x, y) is determined by using direct linear transformation as shown in equations (6) and (7).
Coefficients from L1 to the L11 are calibrated by the least squares method using target markers that have known locations on the model.
3. Results and discussion
3.1. Visualization of flow field on the flat plate by the luminescent oil film
Figure 6 shows visualization data on the flat plate without the vortex generator by the luminescent oil film. Although there are some small curves, the line flows smoothly from the upstream to the downstream, so that it indicates the validity of the luminescent oil film.

Figure 6. Flow field on the flat plate measured by the luminescent oil film.
Download figure:
Standard image High-resolution image3.2. Conventional oil film around vortex generator
Figure 7 shows a photograph of the flow around the vortex generator visualized using a conventional oil film to compare qualitatively with the luminescent oil film method. The following characteristics are observed.
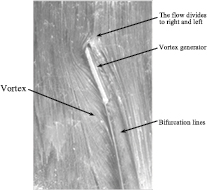
Figure 7. Visualization of flow around vortex generator using conventional oil film.
Download figure:
Standard image High-resolution imageFirst, the flow divides to right and left at the right upper stream of the vortex generator. Second, bifurcation lines are observed on the downstream side of the vortex generator. Third, on the left side of the vortex generator, a flow from the leading edge impinges on the left sidewall of the vortex generator, resulting in the generation of a large counterclockwise vortex.
3.3. Oil thickness and luminescent intensity of the luminescent oil film
Figure 8 shows the thickness and luminescent intensity of the oil containing fluorescence dye. An image bit depth of 14 bits was used in this case for a more detailed analysis. Although the thickness versus luminescent intensity graph has a gentle curve, the relationship is approximately linear for thicknesses less than about 40 µm. Thus, an oil film thickness of less than 40 µm was used in this study, which was not difficult to establish on the model surface by using a sponge and checking the luminescent intensity in images. It was too difficult to measure luminescent intensity at near thickness 0 because the luminescent oil exuded from the edge of the glass plate.

Figure 8. Relationship between oil thickness and luminescent intensity.
Download figure:
Standard image High-resolution image3.4. Measurement of skin friction distribution
The quantitative skin friction distribution was derived by combining the qualitative skin friction distribution obtained from the luminescent oil film and the quantitative local skin friction measurements obtained from the oil film interferometry.
First, the luminescent oil film was applied to the flow field around the vortex generator.
Next, quantitative skin friction data at some locations around the vortex generator were measured by oil film interferometry. Figure 9 shows an image of oil film interferometry around the vortex generator.
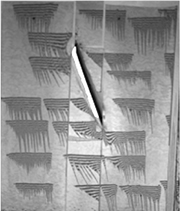
Figure 9. Oil film interferometry around the vortex generator.
Download figure:
Standard image High-resolution imageFigure 10 shows the relationship between values obtained using the luminescent oil film and skin friction coefficients obtained by oil film interferometry at locations around the vortex generator. Although the relationship has some dispersion, there is clearly a strong positive correlation. A calibration formula was therefore obtained using a linear approximation.
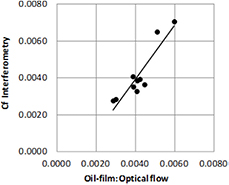
Figure 10. Relationship between values obtained by the luminescent oil film and the oil film interferometry.
Download figure:
Standard image High-resolution imageFinally, the qualitative skin friction distribution using the luminescent oil film was converted to quantitative data using the calibration formula obtained from figure 10.
The quantitative skin friction distribution is shown in figure 11. A region of high skin friction is observed at the left side of the vortex generator leading edge. This is because the flow is accelerated in this region. Moreover, there is a large region of high skin friction downstream of the vortex generator. This is because the vortex inducts fast flow from the outside of the boundary layer to the model surface. The high skin friction regions are observed similarly in figure 9 showing the large distances in the fringe pattern.

Figure 11. Skin friction distribution.
Download figure:
Standard image High-resolution image
Figure 11 also shows the flow directions on the model surface. First, the flow divides right and left upstream to the right of the vortex generator. Second, bifurcation lines are observed on the downstream side of the vortex generator. Third, on the left side of the vortex generator, a flow from the vortex generator leading edge impinges the left sidewall of the vortex generator, and then a large counterclockwise vortex is generated. These flow pattern characteristics closely resemble those of the conventional oil film in figure 7.
The dots in figure 11 are noise due to particles of dust that settled on the oil surface during testing. This dust noise is a drawback of the proposed technique.
The proposed measurement method has an advantage in that one look at the data clearly shows regions of high skin friction. Also, since each pixel in the image data has an associated vector for the skin friction, the proposed method is able to be applied to complex flow fields. Moreover, the proposed method gives quantitative data on the direction of the flow, which is in significant contrast to the conventional oil flow visualization. These merits indicate that the proposed method will be useful in aircraft design, flow field diagnosis and the validation of computation fluid dynamics.
4. Conclusion
This paper has discussed a method for the quantitative measurement of skin friction distribution. A wind tunnel experiment looking at the complex flow field around a vortex generator indicated the effectiveness of the proposed method. A merit of the proposed method is that regions of high skin friction can be identified from the data at a glance. Moreover, the proposed method is applicable to complex flow fields, and gives quantitative data on flow direction, which is a large effective difference from conventional oil flow visualization.
Acknowledgments
The authors thank Dr Henny Bottini for his technical support of this study. We also thank Professor Keisuke Asai of Tohoku University for his advice on this study. We thank Dr Shigeru Hamamoto, Mr Shigeya Watanabe, Mr Kazuyuki Nakakita, Dr Shunsuke Koike, Dr Kazunori Mitsuo and all the members of the Aerodynamics Research Unit of JAXA for their support of this study.
: Appendix
In this study, the optical flow is obtained by minimizing C in equation (A.1) as a conventional method.
The velocities of the optical flow are obtained by the following equations.
The velocity components of the oil  and
and  at location (x, y) are calculated by using an asymptotic method. k is the iteration number. In this study the initial values were
  and
and  , and the weight coefficient was W = 1.