


Abstract
A transient spark micro-discharge in nitrogen is investigated between two sharpened electrodes at a pressure of 0.5 bar. The plasma parameters (gas temperature, electron density and reduced electric field) are determined using optical emission spectroscopy (OES) and numerical simulations. The gas temperature of 3500 ± 100 K is determined by the comparison of the measured and simulated rotational distributions of the photoemission spectra of neutral molecular nitrogen N2(C-B,0–0). Both direct and stepwise electron impact excitation are considered in the collision-radiative model. The rate constants for electron impact excitation processes are calculated for different electric field values using the electron velocity distribution function, which is simulated by solving the Boltzmann equation. The applied broadband echelle spectrometer is absolutely calibrated in a spectral range of 200 nm to 800 nm, using two standard light sources, a deuterium lamp and a tungsten ribbon lamp, which are certificated by the Physikalisch-Technische Bundesanstalt (PTB), Germany. With the aid of this absolutely calibrated echelle spectrometer and a microwave atmospheric plasma source operated in a nitrogen flow, the intensified charge-coupled device (ICCD) camera, provided with an in-house made optical arrangement for simultaneous two-wavelength diagnostic is calibrated. The spatial resolution of this diagnostic system under the studied plasma conditions amounts to 13 µm. The accurate examination of the experimental results allows determining the dominant process of electron impact excitation of molecular nitrogen ion from ionic ground state. Applying the chosen excitation model of the nitrogen photoemission, the spatially resolved reduced electric field and the electron density are determined. This is done by using the inverse Abel transformation of the absolute intensities of molecular nitrogen bands N2(C-B,0–0) and  (B-X,0–0), which were measured with the calibrated ICCD camera. The measured electric current of the micro-discharge is compared with the calculated one using the measured plasma parameters and a good coincidence is established.
Export citation and abstract BibTeX RIS

Original content from this work may be used under the terms of the Creative Commons Attribution 4.0 license. Any further distribution of this work must maintain attribution to the author(s) and the title of the work, journal citation and DOI.
1. Introduction
Transient spark micro-discharges under elevated pressure have a wide range of applications, e.g. as ignition spark in Otto engines or gas heaters. Due to the temporal spatial instability and the small electrode gap (0.7 mm in our case), these plasma objects are challenging to characterize. The position of the active plasma volume, where the current carrying and light emitting, is usually not fixed and the ignition process (start of current rise) varies stochastically due to several non-controllable parameters like gas temperature and density of seed electrons. The characterization of the plasma conditions, namely the determination of the gas temperature, electron density and reduced electric field, provides necessary information for an effective and safe operation of these plasma sources in various applications. The gas temperature is usually determined spectroscopically assuming steady state conditions using the rotational distribution of the emission spectra of diatomic molecules or Doppler broadening of absorption and emission atomic lines [1–3].
Low pressure diagnostic methods, namely electric [4, 5] or multipole resonance [6, 7] probes measurements cannot be used for the characterization of spark micro-discharges at elevated gas pressure due to the small dimension of the active plasma volume (smaller than 1 mm in every direction) and too high electron and gas densities. Ab initio numerical simulation of discharges under elevated pressure conditions usually apply some assumptions [8], which must be validated by comparison with experimental results. Optical emission spectroscopy (OES) diagnostics, which uses the emission spectra of a test gas for the determination of the electron distribution function in a low pressure regime [9, 10] also cannot be applied for the characterization of these spark micro-discharges because the number of appropriate emission transitions under elevated pressure conditions is limited. Furthermore, the electron distribution functions differ significantly from Maxwellian ones.
However, a combination of numerical simulation and OES methods provide reliable plasma parameters and can be applied for the characterization of the plasma conditions in micro-discharges at elevated pressure [11–15]. The calculation of the emission excitation by electron impact of the nitrogen ground state N2(X) in air plasmas applying a parametric presentation of the emission band intensity ratio in dependence of the reduced electric field was used in [13, 14]. The electron distribution function was simulated in [11, 12, 15] for different electric field values by numerically solving the Boltzmann equation. Nitrogen was used as test gas which intensities of photoemission were calculated in the frame of chosen collisional-radiative model and compared with measured ones. In a fitting procedure the reduced electric field, the rate constants for electron impact excitation and the electron density were determined.
Under both low and elevated pressure conditions, OES diagnostics, which uses nitrogen molecular emission, can be applied [11, 12, 16]. A division of plasma conditions into low and elevated pressure is relative. In respect to OES diagnostics based on nitrogen molecular emission, this division is determined by the necessity to consider collisional quenching of the studied photoemission. From this point of view the low and elevated pressure for nitrogen OES diagnostics can be separated at approximately 10 mbar. To apply the OES diagnostics for the plasma characterization at elevated pressure, several requirements have to be fulfilled: the reliability of the applied excitation scheme, the accuracy of the cross sections of important electron impact excitation processes, sufficient probability of spontaneous photoemission and well-known but not very high rate constants of collisional quenching of excited species. Based on the extensive measurements of the last decade, nitrogen fulfills these strong requirements. The molecular nitrogen emission spectrum under elevated pressure conditions mainly consists of two electronic systems: N2(C-B) (second positive system) and  (B-X) (first negative system) with very different energy of the upper states, namely 11.05 eV and 18.74 eV. Because of this large difference, the nitrogen emission spectrum is very sensitive to variations of the electron energy distribution function in nitrogen-contained plasmas and therefore both emission transitions are included in the applied collision-radiative model for OES diagnostics. The electron density can be determined using the measured absolute intensity of the photoemission and the calculated electron impact excitation rate constants. This diagnostic method usually delivers spatial averaged plasma parameters due to low spatial resolution (several millimeters) of the most commonly applied spectrometers. Using a calibrated intensified charge-coupled device (ICCD) camera, the spatial resolution of OES characterization can be drastically increased. This method was applied to determine the plasma parameters in HF [17] and AC [18] discharges. The spatial distribution of the photoemissions of two different nitrogen emission bands was recorded in these experiments using two different interference filters consecutively. Thus, the method only delivers reliable results if the spatial distributions of the plasma parameters are invariable (in space and time) or are well repeatable. Consequently, micro-discharges, with spatially and temporally stochastic behavior, cannot be characterized using this diagnostic method based on consecutive measurements of photoemission of two nitrogen emission bands.
To solve this problem and to characterize transient micro-discharges, an optical arrangement to measure spatially resolved intensity distributions of two nitrogen emission bands separately but simultaneously is presented. Therefore, a two-wavelength filtered image of the micro-discharge is focused simultaneously on two separate parts of the CCD chip. These measured intensities are compared with those numerically simulated from the chosen collisional-radiative model. In order to validate the applied diagnostic method, the current density and the total current are calculated using the determined plasma parameters and compared with the measured ones.
2. Applied methodology and experimental setup
2.1. Applied diagnostics method
The emission spectrum of nitrogen under elevated pressure conditions consists of two intensive emission systems N2(C-B) and  (B-X). As was mentioned before, the upper states of this emission bands exhibit considerably different energy resulting in a very sensitive intensity behavior for variable electron energy distribution function. The cross sections for electron impact excitation of excited states of nitrogen are well known [19–21]. Thus, nitrogen is often applied as a test gas for OES characterizations of low and atmospheric pressure plasmas [16, 18, 22].
The scheme of energetic levels and electron impact excitation transitions, which are applicable for this OES diagnostic in an active nitrogen plasma, are presented in figure 1. Under elevated pressure conditions, the molecular emission N2(C-B) and  (B-X) can be excited by direct electron impact of the nitrogen ground state N2(X) or stepwise [2] via the nitrogen metastable N2(A) and the ground state of nitrogen ions
  (X). The latter process is conditionally stepwise excitation, only in respect to neutral nitrogen, and used here on a purpose of commonality, because both above mentioned stepwise excitations (N2(X)→N2(A)→N2(C) and N2(X)→
 (X)→
(X)→ (B)) are relevant under similar conditions, namely at high electron density and low electric field. In general, the N2(C) state can also be excited in an 'energy pooling reaction' equation (1) with a rate constant of kpooling = 3 × 10⁻¹⁰ cm3 s−1 [23]:


Figure 1. Collision-radiative model of the nitrogen molecule with electron impact excitations (solid arrows) and spontaneous emission (dashed arrows). The denominations of the rate constants of the electron impact excitations are presented near the corresponding arrows.
Download figure:
Standard image High-resolution imageIn contrast to the afterglow phase [24], the intensity of N2(C-B), excited by reaction (1) in the active plasma volume, is usually much lower than the emission excited by electron impact excitation because of the relatively low density of metastable nitrogen. For this reason, we neglect this excitation process. Moreover, the vibrational distribution of N2(C) state produced in the pooling reaction differs significantly from the vibrational distribution which is characteristic of electron impact excitation, and can be easily distinguished [25].
The densities of excited molecular states which are presented in following equations in square brackets and the intensities  and
and  (in photon cm − 3 s−1) of the N2(C-B,0–0) and
  (B-X,0–0) emissions at steady-state plasma conditions can be calculated using equations (2)–(7) in the frame of the electron impact excitation model presented graphically in figure 1. The steady-state density of metastable state N2(A) (cf. equation (2)) is determined applying the respective rate equation.
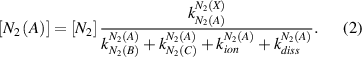
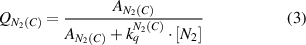
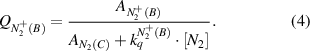
Top and sub-indices of the rate constants in equations (2)–(7) represent the molecular states before and after electron impact excitation, respectively. Under elevated plasma conditions, collisional quenching of the excited states influences the intensities of photoemission. The quenching factors,  and
and  , are calculated in equations (3), (4) using the known Einstein coefficients
  ,
,  of the respective emission transitions, N2(C-B) and
  (B-X), and the rate constants of the collisional quenching by nitrogen molecules,
  and
and  , from [26]. The influence of the elevated gas temperature in our spark micro-discharge on the efficiency of the quenching process is considered by substituting the rate constants for the collisional induced deactivation of electronically excited nitrogen states in Arrhenius form:
Both direct and stepwise electron impact excitation are considered separately by the calculation of the nitrogen molecular emissions (cf. equation (5)):
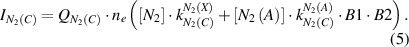
Here, ne is the electron density, and factor B1 = 0.5 represents the relative population of the vibrational level v' = 0 of N2(C) by electron impact excitation of the N2(A) state, which was estimated in [12]. Factor B2 = 0.5 [27] is the branching fraction of the Einstein coefficient of the N2(C-B,0–0) transition with respect to the total probability of photoemission from level N2(C,v' = 0). The rate constants, which are used for the calculation of the intensities of the molecular nitrogen emission (cf. equations (6) and (7)), are determined using the known cross sections of electron impact excitations (σexc) [19–21] and the electron velocity distribution function evaluated by the procedure discussed below:
Under elevated pressure conditions, the electron distribution functions differ strongly from Maxwellian ones and a reliable electron temperature cannot be determined (see chapter 4). We determine the electron distribution functions by solving the Boltzmann equation numerically for nitrogen plasmas and for different reduced electric field values. For this purpose, the program code 'EEDF', developed in the group of Prof. A. Napartovich [28], is applied. The electron velocity distribution function (EVDF) in kinetic energy scale (fv in eV−3/2) and the electron drift velocity (in cm/s) are calculated. Moreover, electron-electron collisions are neglected. A possible influence of Coulomb collisions on the reliability of the determined plasma parameters will be discussed below. The EVDF is normalized to fulfill equation (8) and the rate constants for electron impact excitations are calculated by equation (9):
where Ekin is the kinetic energy of electrons, me the electron mass and the coefficient C = 1.602 × 10⁻¹² g · cm2 · s−2 · eV−1. Equation (7) contains the unknown density of diatomic ions ([ (X)]). Positive molecular ions in a nitrogen plasma under elevated pressure plasma conditions are mostly two (
 ) and four atomic (
 ) [29]. Atomic nitrogen ions are excluded from the consideration because the density of N+ is relatively small due to the reduced density of neutral nitrogen N and the small cross section of electron impact ionization [30]. In assumption of plasma quasi-neutrality, the electron density is equal to the sum of molecular ion densities:

 ions are produced in a three particles reaction of
  (cf. equation (11)) [29]. The lifetime of four-atomic ions at elevated pressure depends on the electron density (cf. equation (12)):


The rate constants of the reactions in equations (11) and (12) are k8 = 5 × 10⁻²⁹ cm6 s−1 [29] and k9 = 2.0 × 10⁻⁶
 cm3 s−1 [31]. Equation (13) represents the rate equation for the density of
  under steady-state conditions:

In assumption of quasi-neutrality (equation (14)), the density of diatomic nitrogen ions is proportional to the electron density in first approximation (equation (15)):
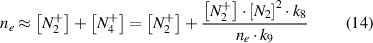
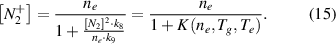
The coefficient K(ne,Tg,Te) depends on the electron density, the gas temperature and on the electron temperature. Under plasma conditions with both high gas temperature and high electron density, the term K(ne,Tg,Te) is much lower than unity. Thus, in a first approximation, K(ne,Tg,Te) is neglected in equation (7) and only taken into account in a second approach. Therefore, we start to characterize the plasma in a simplified model, with ![${n_e} \approx \left[ {N_2^ + } \right]$](https://content.cld.iop.org/journals/0957-0233/31/7/075501/revision2/mstab7e69ieqn26.gif) , which is represented by equations (4) and (16):
, which is represented by equations (4) and (16):

Equations (6) and (16) form a system of non-linear equations with regards to ne. This system has two solutions, which can be interpreted in the following way: the observed nitrogen emission spectrum can be caused by excitation processes under two different conditions, namely by a low electric field and a high electron density or by a high electric field and a low electron density. As was shown in [11, 12, 16], this ambiguous problem can be solved using the rotational distribution in the emission spectra of neutral and ionized nitrogen molecules. Under elevated pressure conditions, the rotational relaxation is very effective and the population of rotational levels of neutral nitrogen molecules in ground state (N2(X)) corresponds to the gas temperature, even in a short transient discharge. The kinetic energy of molecular ions  (X) is higher than the kinetic energy of neutrals N2(X) because the ions are formed by electron impact of thermalized neutral molecules and then are accelerated in the electric field between elastic collisions with the surrounding gas species [32]. The lifetime of
  ions, which is determined by the electron-ion neutralization and by the formation of
  ions, amounts to about 0.1–1 ms at low pressure conditions (cf. [16]) and 0.1–1 μs under elevated pressure conditions (cf. [11, 12]). The frequency of elastic collisions with the surrounding gas species is in both cases about two orders of magnitude higher than the respective decay. At these conditions, an overflow of kinetic energy of diatomic ions is uniformly distributed between three translational and two rotational degrees of freedom. Due to the selection rules ΔJ = 0, ± 1, the rotational distributions of molecular states, excited by electron impact, are similar to those before the collision with electrons. The rotational relaxation of the
  (B) state at elevated pressure in nitrogen plasmas is ineffective because each collision with a nitrogen molecule causes quenching of this excited state. In this case, the rotational distribution of the emission spectrum
  (B-X) corresponds to the rotational population of the lower molecular state of which
  (B) was excited by electron impact excitation. Therefore, if both nitrogen molecular emissions (neutrals and ions) are excited from ground state of neutral molecules (N2(X)), the rotational temperature in the emission spectrum of ions (
 (B-X)) is equal to that for the emission of neutrals N2(C-B). These conditions correspond to 'direct' electron impact excitation, namely to a high electric field and a low electron density. If the
  (B) state is excited by electron impact from the ion ground state
  (X), the rotational temperature in the emission spectrum of ions is higher than the rotational temperature of neutrals. Such plasma conditions correspond to 'stepwise' excitation, namely to a low electric field and a high electron density. The rotational structure of the nitrogen emission spectrum was successfully used to solve the ambiguous problem under low [16] and elevated pressures in [17, 33, 34]. Unfortunately, the rotational distribution in the emission spectra of nitrogen molecular species is not always measurable with sufficient accuracy if emission bands overlap [12, 35]. Moreover, under plasma conditions with a low electric field (< 30 Td [36]) ions with similar mass can be almost thermalized because of frequent elastic collisions and the low energy gain in the low electric field. In that case, a comparison of the measured and the calculated electric current can be applied for the solution of the ambiguous problem. The electric discharge current density of the spark micro-discharge can be calculated using the measured plasma parameters (cf. equation (17)), namely electron density, drift velocity vd of the electrons (calculated using the Boltzmann solver 'EEDF' [28]):

and the elementary charge (e). The measured plasma parameters for both possible excitation models are determined and evaluated. This procedure allows the solution of the ambiguity problem [12].
Plasma conditions with direct or stepwise excitation of the first negative system are very different and one excitation mechanisms can be neglected. Therefore, the intensity of  (B-X) emission (equation (16)) can be represented in form of equation (18) for direct electron impact excitation from ground state N2(X) or in form of equation (19) for electron impact excitation of
  (X):
(X):

The reduced electric field (E/N in Td) can be determined under both conditions by combining equation (6) with equation (18) or equation (19) yielding equations (20) and (21), respectively:
The electron density is calculated using equation (22) for both electron impact excitation mechanisms:
The above presented collisional-radiative model (or variations of it) was applied for the characterization of different low and atmospheric pressure nitrogen containing plasmas [cf. 11, 12, 17, 18]. However, the characterization of a transient spark discharge has peculiar properties because of the low electric field in the determined discharge phase and the spatial inhomogeneity of the small plasma channel.
2.2. Experimental setup
The transient spark micro-discharge to be characterized is time variant and not stationary. The discharge is ignited between two sharpened stainless steel electrodes with 0.7 mm distance, which are placed inside a discharge vessel to establish a controlled atmosphere (cf. figure 2). A nitrogen flow (Alphagaz 1 5.0) of 250 sccm and a pumping system are applied to sustain a constant gas pressure of 0.5 bar in the discharge vessel. A high voltage power supply provides a negative voltage pulse with a maximum of up to 45 kV. The spark discharge is ignited while the positive streamer reaches the cathode and a conductive channel is established between the electrodes. The very fast ionization wave in the spark channel causes a strong increase of the electron density and gas temperature. Because of the very low resistivity of the plasma, the voltage across the discharge gap drops and a diffuse glow phase of the discharge starts after several microseconds (cf. figure 3). We characterize the plasma conditions in this discharge phase using a delayed trigger of 100 µs to the first light emission (measured with photodiode Femto, HCA-S-400M-SI-SMA) for the spectrometer and the intensified CCD camera. The exposure times for taking a camera picture and measure a spectrum amount to 1 ms. Because the propagation of the streamer is a stochastic process, the shape of the plasma channel varies. Thus, the consecutive application of the ICCD camera with two optical filters for the first negative and the second positive systems of nitrogen photoemission will cause a significant error when determining plasma parameters with spatial resolution.

Figure 2. Experimental setup for the characterization of the transient spark micro-discharge applying the simultaneous two-wavelength diagnostics. A point-like microwave plasma source is used for the calibration procedure.
Download figure:
Standard image High-resolution image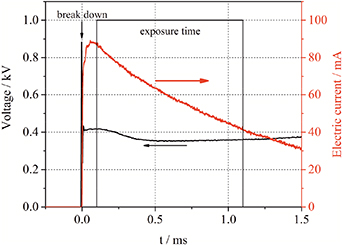
Figure 3. Temporal behavior of the applied high voltage (black) and the discharge current (red) in nitrogen at p = 0.5 bar.
Download figure:
Standard image High-resolution imageTo overcome this issue and characterize the transient discharge, an optical arrangement that consists of two achromatic lenses, two optical beam splitters, two bandpass filters for the respective nitrogen emission bands, two deflecting prisms and an ICCD camera as an image collector (cf. figure 2), is used. The application of the optical arrangement yields two discharge images, optimized for N2(C-B) and  (B-X) molecular emissions, respectively, displayed simultaneously but separated on the CCD chip of the camera (cf. figure 4). A fast ICCD camera (PCO DiCam pro, PCO, Germany) is used with an adjustable exposure time of 3 ns to 1000 s. The exposure time chosen in our experiment is 1 ms delayed to 100 µs to the first light emission of the spark discharge using a pulse delay generator (Stanford Research Systems, Inc, Model: DG 535, four channel digital pulse delay generator). To obtain the spatial distribution of N2(C-B) and
  (B-X) emissions, a bandpass filter with a transmittance at either 380 ± 5 nm or 390 ± 5 nm (Thorlabs GmbH, Germany) is aligned with two achromatic lenses to achieve a high resolution, respectively. Under this condition, the spatial resolution of the ICCD camera is about 13 μm (two pixel-length).

Figure 4. Simultaneous two-wavelength images of the spark micro-discharge in nitrogen at p = 0.5 bar (exposure time is texp = 1 ms, tdelay = 100 µs) without optical filters (left, gray scale) and with filters (right, colored for higher visibility of the plasma).
Download figure:
Standard image High-resolution imageThe transmission profiles of the applied narrowband optical filters are measured using a broadband light source (DH-Mini, OceanOptics), a grating imaging spectrometer (QE65000, OceanOptics, spectral resolution: 1.3 nm), and two collimators to produce a parallel light beam. The broadband light source is connected to the first collimator via an optical fiber. After passing the narrowband filter, the light beam is collected by the second collimator and guided by an optical fiber to the spectrometer.
The current-voltage characteristics are measured using a current probe (AM 503B, Tektronix, USA) and a voltage probe (P6015A, Tektronix, USA) connected to an oscilloscope (DPO 4104, Tektronix, USA), respectively.
2.3. Calibration procedure
2.3.1. Calibration of the echelle spectrometer.
To determine the gas temperature in the studied micro-discharge and to calibrate the ICCD camera in combination with the simultaneous two-wavelength arrangement, an absolutely calibrated broadband echelle spectrometer (ESA4000, LLA Instruments, Germany) is used. A brief overview of the calibration procedure is given in the following while further details can be found in [37]. The ESA4000 spectrometer is capable of measuring 90 spectral orders (30th to 120th) simultaneously without any moving parts due to the echelle spectrometer arrangement with two dispersive elements (prism and echelle grating, cf. figure 5) and an ICCD camera. By separating the spectral orders of the echelle grating with the prism and imaging them on the ICCD camera, a total spectrum with a spectral range of 200 nm < λ < 800 nm, composed of the separated spectral orders, is obtained with a spectral resolution of R = λ/Δλ ≈ 13 333 (Δλ = 0.015 nm at 200 nm to Δλ = 0.060 nm at 800 nm). However, this compact spectrometer configuration results in a complex spectral efficiency structure as the spectral sensitivity decreases at the edges of each spectral order, yielding regions with high spectral gradients. Therefore, a continuum reference light source from 200 nm to 800 nm is necessary to illuminate the echelle spectrometer and determine the spectral efficiency. The calibration procedure yields the spectral efficiency (εechelle(λ)) in counts · photons−1 of the spectrometer including its optical fiber. The measured spectra are automatically corrected by the ESA4000 control software via the efficiency function. A relatively calibrated deuterium lamp from 200 nm to 400 nm (X2D2 L9841, Hamamatsu Japan), and a tungsten ribbon lamp, calibrated in absolute units from 350 nm to 2500 nm (WI 17/G, OSRAM, Germany), are used for the calibration procedure.

Figure 5. Optical arrangement of the broadband echelle spectrometer ESA4000 (LLA Instruments, Germany). Reproduced with permission from [38].
Download figure:
Standard image High-resolution imageThe relative calibration in the UV range from 200 nm to 400 nm is realized using a stabilized UV/VUV D2 lamp L9841 (peak–peak fluctuation 0.005%) with a MgF2 window. The L9841 was calibrated at the electron-storage ring BESSY II of the Physikalisch-Technische Bundesanstalt (PTB) from 116 nm to 400 nm. If this lamp is driven in air, ozone is produced, due to the absorption in the VUV spectral range (λ < 200 nm). Ozone itself causes a broadband absorption in the UV spectral range with a maximum at λmax ≈ 253 nm. This leads to a systematical error of the calibration procedure. To prevent the ozone formation, the calibration of the ESA4000 is performed with the lamp and the optical fiber adapted to the vacuum chamber. For the relative calibration of the spectrometer, the optical fiber is adjusted in line-of-sight to the whole discharge area of the D2 lamp. As the total flux is not of interest in the relative calibration, no focusing optics are needed.
To calibrate the spectrometer in absolute numbers, a stable and reliable secondary standard must be used. In our case a tungsten ribbon lamp is applied which is calibrated in W · cm−2 · sr−1 · nm−1 at the center of the tungsten ribbon. As the temperature of the tungsten is not constant over the whole ribbon, the center of the ribbon needs to be focused onto the optical fiber entrance to calculate a reliable photon flux entering the spectrometer. The tungsten ribbon is projected onto the optical fiber by a concave mirror (Sigma Koki TCA-30C05-500, Japan) placed at 2 f distance to the ribbon and the fiber entrance. The mirror is Al-MgF2 coated with a radius of curvature of r = 500 mm, a focal point f = 250 mm, and a diameter of d = 10 mm. In the spectral range of the spectrometer from 350 nm to 800 nm, a reflectivity of 90% is assumed. The resulting solid angle of the mirror is calculated to Ω = 3.14 × 10⁻⁴ sr. The diameter of the optical fiber is 600 µm and yields an irradiated area of Afiber = 2.83 × 10⁻³ cm2. With these values, the spectral flux at the optical fiber entrance can be determined in W · nm−1 or in photons · nm−1 · s−1 (cf. figure 6).

Figure 6. Efficiency of the echelle spectrometer ESA4000 determined using two secondary standards, namely the deuterium lamp L9841 and the tungsten ribbon lamp WI 17/G.
Download figure:
Standard image High-resolution image2.3.2. Calibration of the ICCD camera.
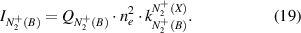
A point-like microwave plasma source is used for absolute calibration of the ICCD camera with the simultaneous two-wavelength arrangement. This plasma source is ignited in a flow of 2 slm nitrogen at atmospheric pressure (cf. figure 7). The MW plasma source is positioned in the same location as the studied spark micro-discharge (cf. figure 2). The image of this point-like plasma, recorded for the calibration, is presented in figure 7. The absolute intensities of N2(C-B,0–0) and  (B-X,0–0) are measured for this point-like source using the echelle spectrometer (cf. figure 8), while taking the geometrical factor into account, as the optical fiber collects only a fraction of the emitted photons.

Figure 7. Microwave plasma source operated in nitrogen flow (2 slm) used for absolute calibration of the ICCD camera (left). The image of the microwave plasma source was taken with the ICCD camera equipped with the two-wavelength arrangement during the calibration procedure (right).
Download figure:
Standard image High-resolution image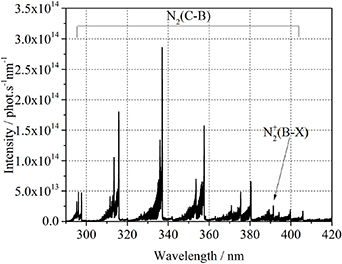
Figure 8. Emission spectrum of the microwave plasma source measured with the calibrated echelle spectrometer ESA4000.
Download figure:
Standard image High-resolution imageTo determine spatially resolved emissions from N2(C,0) and  (B,0), the bandpass filters 380 ± 5 nm and 390 ± 5 nm are used. Emission bands, namely N2(C-B,0–2) at 380.5 nm and
  (B-X,0–0) at 391.4 nm, are selected. These wavelengths are chosen according to the intensity distribution in the emission spectrum of nitrogen, the transmission of the applied optical elements and the sensitivity of the ICCD camera. As discussed in chapter 2.1, for the plasma characterization absolute intensities of the emission bands of N2(C-B,0–0) at 337.1 nm and
  (B-X,0–0) at 391.4 nm are required. The relation between the intensities of the N2(C-B,0–0) and N2(C-B,0–2) bands corresponds to the Franck–Condon factors of these transitions, which are independent from plasma conditions and probabilities of excitation and de-excitation processes for the N2(C,0) level. This relation is automatically included in the calibration factor.
2.4. Determination of the rotational temperature of neutrals and ions
In the work presented here, the rotational distribution of molecular nitrogen is of great importance for the plasma characterization. First, the gas temperature is evaluated at steady-state conditions and used to obtain the gas density with the ideal gas law. Second, the rate constants for collisional processes of atomic and molecular species are corrected using the gas temperature. Third, as discussed, is the choice of the proper excitation mechanism for the molecular nitrogen emission. The determination of the gas temperature from rotational bands using neutral and ionized nitrogen molecules is a well-known technique for many decades (e.g. [2, 35, 39]). However, depending on the discharge conditions, the analysis has to be adapted to the excitation and relaxation mechanisms. In an ideal case, which is often the case at pressures of a few Pa in, for example, RF discharges, the ground state molecules achieve thermal equilibrium through collisions before being dissociated or leaving the reactor. Then, their rotational distribution  is proportional to the Boltzmann relation (equation (23)):
with the rotational quantum number J, the rotational constant of the molecular state Be, and the rotational temperature Trot. Because of the selection rule ΔJ = 0, ± 1 for electron impact excitation, the rotational distribution is projected to excited states and therefore can be observed as long as the excited state is depopulated by spontaneous emission before colliding with the background gas. In this scenario, the observed rotational distribution is described by the rotational constant from the ground state, although being emitted from an excited state. Therefore, to calculate the rotational and the gas temperature of the studied plasma, the knowledge of excitation-deactivation mechanism is essential. In the presented discharge, the gas temperature is determined using the N2(C-B) band. As shown before, the dominant excitation mechanism of N2(C) under the given discharge conditions (0.5 bar) is direct excitation from the ground state (N2(X)) by electron impact [2] and the ground state rotational distribution is transferred into the excited state. The effective lifetime of N2(C) (equation (24)), due to spontaneous emission and quenching by the background gas, yields  :
:
The rotational-translational relaxation time of the N2(C) rotational states is in the range of 0.5 ns at 1 bar [2]. Thus, it can be assumed that the projected rotational distribution from N2(X) to N2(C) is thermalized in the N2(C) state before spontaneous emission takes place. Thus, the rotational distribution of the N2(C-B) transition is described by the rotational constant of the N2(C) state [40].
The rotational distributions of neutral and ionized nitrogen molecular emissions, the measured spectra of N2(C-B,0–0) and  (B-X,0–0) vibrational bands are compared to simulated spectra calculated using a program code developed by Prof. K. Behringer. The program determines the intensities of the emission lines proportional to Hönl-London factors for respective transitions and populations of rotational levels. A Boltzmann distribution of the rotational levels of the electronically excited states N2(C) and
  (B) is assumed. The simulated intensities of the emission spectra are convoluted with the instrumental function of the applied spectrometer, which is approximated by a Gaussian profile. The bandwidth (FWHM) of Δλ = 0.025 nm is used in the simulation of N2(C-B,0–0) in the spectral range of 320 nm to 338 nm (spectral orders of 75–71) and Δλ = 0.029 nm in the simulation of
  (B-X,0–0) in the spectral range of 380 nm to 392 nm (spectral orders of 63–61). The most important sources of error when determining the rotational temperature of molecular nitrogen are statistical errors in the measurement of a low signal, the influence of continuous and discrete emission spectra of other species (besides nitrogen) excited in the studied discharge, and inaccuracies of spectroscopic constants applied in the simulation. Both simulated and measured spectra are normalized at the band heads and compared in the spectral range, where at our spectral resolution the single rotational lines overlap and produce a broadband structure.
2.5. Methodology of the plasma characterization
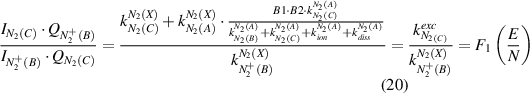
The OES plasma characterization with spatial resolution is only possible through a consecutive determination of the electric field (equations (20) and (21)) with a subsequent calculation of the electron density (equation (22)). However, first, the mechanism of  (B-X,0–0) excitation (equation (20) or equation (21)) must be determined because the plasma conditions of both excitation schemes are very different and one of these mechanisms can always be neglected. A robust method (in most cases) to evaluate the dominate process is the comparison of the rotational temperature of neutral and ionized molecular photoemission of nitrogen. However, this method is not always applicable, because of the low intensity in the measured spectra of ions or too low electric field values at the studied plasma conditions (cf. capture 2.1). Therefore, we now discuss a general case, namely the a priori absence of any reliable information of the excitation mechanism of molecular nitrogen emission. Both direct and stepwise excitation must be considered separately under these plasma conditions. To determine the reduced electric field in our experiment, we simulate the EVDF in a nitrogen plasma using the Boltzmann solver (cf. section 2.1) for different electric field values yielding the rate constants for electron impact processes (equation (9)). To enable an automated investigation of the camera images for a plasma characterization with spatial resolution, the rate constants are determined at different reduced electric field values E/N and are fitted with polynomials afterwards over a broad E/N range yielding the functions F3, F4, and F5 (equations (25)–(27)). Here, F3 in equation (25) describes the invers of the intensity ratio of
  (B-X) to N2(C-B) in relation to the reduced electric field, when the
  (B-X) emission is excited only by electron impact of the ground state of the neutral molecular nitrogen:
F4 in equation (26) describes the same ratio but with excitation of  (B-X) only via
  (X):
(X):
At last, F5 in equation (27) is the rate coefficient for excitation to N2(C) via N2(X) and N2(A) as a function of E/N:
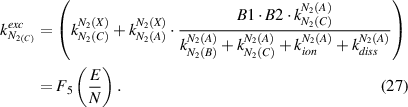
The same procedure is also applied for the drift velocity for low and high electric fields (cf. figures 9 and 10). Electric field ranges by direct or stepwise electron impact excitation are very different. A fitting of the polynomial in very broad variation of electric field values is complicated and the fitted function has in wide field regions a large difference to the calculated points. Therefore, a first step is the determination of possible electric field variation regions for both excited molecules and after that the electric field and excitation rate constants functions can be fitted with polynomials.
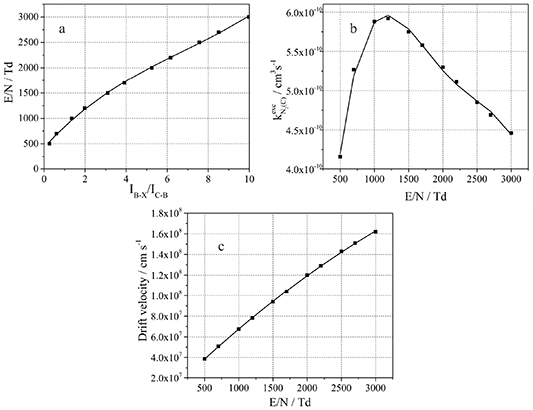
Figure 9. (a) The inverted dependency of the nitrogen molecular emission ratio ( (B-X) to N2(C-B)) on the reduced electric field F3 (equation (25)); (b) the rate constant for electron impact excitation of N2(C-B,0–0) emission F5 (equation (27)) calculated for direct electron impact excitation of
  (B) and (c) the electron drift velocity in dependence on reduced electric field. The solid lines represent the fitted polynomials.
Download figure:
Standard image High-resolution image
Figure 10. (a) The inverted dependency of the nitrogen molecular emission ratio ( (B-X) to N2(C-B)) on the reduced electric field F4 (equation (26)); (b) the rate constant of electron impact excitation of N2(C-B,0–0) emission F5 (equation (27)) calculated for stepwise electron impact excitation of
  (B) and (c) the electron drift velocity in dependence on reduced electric field. The solid lines represent the fitted polynomials.
Download figure:
Standard image High-resolution imageThe measured intensities of the N2(C-B,0–0) and the  (B-X,0–0) emission (averaged or spatially resolved), corrected for the respective collisional quenching
  and
and  , are applied for the determination of the electric field (averaged or spatially resolved). In assumption of direct or stepwise excitation of the
  (B) state, equation (25) or equation (26) is used respectively.
After the calibration of the ICCD camera using the echelle spectrometer and the point-like MW plasma source operated in nitrogen flow, the radial emissivity distribution of N2(C-B,0–0) and  (B-X,0–0) (in photon · s−1 · cm−3) is determined using the inverse Abel transformation [41]. The volumetric pixel amounts to 6.73 µm × 6.73 µm × 6.73 µm. In order to choose the electron impact excitation mechanism, we use one full cross section of the plasma filament with a thickness of 6.73 µm, determine the averaged plasma parameters, reduced electric field and electron density separately in assumption of direct or stepwise excitation and calculate the resulting electric current through the whole cross section. By comparing the measured current (cf. figure 3) to the calculated currents from the OES model (direct or stepwise excitation), a determination of the excitation mechanism is possible.
3. Results
The emission spectrum of the nitrogen plasma at a pressure of 0.5 bar, measured with an exposure time of 1 ms and a delay of 100 µs, with respect to the start of the spark ignition, is shown in figure 11. An achromatic lens is used to enlarge (scale 1:2) the image of the plasma channel between the two electrodes. The optical fiber of the spectrometer has a diameter of 600 µm and is placed in the center of the image. In this configuration, the spectrum can only be calibrated in relative units due to the unknown geometrical factor resulting from the achromatic lens. However, this measurement allows a high spatial resolution of the plasma channel with sufficient intensity to accurately analyze the rotational bands. The spectrum depicts the nitrogen vibrational bands of the second positive and first negative system as well as atomic lines of sputtered material from the electrodes. The gas temperature is determined by fitting the rotational distribution of N2(C-B,0–0) at λ = 337.1 nm to 3500 ± 100 K. The same rotational temperature is also determined fitting the nitrogen molecular ion  (B-X) band. Because of the equality of the rotational temperature of the neutral and ionized molecular nitrogen in the experiments in [12, 16, 23], it was concluded that the
  (B) state is excited by direct electron impact excitation of the ground state N2(X) at a high electric field and a low electron and ion density. However, the equality of the rotational temperature in our spark micro-discharge contradicts to the high gas temperature, which testifies a high density of charged species. To resolve this contradiction and to identify the dominant process, an additional procedure is applied by comparing the measured electric current with the electric current calculated using the averaged plasma parameters in the plasma channel, for both direct and stepwise excitation of
  (B-X) emission, as described in the previous section. The results are presented in table 1.
Table 1. Averaged plasma parameters and electric current determined using OES diagnostics in assumption of direct and stepwise excitation of molecular nitrogen ions emission.
Direct excitation  (B) (B) |
Stepwise excitation  (B) (B) |
|
|---|---|---|
| Intensity N2(C-B,0–0) corrected to collisional quenching | 3.6 × 10¹⁹ phot. · cm−3 · s−1 | 3.6 × 10¹⁹ phot. · cm−3 · s−1 |
Intensity  (B-X,0–0) corrected to collisional quenching (B-X,0–0) corrected to collisional quenching |
1.88 × 10²⁰ phot. · cm−3 · s−1 | 1.88 × 10²⁰ phot. · cm−3 · s−1 |
| Reduced electric field (E/N) | 1960 Td | 39 Td |
| Electron density | 5.3 × 108 cm−3 | 2.7 × 1014 cm−3 |
| Drift velocity | 1.2 × 108 cm · s−1 | 5.05 × 106 cm · s−1 |
| Electric current | 8.36 µA | 180 mA |

Figure 11. Emission spectrum of the nitrogen plasma at 0.5 bar, measured with an exposure time of 1 ms and a delay of 100 µs, with respect to the start of the spark ignition. The simulated spectra of N2(C-B,0–0) and  (B-X,0–0) bands fitted to the measured ones are shown in red and blue, respectively. The rotational temperature of both molecular bands is 3500 ± 100 K.
Download figure:
Standard image High-resolution imageThe results show that the same measured emission intensities of nitrogen can be interpreted in the frame of very different and mutually exclusive excitation models. A difference between the calculated electric current in both assumptions (direct: I = 8.36 μA and stepwise: I = 180 mA) roughly amounts to a factor of 2 × 10⁴. The electric current measured in our experiment during the exposure time of the ICCD camera changes from 95 mA down to 50 mA (cf. figure 3), which is in the range of the stepwise excitation model. Thus, although the rotational distribution of the neutral and ionized molecular nitrogen show the same rotational temperature, the dominant excitation mechanism of  (B) is the excitation from the ionic ground state
  (X) and therefore direct excitation from the neutral ground state N2(X) can be neglected. A reason for this exception will be discussed below.
Based on the previous results, the spatial analysis of the discharge using the ICCD camera is performed using the stepwise excitation model (excitation of both neutral and ionized molecular emission of nitrogen). Figures 12 (left) and 13 (left) depict the images of the discharge emission using the 380 nm filter and the 390 nm filter, respectively. To determine the radial plasma parameters, the images are corrected for their background and balanced along the discharge axis to perform the inverse Abel transformation using only absolute radius values (cf. figures 12 (right) and 13 (right)). Afterwards, the images are calibrated in photons · s−1 · cm−3 (cf. figure 14) and corrected for quenching with the nitrogen background gas ([N2] = 1.07 × 1018 cm−3). Finally the model is applied to every single volume pixel using the determined functions to describe the excitation processes (equations (26) and (27)). The spatial distributions of the reduced electric field and the electron density are shown in figure 15. Inserting the drift velocity (figure 10(c)) and the electron density, the spatial distribution of the electric current density (in A · cm−2) (figure 16 (left)) and the axial distribution of the total electric current (figure 16 (right)) are calculated.

Figure 12. ICCD image of the glow phase of the spark micro-discharge, measured with a narrowband filter 380 nm ± 5 nm in nitrogen plasma at p = 0.5 bar (left) and after the inverse Abel transformation (right). The cathode is located at the left border (position 0 cm), the anode is located at the right border (position 0.07 cm).
Download figure:
Standard image High-resolution image
Figure 13. ICCD image of the glow phase of the of the spark micro-discharge, measured with a narrowband filter 390 nm ± 5 nm in nitrogen plasma at p = 0.5 bar (left) and after the inverse Abel transformation (right). The cathode is located at the left border (position 0 cm), the anode is located at the right border (position 0.07 cm).
Download figure:
Standard image High-resolution image
Figure 14. Spatial distribution of the intensity of N2(C-B,0–0) (left) and  (B-X,0–0) (right) after correction of quenching determined in nitrogen plasma at p = 0.5 bar using a calibrated ICCD camera with simultaneous two-wavelength arrangement and inverse Abel transformation.
Download figure:
Standard image High-resolution image
Figure 15. Spatial distribution of the reduced electric field (left) and electron density (right) determined in context of the stepwise electron impact excitation model.
Download figure:
Standard image High-resolution image
Figure 16. Spatial distribution of the current density (left) and axial distribution of the electric current (right) calculated via the determined plasma parameters in nitrogen plasma at p = 0.5 bar.
Download figure:
Standard image High-resolution image4. Discussions
The reliability of the plasma characterization with spatial resolution using simultaneous two-wavelength OES diagnostics depends on the intensity of the nitrogen photoemission, sensitivity of the applied ICCD camera, accuracy of the calibration procedure, spectral width of the narrow band filter transmission, and several other factors. Some of these sources of error are inherent to the experiment itself and defined by conditions of the plasma. Others, such as the sensitivity of the ICCD camera and the spectral width of the narrowband optical filter, depend on the state of technological development and are constantly improved. The possible sources of error regarding especially the OES model, but also the used measurement systems will be discussed below.
The presented results rely on the accuracy of the applied collisional-radiative model, which is strongly simplified and needs verification. For the OES plasma characterization, nitrogen photoemission is used, which is excited by electron impact directly from the nitrogen ground state or by stepwise processes via the metastable state and the ground state of nitrogen ions. In doing so, the so-called 'energy pooling' process (equation (1)) is neglected. To validate this assumption, the steady state density of the nitrogen metastables N2(A) in the discharge is calculated using the determined plasma parameters ([N2(A)] = 2.4 × 1012 cm−3). Further on, the theoretical influence of the 'energy pooling' process on the intensity of N2(C-B,0–0) is compared to the measured one. For this purpose, the population of the vibrational state N2(C,0), which amounted to 0.24 (measured in [42]) is used as well as the Einstein coefficient of the N2(C-B,0–0) transition with respect to the total probability of photoemission from level N2(C,v' = 0) [27]. Based on this estimation, the intensity of the N2(C-B) transition, excited in the 'energy pooling' process, is lower than 1% of the intensity measured in the experiment and can be neglected.
Furthermore, the applied model assumes very low relative densities of N+ and  ions in comparison with
  . As mentioned before, the density of atomic ions is negligible because of the short lifetime of atomic species and low ionization rate under elevated pressure conditions. The influence of
  ions can be determined by the evaluation of the coefficient K(ne,Tg,Te) (equation (15)), which describes the ratio of
  to
to  ions. The electron temperature is estimated for the averaged kinetic energy of the electrons, which is calculated using the determined EVDF. Applying the determined plasma parameters (ne = 2 × 1014 cm−3, Tg = 3500 K, Te = 7000 K), the coefficient K(ne,Tg,Te) ≈ 0.01 is considerably smaller than unity and can be neglected in equation (15). Therefore, the assumption of equality of electron density and density of
  ions is valid.
The rotational temperature of neutral and ionized diatomic molecules is equal in the presented study, although it was found by the calculation and measurement of the discharge current density that the  (B) state is excited by electron impact of the ionic ground state
  (X). This effect conforms to a low electric field strength measured in the experiment, which causes similarity of the kinetic energy and rotational distribution of ions and neutrals, according to [36].
The electron velocity distribution function is simulated using the 'EEDF' program for different electric field values and neglected Coulomb collisions (cf. figure 17(b)). At low electric field conditions of the studied plasma (30 Td–40 Td), the simulated distribution functions differ strongly from Maxwellian ones. The influence of Coulomb collisions under these conditions can be remarkable. To clarify this effect, the EVDF is simulated again with the 'EEDF' program for different electric field values (30 Td–100 Td) for an estimated ionization degree of 2 × 10⁻⁴. The results are compared with the previous simulation in figures 17(a), (b)). The influence of Coulomb collisions on the shape of simulated EVDF is visible for a low electric field strength (<40 Td). The electric field, which is determined using our collisional-radiative model and new simulated EVDFs, does not differ from that determined by neglecting Coulomb collisions. At the same time, the electron density, which can be determined using the measured nitrogen molecular photoemission and new simulated EVDFs, is about 50%–60% lower than the previously determined electron density presented in figure 15. In the future, the analyzing procedure applied by OES plasma characterization must be optimized for a low electric field (<40 Td) and high electron density plasma conditions.
Figure 17. Electron velocity distribution function simulated using the 'EEDF' program [28] in a nitrogen plasma at 35 Td with (a) and without Coulomb collisions (b). The abscissa shows the kinetic energy E of the electrons.
Download figure:
Standard image High-resolution image
The vibrational excitation of nitrogen molecules in the ground state can be a reason of super-elastic collisions with electrons and can influence the effectivity of the electron impact excitation of the nitrogen photoemission near the threshold. To estimate the possible influence of the vibrational excitation of nitrogen on the shape of the electron distribution function and electron impact excitation, the lifetime of the nitrogen molecule in the plasma volume and the lifetime regarding the electron-vibrational (e-v) energy exchange is compared. The former lifetime is determined by gas diffusion and amounts to 200 ns–300 ns. We estimate the latter lifetime by the calculation of the probability of 0–1 vibrational excitation (e-v) by electron impact. Here, the electron distribution function simulated using the 'EEDF' program, the cross section from [19] and the electron density from figure 15 are applied. This calculated lifetime of about 3 μs is more than one order of magnitude longer than the lifetime of nitrogen molecules in the plasma volume. Therefore, we exclude the vibrational excitation from the consideration. Moreover, the vibrational distribution of the N2(C) state correlates with N2(X,v") via well-known Franck-Condon factors [30] and can be determined using the emission spectrum of N2(C-B) presented in figure 11, thus, testifying electron impact excitation only from the N2(X,v" = 0) state.
The accuracy of measurement and analysis strongly influence the reliability of the plasma characterization using OES diagnostics under elevated pressure conditions. It depends not only on the calibration accuracy of the applied measurement system, but also on the reliability and accuracy of the simulation procedures. Three numerical simulation codes are used to simulate the nitrogen emission spectrum, to simulate the electron distribution function by numerically solving the Boltzmann equation, and to perform the inverse Abel transformation of the ICCD images. Unfortunately, no standard and benchmarked codes as well as procedures to determine the accuracy of the applied numerical simulations are available. Therefore, the accuracy of OES plasma characterization can only be analyzed based on the accuracy of the measurements and the calibration procedure. The calibration of the echelle spectrometer and of the secondary standards, namely deuterium lamp (7% at 200 nm–400 nm) and tungsten-ribbon lamp (4% at 350 nm, 2.3% at 380 nm, 1.8% at 600 nm and 2.3% at 780 nm) yields an accuracy of the echelle spectrometer efficiency (εechelle(λ)) of 8% in the complete spectral range. The standard deviation of the intensity measurement, using the calibrated echelle spectrometer and the plasma parameters, is determined using quadratic error propagation. The inaccuracy of the ICCD camera calibration, using a point-like MW plasma source and the calibrated spectrometer, amounts to 2% measuring N2(C-B,0–0) and 5% when determining the intensity of  (B-X,0–0). The inaccuracy of collisional quenching of N2(C-B) and
  (B-X) amount to 6% and 14% at the used experimental conditions [26]. The inaccuracy of the cross sections of excitation of N2(C-B,0–0) and
  (B-X,0–0) emission by electron impact of N2(X) and
  (X) are 14% and 4% respectively [19, 21].
After the discussion of the collisional radiative model, the influence of the used diagnostics is evaluated. A significant measurement error arises from the low intensity of the ICCD images to determine the electric field and electron density. Because of the poor signal-to-noise ratio, the standard deviation of both plasma parameters is 3% and 20% at the anode, and 30% and 100% at the cathode, respectively. Thus, the results could be drastically improved using a camera with higher sensitivity and optics with increased transmission.
As a result of the high gas temperature of 3500 K under the studied plasma conditions, a large number of rotational states is populated yielding broad rotational bands of the N2(C-B) and  (B-X) transitions. Furthermore, several vibrational bands are significantly populated, which causes the overlapping of several rotational spectra from different vibrational states with the observed transitions N2(C-B,0–2) and
  (B-X,0–0). Because of the FWHM of 10 nm of the applied optical bandpass filters with a center wavelength at 380 nm and 390 nm, not only the intensities of the observed transitions of N2(C-B,0–2) and
  (B-X,0–0) are recorded in the ICCD images. This causes a systematical error of the plasma characterization. To correct the intensities, first the transmission profiles of the filters are measured. Second, the transmission profiles are multiplied with the measured spectrum of the spark micro-discharge. Third, the intensity correction factors are calculated by the ratio of the observed transition to the total intensity. The fraction of the N2(C-B,0–2) intensity, measured via the 380 ± 5 nm bandpass filter, is 0.36 due to the emission of N2(C-B,0–2,1-3,2–5,3-6). The
  (B-X,0–0) intensity, measured via the 390 ± 5 nm bandpass filter, yields a factor of 0.35. Finally, every pixel of the corresponding ICCD image is multiplied with its correction factor to get the single intensities of the observed transitions N2(C-B,0–2) and
  (B-X,0–0).
As shown in [12], the electric current, which is the product of electron drift velocity, electron density and elementary charge, can be used to verify the collisional radiative model by comparison with the measured current. However, this method is only applicable if the cross section of the plasma channel, as well as the radial distribution of drift velocity and electron density, can be determined reliably. The electric current, measured with the current probe during the exposure time of the ICCD camera, decreases from 95 mA down to 50 mA with a time averaged value of about 60 mA (cf. figure 3). The current determined from the ICCD camera images shows a good agreement to the current probe measurement near the anode (cf. figure 16 (right)). However, in the rest of the plasma channel, the current is approximately two times higher. The difference is most-likely caused by an overestimation of the electron density because of the neglect of the Coulomb collisions at low electric field conditions, the low signal-to-noise ratio in the plasma volume and slight variations of the plasma filament position during the exposure time the ICCD camera. This results in an artificial broadening of the plasma channel and an increase of the calculated values due to quadratic dependence of the calculated current on the plasma channel radius. However, the stability of the plasma channel near the anode is given by the spike form of this electrode and yields the most reliable current calculation, which supports reliability of the OES method due to its consistency with the current probe measurement.
5. Conclusion
The plasma parameters (reduced electric field, electron density) of a transient micro-discharge in nitrogen at 0.5 bar are determined by applying calibrated optical emission spectroscopy with spatial resolution combined with numerical simulations. The collisional-radiative model is developed for two molecular bands N2(C-B,0–0) and  (B-X,0–0), which are measured simultaneously but spatially separated with an in-house made optical arrangement on a single ICCD camera. The system was calibrated using a point like plasma source operated in nitrogen flow and an absolutely calibrated echelle spectrometer. A spatial resolution of 13 µm is achieved after the Abel inversion of the measured ICCD images. The analysis takes direct and stepwise electron impact excitation into account and yields a reduced electric field of about E/N = 35 Td and an electron density of about ne = 3 × 1014 cm−3 by comparing the measured and simulated intensities of molecular nitrogen emission. The required rate constants are determined using known cross sections and the electron velocity distribution function at different electric field strengths, which are simulated using a Boltzmann solver. The gas temperature of 3500 ± 100 K is determined by the comparison of the measured and simulated rotational structure of the emission spectrum of molecular nitrogen. The reliability of the determined plasma parameter is verified by comparison of the simulated and measured electric current. Possible sources of errors, which influence the reliability and accuracy of the transient discharge characterization, are discussed.
Acknowledgment
The authors are thankful to Professor K Behringer for the development of the program code for simulation of nitrogen emission spectra and the SFB 1316 (A5) for substantial funding the diagnostic improvement.