

Abstract
This paper reports on highly active ZnFe2O4/reduced graphene oxide (ZnFe2O4/rGO) nanocomposites synthesized by a modified sol-gel method. The as-prepared samples have been characterized by XRD, TEM, XPS and other detection methods, which demonstrate that ZnFe2O4 nanoparticles (NPs) with a diameter of 15 ∼ 50 nm were densely grown on the rGO substrates. The photocatalytic activities of ZnFe2O4/rGO catalysts were evaluated by the degradation of Methylene blue (MB) under visible light. The results showed that the ZnFe2O4/rGO catalysts had high photocatalytic activity, and the degradation efficiency of MB was almost 100% within 180 min. Moreover, the ZnFe2O4/rGO catalysts also had a great removal effect on Rhodamine B (RhB) and Methyl orange (MO). Mechanistic studies revealed that the rGO acted as a stabilizer to prevent ZnFe2O4 from aggregation and improved the separation of photo-generated electrons. The high efficiency for dye degradation was attributed to the generation of hydroxyl radicals (·OH) via the photochemical decomposition of H2O2 on ZnFe2O4/rGO catalysts, which was responsible for the oxidation of the dyes. Of note, the ZnFe2O4/rGO catalyst maintained an efficiency of over 90% after five cycles. The XRD, XPS and VSM characterization revealed that the ZnFe2O4/rGO catalysts had a stable crystal structure and can be easily separated.
Export citation and abstract BibTeX RIS
1. Introduction
Organic dyes are one of the largest groups of pollutants discharged into waste water from textile, dyeing and other industrial processes which adversely impact the environment and human health [1]. Great efforts, using various techniques, have been made to remove such hazardous contaminants from waste water, such as physical adsorption [2], ozonation treatment [3], microbial degradation [4] and photocatalysis [5]. Of note, photocatalysis demonstrates great promise due to low cost, nontoxicity and the ability to use sustainable solar light as a photon source [6–8].
So far, semiconductors including TiO2 [9, 10], ZnO [11] and BiOCl [12] have been widely used as photocatalysts for the degradation of organic pollutants. They generally have a wide band gap, which narrows the light response range and restricts their application under solar light. Furthermore, it has been found to be difficult to separate them from the bulk suspension solution. To overcome the above issues, spinel ferrite (AB2O4) with visible light response activity and magnetic behaviour attracted the attention of researchers, and coupling the spinel ferrite catalyst with TiO2 [13, 14], ZnO [15] or BiOCl [16] has been proved as an efficient approach to improve its recycling ability. Among them, ZnFe2O4 possesses a band gap of 1.92 eV, which has attracted remarkable attention for photocatalytic treatment due to its visible light absorption, strong magnetic behaviour and high photochemical stability [17]. However, because of the poor quantum efficiency of ZnFe2O4 resulting in low photocatalytic activity, ZnFe2O4 is rarely used directly in traditional photocatalytic processes [18]. Instead, ZnFe2O4 is mostly used as an adsorbent to remove pollutants from waste water [19–21]. Recently, a wide range of carbon materials such as activated carbon [22], MWCNTs [23] and expanded graphite [24] have been used as supports for promoting the photocatalytic efficiency of ZnFe2O4. Graphene especially has attracted great attention as a support because of its large surface area, superior electronic conductivity, remarkable structural flexibility and high chemical stability [25–28]. It has been reported that graphene supports for NiFe2O4 [29], CoFe2O4 [30] and ZnFe2O4 [31] were successfully synthesized for enhancing photocatalytic activity. Meanwhile, ZnFe2O4/graphene composites have been prepared by the hydrothermal method [32], solvent-thermal method [33], co-precipitation method [34], and a combined utilization of laser ablation in liquid technique [31]. However, most of these synthetic methods need relative harsh conditions or organic solvents. Moreover, previous literatures have proved that different preparation methods would lead to different structural, morphological and optical properties and as a result, influence the overall photocatalytic activity of the obtained materials [35, 36]. The sol-gel synthesis was considered an attractive method for the preparation of photocatalysts because of its homogeneity and operational simplicity [37, 38]. To date, to our knowledge, it still remains a challenge to develop a simple and relatively green sol-gel strategy to synthesize ZnFe2O4/graphene composites with different physical characteristics (such as crystallinity, morphology, and optical and magnetic separation properties) and apply the composites for organic dye degradation.
In this study, a facile modified sol-gel method combined with an appropriate calcination process was developed for synthesizing ZnFe2O4/rGO composites using environmental friendly urea as a complexing agent and harmless ascorbic acid instead of hydrazine hydrate as a reducing agent. The microstructures, morphologies and optical properties of the as-synthesized composites were investigated. The H2O2-assisted photocatalytic performance under visible light was evaluated using MB, RhB and MO as model contaminants. The as-synthesized ZnFe2O4/rGO catalysts exhibited high photocatalytic activity on the degradation of the organic dyes. Moreover, the significantly enhanced magnetic properties made separation easier. In addition, the reaction kinetics, photocatalytic mechanism, and the reusability of the ZnFe2O4/rGO catalysts are also discussed.
2. Experiment
All reagents were of analytical grade and used without further purification, and the solutions were freshly prepared with deionized water.
2.1. Preparation of ZnFe2O4/rGO composites
Graphene oxide (GO) was prepared from flake graphite by a modified Hummers method [39]. Figure 1 illustrates the scheme of the preparation of ZnFe2O4/rGO composites. Briefly, 60 mg of GO was dispersed into 40 ml of H2O with sonication for 60 min. Meanwhile, 0.297 g Zn(NO3)2 · 6H2O and 0.808 g Fe(NO3)3 · 9H2O (molar ratio of Fe3+ versus Zn2+ was 2:1) were dissolved in 20 ml of H2O at room temperature. The above two solutions were mixed together and stirred for 1 h. After that, 10 ml aqueous solution containing 120 mg of ascorbic acid was added dropwise to the above mixture for the reduction of GO. After raising the water bath temperature to 80 °C the mixture solution was stirred for another 4 h, resulting in a black rGO solution. Then, 0.5 g urea was slowly added to the obtained solution followed by stirring at 90 °C until a black gel was obtained. The gel was dried in a vacuum at 60 °C overnight and then calcined at 300 °C, 400 °C, 500 °C and 600 °C for 3 h in N2 to obtain the ZnFe2O4/rGO (ZFG) composites. The samples calcined at 300 °C, 400 °C, 500 °C and 600 °C are denoted as ZFG300, ZFG400, ZFG500 and ZFG600, respectively. For comparison, pure ZnFe2O4 was also prepared using the same procedures without GO.
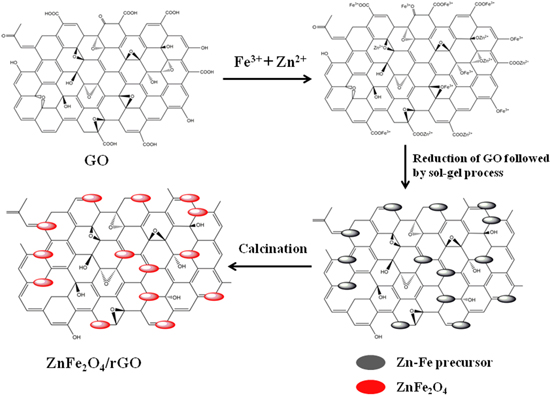
Figure 1. Scheme illustration for the preparation of ZnFe2O4/rGO composites.
Download figure:
Standard image High-resolution image2.2. Characterization
The phase structure was analysed by an x-ray diffractometer (XRD; Rigaku, Ultima IV). The morphology of products was determined by transmission electron microscopy (TEM, JEM-2010F). The optical properties of the samples were investigated by UV–vis diffuse reflectance spectra (DRS) using a spectrophotometer (PE lammda750S). The elemental composition was investigated by x-ray photoelectron spectroscopy (XPS; Thermo Escalab 250XI). The chemical components of the samples were determined by Fourier transform infrared (FT-IR, Nicolet-6700) spectra and Laser Raman spectroscopy (Horiba Evolution). The magnetic properties was measured in a vibrating sample magnetometer (VSM; Quantum design, PPMS-9). BET surface area and pore size distribution were investigated by nitrogen adsorption-desorption studies at 77 K using a surface area and porosimetry system (Micromeritics, ASAP 2460).
2.3. Photocatalysis test
The photocatalytic performance of the as-prepared photocatalysts was evaluated by degrading organic dyes (MB, MO and RhB) at a neutral pH. A 300 W halogen tungsten lamp with cut off filter (λ > 420 nm) was employed as the visible light source and a 300 W xenon lamp as the simulated solar light source. For each photocatalytic test, 25 mg of catalyst was added into 50 ml of aqueous dye solution with an initial concentration of 20 mg L−1. Before starting the illumination, the mixture was stirred for 60 min in the dark to reach the adsorption-desorption equilibrium between the dye and catalyst. The lamp was turned on after adding 0.1 ml, 0.3 ml, 0.5 ml, or 0.7 ml of H2O2 to the above reaction mixture, and no method was further employed to remove H2O2. At given intervals, 3 ml of liquid was withdrawn and magnetically separated to remove all catalysts. The residual concentration was monitored using the spectrophotometer (PE lammda750S). The photocatalytic activity was calculated by applying the following equation:

where C0 is the concentration at the adsorption equilibrium and C is the residual concentration at different illumination intervals.
To investigate the stability of catalyst, the catalyst was collected, washed with water and absolute ethanol, and dried at 70 °C. The reuse study of the catalyst was carried out under identical conditions to the above.
3. Results and discussion
3.1. XRD analysis
The phase structure was analyzed by XRD as shown in figure 2(a). The strong peak at 2θ = 10.91° (GO) is attributed to the (001) plane of GO. The rGO shows a broad peak at around 25°, which suggests that rGO was prepared successfully [40]. All the peaks for ZnFe2O4 index well to crystalline ZnFe2O4 with a cubic spinel structure. As shown in ZFG500, the peaks at 2θ = 18.03°, 29.76°, 35.08°, 36.80°, 42.78°, 53.00°, 56.52°, 62.10°, 70.48° and 73.51° correspond to the (111), (220), (311), (222), (400), (422), (511), (440), (620) and (533) crystal planes of ZnFe2O4 (JCPDS NO. 22-1012), respectively. Meanwhile, the peaks observed at 2θ = 31.54°, 34.22°, 36.00°, 47.37° and 67.71° can be attributed to crystalline ZnO (JCPDS NO. 36-1451). The diffraction peak of 41.88° in ZFG500 is associated with the (200) crystal plane of FeO (JCPDS NO. 06-0615). Of note, no typical peaks of rGO (002) or GO (001) were observed in ZFG500, due to the fact that GO was reduced to rGO and the rGO sheets were exfoliated by ZnFe2O4 NPs [41, 42]. Figure 2(b) displays the patterns of ZFG300, ZFG400, and ZFG600. It can be clearly seen that the diffraction peak intensity of ZnFe2O4 enhances gradually with the increasing calcination temperature.
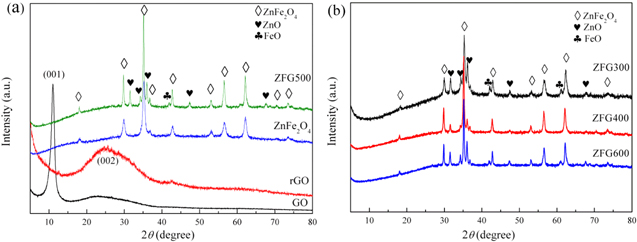
Figure 2. (a)XRD patterns of GO, rGO, ZnFe2O4 and ZnFe2O4/rGO composite calcined at 500 °C (ZFG500). (b) XRD patterns of ZnFe2O4/rGO composites calcined at 300 °C (ZFG300), 400 °C (ZFG400) and 600 °C (ZFG600).
Download figure:
Standard image High-resolution imageBased on the XRD results, the crystal sizes of ZnFe2O4 were estimated from the FWHM (full width at half maximum) of the diffraction peaks of (311) by the well known Scherrer equation and summarized in table 1. The grain sizes of ZnFe2O4 in composites were increased from 27.2 nm to 37.4 nm with the increasing calcination temperature. Because the negative charge environment of the GO surface serves as anchoring and nucleation sites, positively charged metal ions are required to participate in the nucleation and growth of ZnFe2O4, which ultimately leads to a bigger crystal size of ZnFe2O4 in ZnFe2O4/rGO composites than pure ZnFe2O4 [7].
Table 1. The average grain size of ZnFe2O4 (D) for pure ZnFe2O4 and ZnFe2O4/rGO calcined at different temperatures.
| Sample | ZFG300 | ZFG400 | ZFG500 | ZFG600 | ZnFe2O4 |
|---|---|---|---|---|---|
| D(311) (nm) | 27.2 | 29.0 | 33.2 | 37.4 | 14.0 |
3.2. FT-IR and Raman spectroscopy
The chemical components of samples were confirmed by FT-IR and Raman spectroscopy. Figure 3(a) shows the FT-IR spectra of the materials. The absorption bands of GO at 3369 cm−1, 1734 cm−1, 1224 cm−1 and 1055 cm−1 are indexed to the stretching vibrations of O–H of water, C=O of carboxyl and carbonyl, C–O of carboxyl and C–OH, respectively [40, 43, 44]. Usually, the absorption band of GO at 1620 cm−1 is attributed to the bending vibration of O–H of adsorbed water [45]. For pure ZnFe2O4, the absorption bands observed at 549 cm−1 and 423 cm−1 can be assigned to the tetrahedral Zn2+ (Zn–O) stretching vibration and octahedral Fe3+ (Fe–O) stretching vibration, respectively. The absorption band at 1627 cm−1 is related to the O–H bending vibration of water. In the case of ZFG500, the absorption bands for oxygen functional groups of GO are markedly weakened or disappear, implying the substantial reduction of GO after the reduction reaction. The weak absorption bands located at 1382 cm−1 and 1124 cm−1 are attributed to the bending vibration of O–H and stretching vibration of C–O–C, respectively. Meanwhile, new bands of Zn–O and Fe–O stretching vibrations are observed at 562 cm−1 and 436 cm−1 respectively, which suggests the existence of ZnFe2O4. Furthermore, a weak band appearing at 1582 cm−1 is due to the conjugate C=C skeletal stretching vibration of rGO in the ZFG500 [8]. Combined with the results of XRD, it further proves that the ZnFe2O4/rGO composites were successfully prepared.
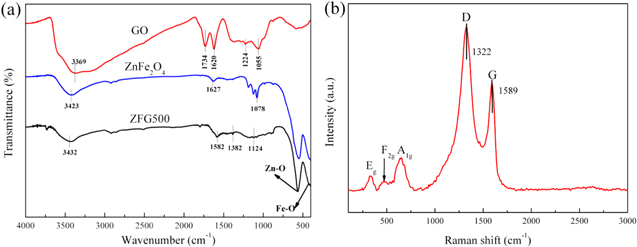
Figure 3. (a) FT-IR spectra of GO, ZnFe2O4 and ZnFe2O4/rGO composite calcined at 500 °C (ZFG500). (b) Raman spectrum of ZnFe2O4/rGO composite calcined at 500 °C (ZFG500).
Download figure:
Standard image High-resolution imageThe Raman spectrum of ZFG500 is depicted in figure 3(b). The two prominent peaks at 1322 cm−1 (D peak) and 1589 cm−1 (G peak) are attributed to rGO. The ID/IG intensity ratio could be a measure of disorder degree and the average size of the sp2 domains in graphite materials [46, 47]. The ID/IG ratio for ZFG500 is about 1.5, which indicates the presence of localized sp3 defects in the rGO network. The three active Raman modes (A1g + Eg + F2g) in the 100 ∼ 1000 cm−1 region can be ascribed to the spinel ZnFe2O4 phase, indicating the presence of ZnFe2O4 in the ZFG500 composite.
3.3. Morphology
The morphology of ZFG500 and pure ZnFe2O4 were investigated by TEM. The image of pure ZnFe2O4 is shown in figure 4(a). Due to the aggregation of bare ZnFe2O4 NPs, the observed particle size is larger than the grain size of the XRD calculation. As can be seen from figure 4(b) for the TEM graph of the representative ZFG500, ZnFe2O4 NPs were densely grown on the crumpled rGO substrates without aggregation. Figure 4(c) clearly demonstrated that the rGO sheets were decorated homogeneously by ZnFe2O4 NPs with a diameter of 20 ∼ 40 nm, which is consistent with the results obtained by the Dubye-Scherrer formula. The high resolution TEM image of ZFG500 is presented in figure 4(d). It shows that the crystal lattice has distance of 0.252 nm and 0.296 nm, which correspond to (311) and (220) planes of ZnFe2O4 crystals, respectively.

Figure 4. (a) TEM image of bare ZnFe2O4. (b and c) TEM image of ZnFe2O4/rGO composite calcined at 500 °C (ZFG500). (d) HRTEM image of ZnFe2O4/rGO composite calcined at 500 °C (ZFG500).
Download figure:
Standard image High-resolution imageFigure 5 shows the high magnification TEM images of ZFG300 (a), ZFG400 (b), ZFG500 (c), and ZFG600 (d). The ZnFe2O4 NPs and layered rGO were observed in samples calcined at 300 °C, 400 °C, 500 °C and 600 °C. It could be presumed from the darker colour portions of images that there are different degrees of stacking for the layered rGO in the composites. The ZFG300, ZFG400, ZFG500 and ZFG600 samples have ZnFe2O4 particle sizes of 15 ∼ 35 nm, 20 ∼ 40 nm, 20 ∼ 40 nm, and 25 ∼ 50 nm, respectively, which are consistent with the average grain sizes calculated by XRD.

Figure 5. TEM images of ZnFe2O4/rGO composites calcined at (a) 300 °C (ZFG300). (b) 400 °C (ZFG400). (c) 500 °C (ZFG500). (d) 600 °C (ZFG600).
Download figure:
Standard image High-resolution image3.4. XPS analysis
The chemical state of the elements in ZFG500 before and after photocatalytic reactions were measured by XPS. It is obvious that the elements of Zn, Fe, C and O coexist in ZFG500, figure 6(a). The peaks of Zn 2p1/2 and Zn 2p3/2 are located at 1044.0 eV and 1020.9 eV (figure 6(b)), indicating that the Zn (II) oxidation state exists in the composite [48]. Simultaneously there is no significant change in the binding energy of Zn 2p before and after reactions, which shows that zinc ions have good stability on the catalyst surface. Figure 6(c) shows Fe 2p1/2 peak located at 724.4 eV, and four peaks at 709.7 eV, 710.9 eV, 712.0 eV and 713.7 eV were fitted for the Fe 2p3/2 [49, 50]. The peak value of 709.7 eV was ascribed to the existence of Fe (II) oxidation, and the other three peaks were assigned to the Fe (III) oxidation [51]. In addition, the peaks at 732.7 eV and 718.7 eV were attributed to shake-up satellite structures [52]. Based on the corresponding peak area, the proportion of Fe (II) area decreased from 23% to 19.3% (figure 6(d)) after five repeated reaction runs, possibly due to the reaction of Fe (II) with ·OH to form Fe (III) [53]. Figure 6(e) displayed three main peaks of O 1s with binding energy of 531.3 eV, 530.2 eV and 529.3 eV, which could be assigned to the residual oxygen-containing groups (epoxy and hydroxyl), adsorbed water, and lattice oxygen bonding with Fe and Zn (denoted as Fe–O and Zn–O), respectively [40, 47]. The peaks of C 1s were found at 288.2 eV, 285.3 eV, 284.0 eV and 283.5 eV in figure 6(f), which could be attributed to C=O bonds, C–O bonds (epoxy and hydroxyl), C–C bonds, and C=C bonds, respectively [54, 55].

Figure 6. XPS spectra of ZnFe2O4/rGO composite calcined at 500 °C (ZFG500): (a) survey scan. (b) Zn 2p XPS spectrum. (c) Fe 2p XPS spectrum. (d) Fe 2p XPS spectrum after five cycles. (e) O 1s XPS spectrum. (f) C 1s XPS spectrum.
Download figure:
Standard image High-resolution image3.5. Optical and magnetic properties
The optical absorption properties of catalysts is shown in figure 7. As shown in figure 7(a), ZnFe2O4 has remarkable absorbance in the 200 ∼ 700 nm range. In comparison with ZnFe2O4, ZFG500 exhibited significantly improved visible absorption capability after the introduction of rGO. The band gap energy (Eg) of the photocatalyst can be estimated according to the Kubelka-Munk equation [32]:

where α is the absorption coefficient, hv is the energy of the incident photon, Eg is the band gap energy (eV), and n is a constant, respectively. From figure 7(b), the Eg of bare ZnFe2O4 was estimated to be 1.9 eV. Because of the strong absorption of ZFG500 in the visible region, the Eg of ZFG500 reduces to 1.6 eV. Literature reports that the red shift of the absorption band in the visible light region was beneficial to enhance the photocatalytic activity of the catalysts [56].
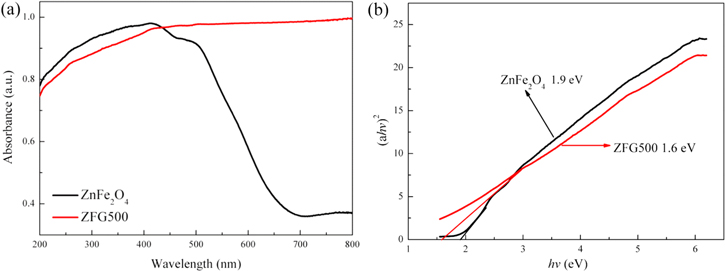
Figure 7. (a) UV–vis diffuse reflectance spectra of ZnFe2O4 and ZnFe2O4/rGO composite calcined at 500 °C (ZFG500). (b) The evaluation of the band gap energy of ZnFe2O4 and ZnFe2O4/rGO composite calcined at 500 °C (ZFG500).
Download figure:
Standard image High-resolution imageThe magnetic property is vital for a recyclable photocatalyst. The hysteresis loops of ZnFe2O4 and ZFG500 were measured by VSM at room temperature, as shown in figure 8. The saturation magnetization (Ms) of ZFG500 is 47.7 emu g−1 while the coercivity is 107.6 Oe, revealing the soft magnetic properties of the ZFG500 composite. However, due to the small grain size, pure ZnFe2O4 did not show the hysteresis loop, indicating that pure ZnFe2O4 has paramagnetic properties [45]. As seen in the inset picture, the ZFG500 catalyst was quickly separated by an external magnet.

Figure 8. Room temperature magnetization curves of ZnFe2O4 and ZnFe2O4/rGO composite calcined at 500 °C (ZFG500), the inset shows that ZFG500 catalyst can be separated easily by a magnet.
Download figure:
Standard image High-resolution image3.6. BET surface area and pore size distribution
The N2 adsorption-desorption isotherms and the BJH pore size distribution of ZnFe2O4/rGO composites are shown in figure 9. The N2 adsorption-desorption isotherms of ZnFe2O4/rGO composites can be assigned to type IV with H3 hysteresis loops observed at relative pressure of 0.43 ∼ 1.0, which reveal the presence of mesoporous and slit-like pores in the composites [57]. The BET surface areas were calculated to be 36.5 m2 g−1 for ZFG300, 32.6 m2 g−1 for ZFG400, 31.1 m2 g−1 for ZFG500 and 21.0 m2 g−1 for ZFG600, respectively. Noticeably, the higher calcination temperature, the smaller specific surface area of the samples obtained. The phenomenon can be interpreted by the fact that the particle size of ZnFe2O4 increases with the increasing of calcination temperature, resulting in a decrease in the specific surface area of the materials. Furthermore, the pore size distribution of all ZnFe2O4/rGO products was estimated to be about 3 ∼ 4 nm from the desorption curves of the isotherms.

Figure 9. N2 adsorption-desorption isotherms and the corresponding BJH pore size distribution plots (inset) of ZnFe2O4/rGO composites calcined at different temperatures: (a) 300 °C (ZFG300). (b) 400 °C (ZFG400). (c) 500 °C (ZFG500). (d) 600 °C (ZFG600).
Download figure:
Standard image High-resolution image3.7. Photocatalytic performance
The photocatalytic removal of MB under H2O2/visible light systems using ZnFe2O4/rGO composites and bare ZnFe2O4 as catalysts was investigated. The adsorption properties of different catalysts for MB were first evaluated. After dark adsorption for 1 h, the adsorption efficiency of MB by ZFG300, ZFG400, ZFG500 and ZFG600 are 49%, 43%, 38% and 34%, respectively (figure 10(a)), which was supported by the experimentally observed results of BET surface area measurement of the ZnFe2O4/rGO composites. On the other hand, bare ZnFe2O4 showed only 23% adsorption capacity after 1 h. It can be explained that during the adsorption process, the dye molecules were transferred from the bulk solution to the catalyst surface and the sp2 hybridized structure of rGO allows preferential absorption of aromatic components contained in MB molecules through non-covalent π-π stacking interactions [58, 59].

Figure 10. (a) Variation in the adsorption of MB over the as-synthesized catalysts. (b) Photocatalytic degradation of MB over the as-synthesized catalysts under visible light (photocatalyst concentration = 0.5 g L−1, initial c(MB) = 20 mg L−1, H2O2 dosage = 0.5 ml).
Download figure:
Standard image High-resolution imageAfter the dark adsorption, the adsorption-desorption equilibrium solutions were used as the starting solution, and the concentration changes of MB against the irradiation time was evaluated as shown in figure 10(b). MB showed approximately 15% degradation after 60 min under visible light irradiation using bare ZnFe2O4, while MB degradation rate was 22% with the help of H2O2. This is because the dissociation of H2O2 under visible light (420 < λ < 550 nm) produces free hydroxyl radicals (·OH), which attack the MB framework and initiate MB degradation [60, 61]. However, the photocatalytic activity of ZnFe2O4 was improved to 32% after 60 min by the introduction of H2O2 under visible light, due to the formation of more ·OH radicals by the reaction of ZnFe2O4 with H2O2 or the direct oxidation of MB by the photo-induced holes (h+). From figure 10(b), a very small amount of MB was degraded by ZFG500-H2O2 in dark. As is well known, the Fenton reaction could promote the formation of ·OH radicals to some extent [53]. However, the recovery of Fe2+ through reaction (10) is extremely slow [62], and there is no UV light in the reaction system to be employed for the generation of Fe2+ through reaction (3).

The MB degradation rate by the ZFG500 catalyst is 26% after 180 min with visible light, and was significantly enhanced when adding H2O2 to the reaction system. The degradation rate of MB was 65% after irradiation for 15 min and reached 98% after irradiation for 180 min. During irradiation, the photo-generated electrons (e−) can immediately be transferred from the conduction band of ZnFe2O4 to rGO and then react with H2O2 to generate massive ·OH radicals, which serve as a strong oxidant for the degradation of MB dye. Meanwhile, the h+-e− pairs recombination was dramatically suppressed in the catalysts due to the faster electron-migration process, and then the photocatalytic efficiency was enhanced. Of note, the H2O2-assisted ZnFe2O4/rGO catalysts exhibited similar photocatalytic activity, indicating that H2O2 and rGO play a key role in the photocatalytic reactions. The results suggests that rGO not only prevent the agglomeration of ZnFe2O4 NPs as a support but also promote the separation of photo-generated carriers.
To further investigate the photocatalytic processes, the kinetics for the degradation of MB by ZnFe2O4/rGO catalysts were carried out. A second-order kinetics model was used to describe the photocatalytic processes as following [62]:

where t is the visible light exposure time, k is the second-order apparent rate constant, C0 is the concentration at adsorption equilibrium, and C is the residual concentration of MB. The apparent rate constant k is the basic kinetics parameter which can reflect the photocatalytic activity of different catalysts [63], and the fitting results of second-order kinetics are shown in figure 11(a). The k were calculated to be 0.0106 L mg−1 min−1 for ZFG300, 0.0054 L mg−1 min−1 for ZFG400, 0.0209 L mg−1 min−1 for ZFG500 and 0.0133 L mg−1 min−1 for ZFG600. The ZFG500 has the fastest rate of apparent rate constant, indicating that ZFG500 has the relatively best photocatalytic performance. From the kinetics analysis, the photocatalytic activity of the catalyst decreases first and then increases gradually with the increase of calcinations temperature, and the best catalytic effect is obtained at calcination temperature of 500 °C. It can be assumed that the photocatalytic activity of the catalyst is not only related to the specific surface area of the catalyst, but also to the crystallinity of ZnFe2O4 NPs.

Figure 11. (a) The second-order kinetics fitting over catalysts calcined at different temperatures for MB degradation under visible light. (b) The second-order kinetics fitting on the amount of catalyst (H2O2 dosage = 0.5 ml, initial c(MB) = 20 mg L−1). (c) The second-order kinetics fitting on initial MB concentration (H2O2 dosage = 0.5 ml, ZnFe2O4/rGO (ZFG500) concentration = 0.5 g L−1). (d) The second-order kinetics fitting over catalysts calcined at different temperatures for MB degradation under simulated solar light (photocatalyst concentration = 0.5 g L−1, initial c(MB) = 20 mg L−1, H2O2 dosage = 0.5 ml).
Download figure:
Standard image High-resolution imageThe effect of the amount of ZFG500 catalyst and the initial MB concentration on the degradation kinetics of MB were firstly investigated. As shown in figures 11(b) and (c), the degradation reactions followed second-order kinetics. The maximum apparent rate constant was obtained when 0.5 g L−1 of ZFG500 catalyst was used. The light scattering factor with an increase in the density of the suspension may be the reason for the observed decrease in the photocatalytic activity when increasing the catalyst concentration of above 0.5 g L−1 [64]. In addition, as the initial concentration of MB increases, the apparent rate constant decreases.
Next, the degradation of MB by catalysts calcined at different temperatures was also studied under simulated solar light. Figure 11(d) shows the fitting results of second-order kinetics for different catalysts. The photocatalytic reaction apparent rate constants (k) on ZFG300, ZFG400, ZFG500, and ZFG600 are in turn 0.0520 L mg−1 min−1, 0.0544 L mg−1 min−1, 0.0828 L mg−1 min−1, and 0.0613 L mg−1 min−1. The results show that the k values of different catalysts are on the same order of magnitude. ZFG500 still shows the best photocatalytic activity in simulated solar light, which demonstrates that the optimum calcination temperature is 500 °C. Compared with visible light catalysis, the photocatalytic efficiency of the catalysts is significantly enhanced in simulated solar light because the extra ultraviolet light promotes the progress of photocatalysis.
Finally, the effect of H2O2 dosage and the universality of the obtained catalysts for the removal of different types of dye were determined (figures 12(a)–(c)). It can be seen that the degradation efficiency of the photocatalyst on dyes first increases and then decreases with the increasing H2O2 dosage. The decrease of degradation efficiency may be ascribed to the unfavourable consumption of ·OH radicals by the excess H2O2, a reaction that scavenges ·OH radicals and generates ·HO2, the latter of which would also react with ·OH to form H2O and O2 [60, 65]. When the dosage of H2O2 in the reaction system was 0.3 ml, maximum degradation efficiencies were obtained after 180 min under visible light. Figure 12(d) shows the digital images of colour changes (MB, MO and RhB) during the visible light irradiation. It can be seen that as the illumination time increases, the dyes solutions are obviously discoloured. At the same time, the experimental results revealed that the ZFG500 photocatalyst has better efficiency on cationic dyes (MB and RhB) which are much easier to be adsorbed on the anionic catalysts than anion dyes (MO).
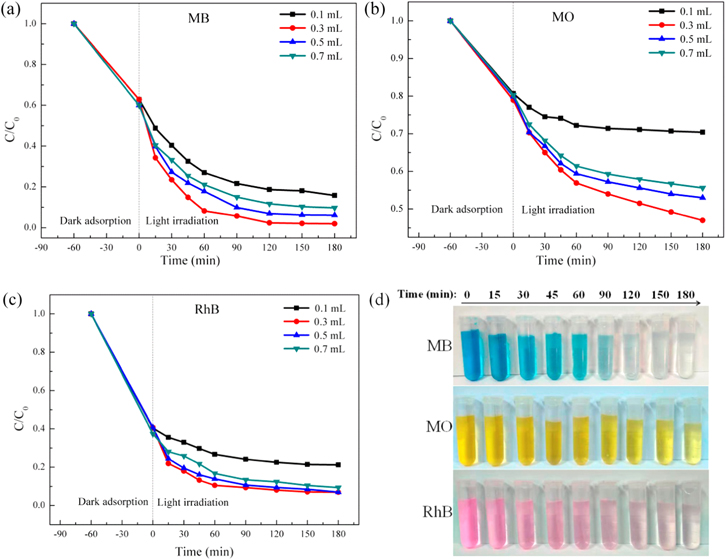
Figure 12. (a) Effect of the H2O2 dosage on the MB degradation. (b) Effect of the H2O2 dosage on the MO degradation. (c) Effect of the H2O2 dosage on the RhB degradation. (Initial dye concentration = 20 mg L−1, ZnFe2O4/rGO (ZFG500) concentration = 0.5 g L−1). (d) Digital images of colour changes during the visible light irradiation (initial dye concentration = 20 mg L−1, ZnFe2O4/rGO (ZFG500) concentration = 0.5 g L−1, H2O2 dosage = 0.3 ml).
Download figure:
Standard image High-resolution image3.8. Mechanism
To identify the main reactive oxidants responsible for the degradation of MB, trapping experiments were performed. Silver nitrate (AgNO3), isopropyl alcohol (IPA) and sodium oxalate (Na2C2O4) were used to capture the photo-generated e−, ·OH radicals and photo-generated h+, respectively [53, 65]. As depicted in figure 13, in the absence of scavengers, MB was almost completely degraded by ZFG500. The degradation efficiency of MB decreased significantly with the addition of AgNO3 because of the capture of photo-generated e− by  which leads to a decrease in the generation of ·OH radicals. The degradation of MB also decreased considerably with the addition of IPA while Na2C2O4 slightly decelerated the photocatalytic reaction. It should be pointed out that the addition of IPA has a greater negative impact on photocatalytic degradation than AgNO3, indicating that ·OH radicals are the major species responsible for the oxidation of MB. Moreover, the ·OH radicals are mainly derived from the reaction of photo-generated e− with H2O2, and the Fenton reaction also contributes.
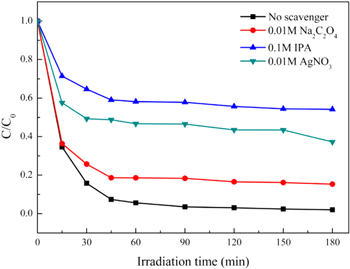
Figure 13. Effect of scavengers on MB degradation under visible light (ZnFe2O4/rGO (ZFG500) concentration = 0.5 g L−1, initial c(MB) = 20 mg L−1, H2O2 dosage = 0.5 ml; scavengers concentration: AgNO3 = 0.01 mol L−1, IPA = 0.1 mol L−1, Na2C2O4 = 0.01 mol L−1).
Download figure:
Standard image High-resolution imageThe possible expected routes to achieve an enhanced photocatalytic degradation of MB using ZnFe2O4/rGO photocatalysts under visible light exposure are discussed as follows (see also figure 14).

Figure 14. Schematic diagram of the dye degradation mechanism on ZnFe2O4/rGO catalyst under visible light irradiation.
Download figure:
Standard image High-resolution image3.8.1. Semiconductor mediated photo-degradation process
When ZnFe2O4 was radiated by visible light with the photon energy higher or equal to the band gaps of ZnFe2O4, the electrons in the valence band could be excited to the conduction band with simultaneous generation of the same amount of holes (h+) in the valence band (reaction (5)). The conduction band electrons (e−) immediately transferred from ZnFe2O4 to the surface of rGO sheets (reaction (6)) through internal diffusion and surface migration because the conduction band of graphene (−0.75 V versus normal hydrogen electrode (NHE)) [66] is more positive than that of ZnFe2O4 (−1.54 V versus NHE) [67]. It can be seen from figures 10(b) and 12 that the presence of H2O2 had a significant influence on the catalytic efficiency and the trapping experiments (figure 13) proved that the hydroxyl radicals (·OH) are the main active species catalysed by visible light. H2O2 in the solutions were continuously adsorbed to the catalyst surface and participated in the photocatalytic reaction. The e− transferred from the conduction band of ZnFe2O4 to rGO could be captured by H2O2 (E0 (H2O2/·OH) = +0.38 V versus NHE) [60] to generate ·OH radicals (reaction (7)), rather than reacting with dissolved O2 to form  (E0 (O2/
 ) = −0.33 V versus NHE) [52]. Finally, the generated ·OH radicals and the h+ left in the valence band of ZnFe2O4 acted as strong oxidants to initiate the degradation of organic dyes in aqueous solution (reaction (8)). By this method, the recombination of h+-e− pairs was effectively suppressed, and the dye was effectively degraded.


3.8.2. Fenton process [62, 68]
From figure 10(b), the degradation of MB was observed in the dark with the catalysis of ZFG500 and H2O2, indicating that the active species independent of the visible light were produced. The H2O2 adsorbed on the catalyst surface were directly trapped by the Fe3+ to form Fe2+ (reaction (9)), which could react with H2O2 to produce ·OH radicals and Fe3+ (reaction (10)). However, the recovery of Fe2+ through reaction (9) is extremely slow. Upon illumination of visible light, the reaction (7) consumed most of the H2O2 to generate ·OH radicals, so the production of ·OH radicals through the Fenton process was limited by the competitive reaction on the surface of catalyst. Lastly, the dye was slightly degraded by the generated ·OH radicals (reaction (11)).


3.9. Reusability test
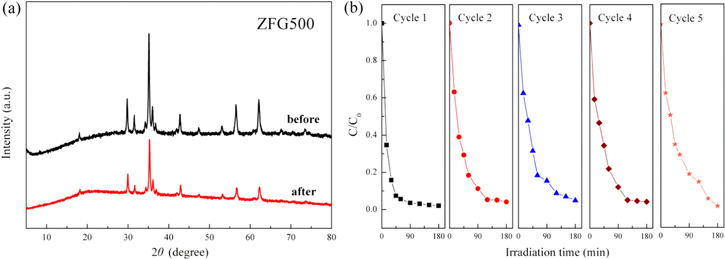
In order to examine the stability and reusability of the as-prepared photocatalysts, ZFG500 was selected for a cyclic decomposition experiment. As shown in figure 15(a), the XRD analysis of the ZFG500 catalyst before and after five repetitive reactions was carried out. It was found that the main diffraction peaks of the recycled sample have no obvious change, which indicated that the ZnFe2O4/rGO composites have stable crystal structures. The repeated photocatalytic results are given in figure 15(b). After 180 min of light irradiation, the degradation rate of MB is still over 90% after five cycles, indicating a stable photocatalytic ability of the ZnFe2O4/rGO catalysts.
Figure 15. (a) XRD patterns of ZFG500 catalyst before and after five cycles. (b) The repeated photocatalytic experiments (initial c(MB) = 20 mg L−1, H2O2 dosage = 0.5 ml, ZnFe2O4/rGO (ZFG500) concentration = 0.5 g L−1).
Download figure:
Standard image High-resolution image
4. Conclusions
Fabrication of magnetic ZnFe2O4/rGO composites was achieved via a modified sol-gel method combined with an appropriate calcination treatment. XRD measurements suggested that the synthesized products mainly consist of ZnFe2O4 and some impurities such as ZnO and FeO. The ZnFe2O4/rGO composites had stronger absorption in the whole visible region than the bare ZnFe2O4, which was beneficial for enhancing photocatalytic activity. The photo-degradation of organic dyes in the ZnFe2O4/rGO catalyst/H2O2 systems under visible light followed second-order kinetics. The degradation rates for the system were much higher than those obtained in ZnFe2O4/H2O2 with visible light. The determined degradation of MB using different scavengers demonstrated that ·OH radicals were the main reactive species responsible for the degradation of organic dyes. The roles of the rGO to these favourable catalytic performances were likely due to improved adsorption of the pollutants to the catalyst and enhanced separation of photo-generated h+-e− pairs. Moreover, the ZnFe2O4/rGO composites retained stable crystal structures and excellent photocatalytic durability in repeated batch runs.
Acknowledgments
The authors acknowledge the financial support provided by Major Science and Technology Project of Wenzhou (ZG2017029), National Natural Science Foundation of China (51604242), Joint Fund of Zhejiang Provincial Natural Science Foundation-Qingshan Lake Science and Technology City (LQY19E020002), Zhejiang Provincial Natural Science Foundation (LY18E020015, LY18E020014), Science and Technology Innovation Projects on Water Pollution Control and Management of Wenzhou (W20170005) and Preferred Foundation of Postdoctoral Scientific Research Project of Zhejiang Province (zj20180044).