

Abstract
In the current work, we report on the synthesizing of a series of novel nanocomposite materials obtained by functionalizing the SBA-15 silica matrix with anchored iron phosphonate molecules and the following thermal treatment. The obtained results reveal the formation of a unique amorphic layer of Fe-based compounds on the surface of silica walls of SBA-15 channels as a result of the organic groups' decomposition after moderate thermal treatment. Due to their unique structure, represented in an active Fe-containing amorphous coating spread over a large surface area, these materials are of great interest for their potential applications in fields such as catalysis, adsorption, and non-linear optics. The obtained materials remain amorphous, preserving the SBA-15 mesoporous structure up to temperatures of approximately 800 °C, after which the partial melting of the silica backbone is observed with the simultaneous formation of nanocrystals inside the newly-formed glassy mass. All obtained materials were characterized using such techniques as thermogravimetry, transmission and scanning electron microscopy combined with energy dispersive x-ray spectroscopy mapping, Raman spectroscopy, N2 sorption analysis, x-ray diffraction, x-ray photoelectron spectroscopy, Mössbauer spectroscopy, and SQUID measurements.
Export citation and abstract BibTeX RIS

Original content from this work may be used under the terms of the Creative Commons Attribution 4.0 licence. Any further distribution of this work must maintain attribution to the author(s) and the title of the work, journal citation and DOI.
List of abbreviations
| acac | acetylacetonate |
| BET | Brunauer–Emmett–Teller method |
| BJH | Barret-Joyner- Halenda method |
| BrTMS | bromotrimethylsilane |
| ClTMS | chlorotrimethylsilane |
| D | pore diameters |
| Dhex | average distances between atoms, calculated for the hexagonal 2D lattice |
| Dsq | average distances between atoms, calculated for the square 2D lattice |
| DTG | differential thermogravimetric analysis |
| EDS | energy dispersive x-ray spectroscopy |
| FC | field cooling mode |
| IS | isomer shift |
| m | mass of the sample and |
| MT | assumed molar mass based on TGA results |

| molar mass of 10SiO2 + FePO4 |
| NA | Avogadro's number. |

| the number of Fe ions |
| NBO | natural bond orbital |
| P123 | poly(ethylene glycol)-block-poly(propylene glycol)-block-poly(ethylene glycol) |
| PPTES | 3-(diethylphosphonate)propyl-triethoxysilane |
| QS | quadrupole splitting |
| S | specific surface area, |
| SBA-15 | Santa Barbara Amorphous |
| SEM | scanning electron microscopy |
| STEM | scanning transmission electron microscope |
| TGA | thermal gravimetric analysis |
| TEM | transmission electron microscopy |
| TEOS | tetraethoxysilane |
| THF | tetrahydrofuran |
| V | pore volume |
| XRD | x-ray diffraction |
| XPS | x-ray photoelectron spectroscopy |
| w | narrow line width |
| WT | is the relative residual mass after the heating |
| ZFC | zero-field cooling mode |
1. Introduction
Nanostructures are considered to have a strong prospective in many different areas, notably in industrial applications, including site remediation [1]. From many variable nanostructures, the greatest advantage is the gaining of nanoparticles, whose remediation-related capabilities include their small size (1–100 nm), providing features that cannot be achieved by bulk materials. Enormous large surface areas and high surface reactivity, in combination with magnetic and strong catalytic properties typically observed for iron or iron oxides, [2–7] can be considered effective reductants and catalysts for the transformation of such environmental contaminants as chlorinated organic compounds as well as anions (for example, NO3 −, Cr3O3 2−), heavy metals (for example, Ni2+, Hg2+), radionuclides (for example, UO2 2+) and metal ions [8–10]. Magnetic properties ensure the immobilization of metals on the nanoparticles' surface, including Cr, Hg, As [11]. Another idea for the fabrication of environmentally-friendly materials is to develop a magnetically reversible catalyst in which the magnetical core equips the substrate for further deposition of catalytical units. Such material allows control of the catalyst's position in the solution and after the reaction [12, 13]. Iron-based nanoparticles also found significant application during the oxidizing reaction of different contaminants or wastewaters, considering the so-called Fenton reaction, i.e., a combination of hydrogen peroxide and ferrous iron. This approach is applied to treat post-industrial water pollution in the pharmaceutical and agriculture industries [14–17].
Unfortunately, low-dimension nanoparticles are prone to easy and effective transport by the groundwater flow or tend to agglomerate due to remaining in suspension for extended periods. As a result, their positive environmental impact is highly decreasing. Therefore, one of the other ideas for engineering a new class of remediation-important materials turned out to be immobilized ions in slurry reactors, such as organic: polymers, or inorganic: silica, metal oxides, activated carbon, or zeolite [13, 18]. From this viewpoint, the most promising is SBA-15 (Santa Barbara Amorphous), containing micro- and meso- porous and hexagonally arranged cylindrical pores with a diameter of about 5 nm and a surface area of around 800 m2 g−1 [19–21]. Structurally, SBA-15 seems to be an excellent basis for the ultrahigh separation of active sites with great potential for pore wall functionalization through variable numbers and functional units.
Furthermore, introducing into the interior of the mesopores propyl- carbonate units allows the capture of group I metals (for example, Ag+, Pb2+), while propyl-phosphate allows di- and trivalent metals (for example, Cu2+, Fe2+, Fe3+) to be captured. Silica pore walls can also be modified using cyclam (1, 4, 9, 11 tetraazacyclodecane), possessing the ability to chelate metal chlorides: copper, chromium, cobalt, iron, nickel, etc. Furthermore, the individual approach to the synthesis creates the opportunity to homogeneously distribute the functional units inside silica pores. Developing multifunctional, universal, bio-friendly, and remediation-useful material is enormously complex. It is related to permanent alterations of the environmental conditions, i.e., an increase in the groundwater level due to solid and sustained rainfall, a decrease in the temperature due to the winter season, or uncontrolled spontaneous combustion. The temperature effect seems to be the most problematic because it may modify the structural and physicochemical properties of the individually engineered SBA-15 composites. Hence, SBA-15 is, on the one hand, a matrix for metal ion immobilization and, further, the remediation of pollutants. However, on the other hand, mesoporous SBA- 15 is a slurry nanoreactor in which metal ions immobilized inside the pore walls may recrystallize at suitable conditions (temperature, pH, humidity, and oxygen fugacity) and form nanometric-size particles [22–24]. It seems that environmental factors create a new structure with novel individual features.
Composite materials based on mesoporous silica and also Fe-containing compounds have shown the potential of their use in different environmental applications, particularly in pollutant adsorption and catalysis for the purifying of water and soil showing high efficiency and stability [25]. For instance, it has been demonstrated that a composite produced with a hydrothermal technique from SBA-15 mesoporous silica, benzene tricarboxylic acid, and iron sulphate act as an ultrafast and reusable adsorbent for the removal of methylene blue molecules from an aqueous solution [26]. Another example is the production of green iron nanoparticles supported on amino-functionalized silica, which was utilized to eliminate the azo dye methyl orange via adsorption and heterogeneous Fenton degradation [27]. Additionally, it has also been demonstrated that nanoscale core–shell structured zero-valent iron encapsulated in mesoporous silica is efficient in the simultaneous removal of various heavy metals from aqueous solution, indicating its potential use in the treatment of contaminated soil [28]. Generally, these materials have a high level of recyclability and thus have the potential for various environmental applications. In terms of environmental protection, using composites of mesoporous silica and materials based on iron shows significant potential.
This work focuses on preparing the material that will fuse the most remarkable properties of the two composite components via the implementation of active iron centres evenly distributed throughout the vast surface of SBA-15. A material with a high Fe atom separation on the SBA-15 surface may have a variety of advantages, such as a larger surface area for better efficiency as a catalyst or adsorbent, a more uniform distribution of metal on the surface for increased stability, and the potential of realization compounds on its surface that are not possible to produce in bulk form.
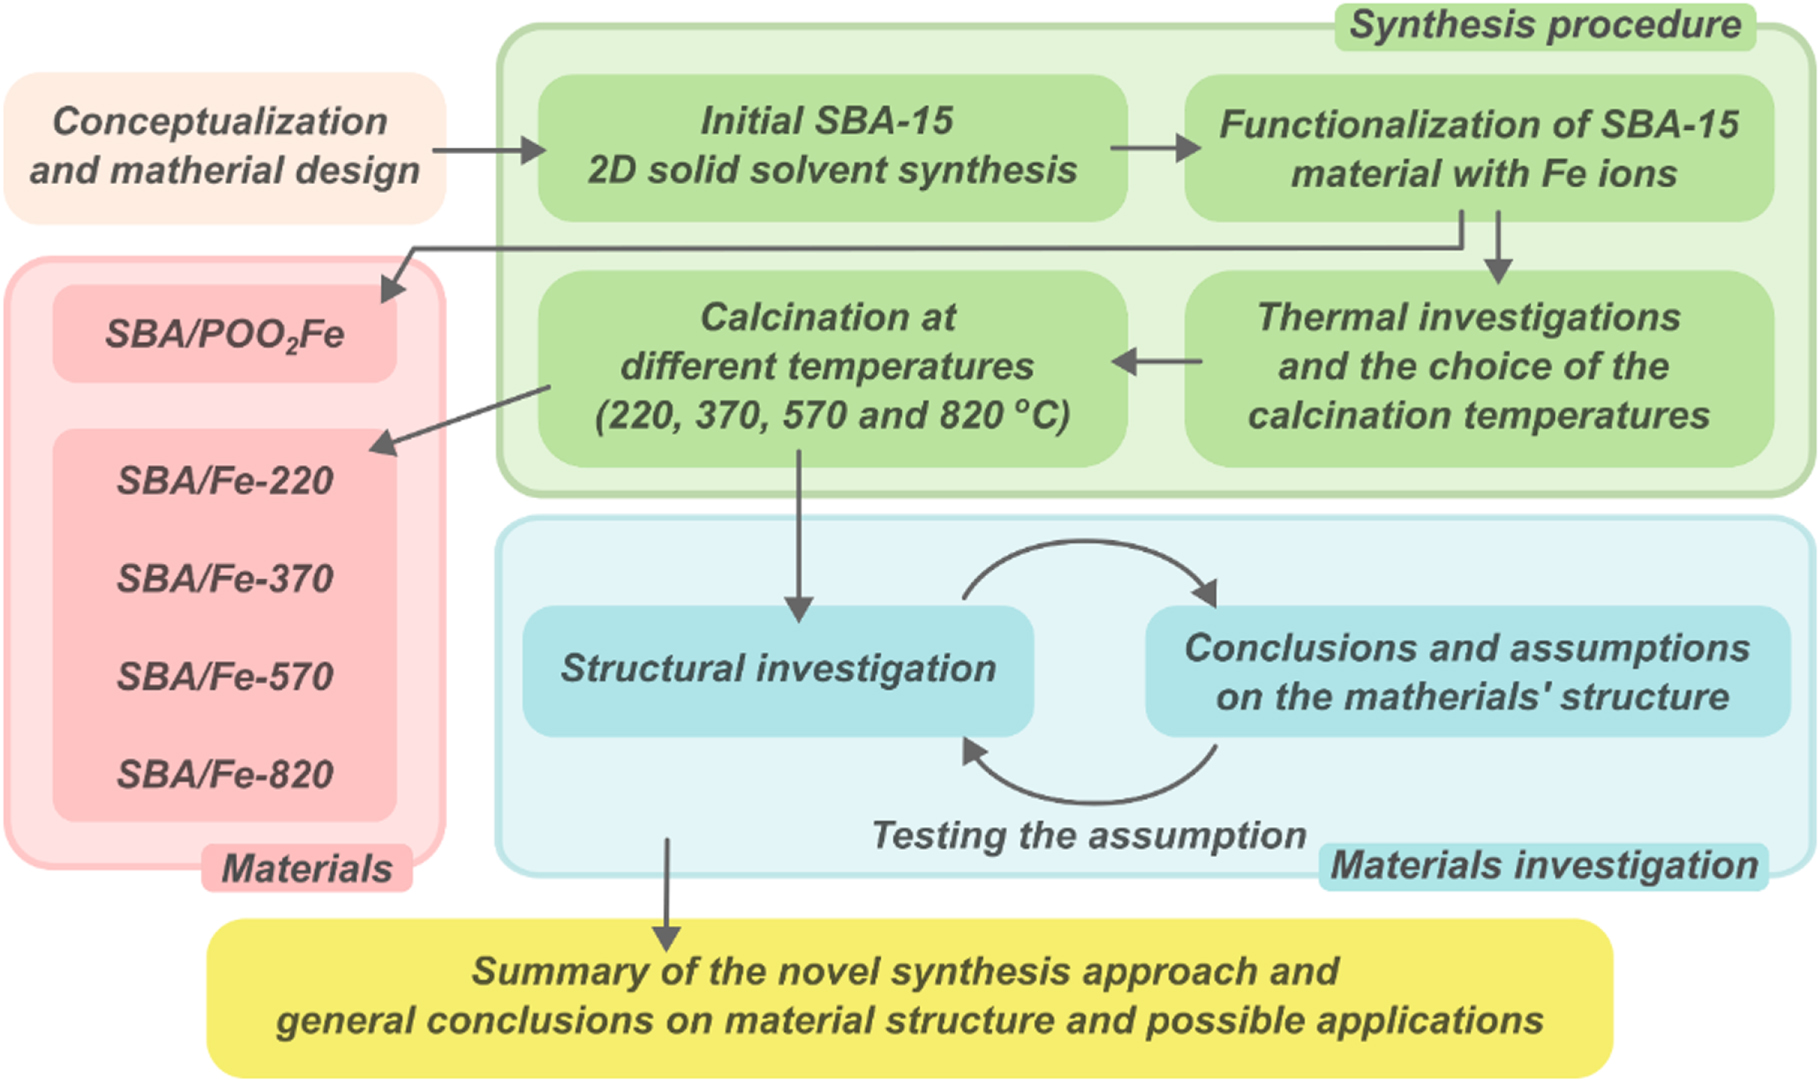
The general workflow of the presented research is depicted in figure 1 and is discussed in detail below. In order to synthesize a proposed material, we chose to focus, in our studies, on preparing the propyl-phosphonate and iron-doped SBA-15 silica as a potential remediation-sensitive material. This approach was based on the 2D solid solvents method to obtain the desired structure with iron's controlled and homogeneous distribution inside the pore walls [19, 29]. This approach was based on the simultaneous usage of two functional groups—active groups as anchoring sites for Fe ions and passive spacers for the passivation of a silica surface to obtain the possibility of precisely controlling the amount of bonded ions. Therefore, as an initial material, SBA-15 functionalized with Fe-propylphosphonate groups separated by trimethylsilane spacers was obtained (figure 2). In the following steps, the thermal behaviour at different temperatures was precisely studied. Annealing at different temperatures was provided to reproduce theoretical environmental conditions and fabricate SBA-15 nanocomposite with ferrihydrite-doped nanoparticles with an empirical formula from Fe3+ 10O14(OH)2. The idea to obtain ferrihydrite is related to its valuable adsorptive properties [30], involving compounds possessing phosphorous [31–33] and arsenic [33–35] as well as for a wide range of metals, such as uranium [36, 37] chromium [38], antimony [39], rare Earth metals [40] and others, such as, in some cases, nickel [41] and zinc [42]. Ferrihydrite, a precursor for most iron oxides in soil, plays a crucial role in catching contamination and cleaning up industrial pollution from soil [43]. Natural ferrihydrite, unfortunately, is thermodynamically unstable and transforms easily into hematite (Fe2O3) and goethite (FeO(OH)) [44]. Hence, a crucial problem was to stabilize ferrihydrite and prepare a highly remediation-sensitive material. In this context, the thermal properties were checked using thermal gravimetric analysis/differential thermogravimetric analysis (TGA/DTG), the structure and physicochemical properties followed using x-ray diffraction (XRD), Raman spectroscopy, scanning electron microscopy (SEM), energy dispersive x-ray spectroscopy (EDS), transmission electron microscopy (TEM), and Mössbauer and finally the pristine and ferrihydrite-doped SBA-15 analysed using magnetic studies.

Figure 1. Research methodology flowchart of the presented study.
Download figure:
Standard image High-resolution image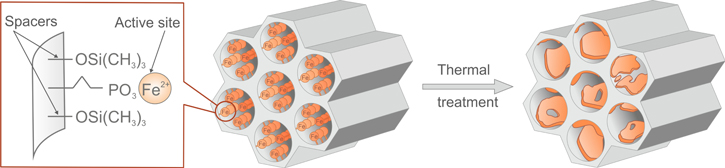
Figure 2. Schematic of the preparation of the desired material.
Download figure:
Standard image High-resolution imageThe synthesis and characterization of the novel series of nanomaterials based on SBA-15 mesoporous silica functionalized with Fe ions presented in this paper represents a significant advancement in the field of materials science. The unique aspect of this study comes from the successful incorporation of active Fe sites throughout the extensive surface area of the SBA-15 material, resulting in a material with a significant separation of Fe atoms on the SBA-15 surface, which was made possible by the thermal decomposition of anchoring iron propylphosphonate groups. Additionally, due to the flexibility of the synthesis process, it is possible to produce materials with specific characteristics by altering the synthesis settings or employing various metal ions. This approach can be applied to explore the synthesis of other nanocomposite materials with potentially remarkable characteristics which integrate the advantages of mesoporous silica with the reactivity and adaptability of the added metal ions, as well as other functionalities [45–48].
2. Materials and methods
2.1. Materials and synthesis
Iron phosphonate-functionalized SBA-15 silica was synthesized using the sol-gel approach for their synthesis [45–47] via co-condensation of tetraethoxysilane (TEOS) with 3-(diethylphosphonate)propyl-triethoxysilane (PPTES) as silica sources in the presence of poly-(ethyleneglycol)–poly-(propyleneglycol)–poly-(ethyleneglycol) block copolymer Pluronic P123 (poly(ethylene glycol)-block-poly(propylene glycol)-block-poly(ethylene glycol)) as a templating agent. This direct synthesis method of functionalized silica, in which the functional groups are introduced via the addition of the corresponding organoalkoxysilane during the condensation, is a convenient synthetic approach that provides the possibility to control the concentration of functional groups inside the silica matrix. A similar synthesis procedure was described in detail in the literature [22, 49] and illustrated in figure 3. The assumed molar concentration of propylphosphonate units inside the silica matrix is 10% molar in relation to Si atoms, which results from the molar TEOS to PPTES proportions that are 9:1. Before introducing and binding Fe ions into silica mesochannels, a silica surface modification procedure consisting of the following steps is required:
- surface hydroxyl units elimination via silylation with a toluene solution of ClTMS (chlorotrimethylsilane);
- hydrolysis of the diethylphosphonate into phosphonic acid groups via: the
- selective two-step process of treating with BrTMS (bromotrimethylsilane) in toluene and further heating in methanol-water solution;
- powder obtained at this stage was functionalized with Fe2+ ions via the reaction with the Fe(acac)2 (acac = acetylacetonate) in THF (tetrahydrofuran).
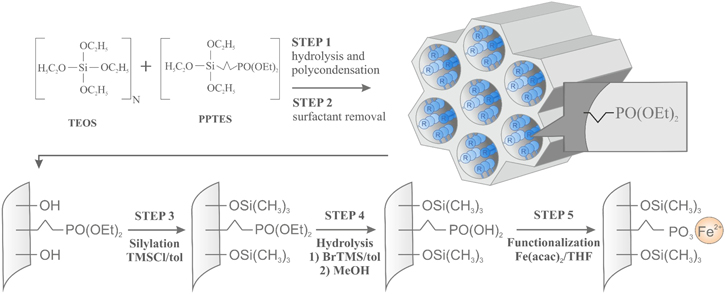
Figure 3. Schematic representation of the SBA-15 functionalized with Fe2+ ions via propylphosphonate group synthesis procedure.
Download figure:
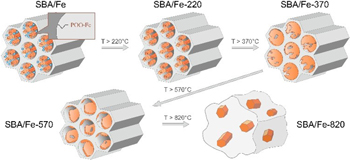
Standard image High-resolution imageAt the penultimate stage of the synthesis, a part of the material was also kept as a reference sample called SBA/PO(OH)2. This sample contains unfunctionalized phosphonic acid groups bound to silica walls by propyl chains. Regarding the fully-functionalized material, five series of samples on a base of the iron phosphonate functionalized SBA-15 silica as a starting material were prepared. The first series, called SBA/POO2Fe, is the starting material, not subjected to thermal treatment. The remaining powder was divided into four parts, which were subjected to different thermal treatments to investigate the thermal evolution of iron phosphonate located inside the SBA-15 silica mesochannels. These samples were heated at temperatures of 220 °C, 370 °C, 570 °C, 820 °C and were named SBA/Fe-220, SBA/Fe-370, SBA/Fe-570, SBA/Fe-820, respectively (table 1). The thermal decomposition of the initial material was carried out in air using a Nabatherm muffle furnace.
Table 1. General information on the synthesized materials.
| Samples | Preparation | Structure |
|---|---|---|
| SBA/PO(OH)2 | Co-condensation of TEOS and PPTES with following silylation and hydrolysis | SBA-15-like structure with propilphosphonic acid and trimethylsilyl groups attached to the silica walls |
| SBA/POO2Fe | Functionalization of SBA/PO(OH)2 with Fe ions | SBA-15-like structure with iron propylphosphonate and trimethylsilyl groups attached to the silica walls |
| SBA/Fe-220 | Calcination of SBA/POO2Fe at 220 °C | SBA-15-like structure with partially decomposed iron propylphosphonate and trimethylsilyl groups attached to the silica walls |
| SBA/Fe-370 | Calcination of SBA/POO2Fe at 370 °C | SBA-15-like structure with partially decomposed iron propylphosphonate and trimethylsilyl groups attached to the silica walls and amorphous Fe-containing thin coating on the silica walls |
| SBA/Fe-570 | Calcination of SBA/POO2Fe at 570 °C | SBA-15-like structure with amorphous Fe-containing thin coating on the silica walls |
| SBA/Fe-820 | Calcination of SBA/POO2Fe at 820 °C | Glass-like particles with incorporated ferrihydrite nanocrystals |
2.2. Characterisation methods
TGA was carried out under flowing synthetic air (N5.0) on a TA Instruments TGA 55OO high-resolution thermogravimetric analyser using open platinum 100 μl pans. The specimens were measured in a temperature range from ambient temperature to 900 °C with a maximum heating rate of 5 °C min−1.
The TEM/STEM analyses were performed using a Cs probe-corrected Titan Cubed G2 60-300 microscope (FEI) equipped with the ChemiSTEM™ system. STEM images were acquired using a high-angle annular dark-field detector. The STEM-EDS data was analyzed using Esprit software (Bruker) in which the standardless Cliff-Lorimer quantification method was used.
The SEM analyses were performed using a high-resolution Merlin Gemini II microscope (ZEISS) equipped with a Schottky field-emission gun and an EDS detector with a Quantax 800 microanalysis system (Bruker). The SEM images were obtained using a secondary electron detector.
EDS elemental analysis accompanied by SEM imaging was done by a scanning electron microscope Tescan Vega 3 equipped with a Bruker QUANTAX EDS detector.
The pore structure analysis is based on nitrogen gas adsorption/desorption isotherms obtained at 77 K utilizing an automatic Quantachrome Autosorb iQ instrument. Employing ASiQwin software, the specific surface area was determined using the Brunauer–Emmett–Teller (BET) method, and pore size distributions in the mesopore range were determined by the Barret–Joyner–Halenda (BJH) method. Physisorption measurements were preceded after outgassing of the samples under a vacuum at 110 °C for 14 h.
The structural properties of nanocrystallites inside the silica were analyzed by XRD performed using an X-PERT PRO Panalytical diffractometer operated at 40 kV and 30 mA with CuKα radiation of wavelength 1.541Å and standard (θ–2θ) geometry.
Raman spectra of the reference and SBA-15-POO2Fe annealed at 220 °C, 370 °C, 570 °C, 820 °C were gathered using a WITec confocal Raman microscope CRM alpha 300 R equipped with an air-cooled solid-state laser (λ = 532 nm) and a CCD camera. The excitation laser radiation was coupled into a microscope through a single-mode optical fiber with a 50 μm diameter. An air Olympus MPLAN (100×/0.90 NA) objective was used. Raman scattered light was focused onto a multi-mode fiber (100 μm diameter) and monochromator with a 600 line mm−1. Raman spectra were accumulated by 60 scans with an integration time of 40 s and a resolution of 3 cm−1. The spectrometer monochromator was calibrated using a Ne lamp's emission lines, while the silicon plate's signal (520.7 cm−1) was provided for checking the beam alignment. The post-processing analysis as baseline correction and cosmic ray removal was conducted in WitecProjectFive Plus, while the peak fitting analysis was conducted using the GRAMS 9.2. software package. The x-ray photoelectron spectroscopy (XPS) measurements were made with the use of a Physical Electronics PHI 5700 spectrometer using monochromatized Al Kα radiation. The survey spectrum showed the presence of the main core level lines from O, C, Si and P for reference sample (SBA/PO(OH)2) and Fe, O, Si, C and P from SBA/POO2Fe samples with no evidence of impurities. The high-resolution XPS spectra for all core levels were corrected for the background signal using the iterated Shirley algorithm, while the bands were fitted by a composition of Gaussian and Lorentzian lines in Multipack software. The binding energy value was corrected for the minor surface charging effect with reference to the C1s line at 284.5 eV. The Mössbauer studies were conducted in transmission geometry using 100 mCi 57Co(Rh) source and He-10%CH4 gas flow counter. The measurements were taken at room temperature, and the direction of the γ-ray propagation was perpendicular to the sample surface. The Mössbauer spectra were fitted as the sum of the Lorentzian sites using Recoil software (D G Rancourt).
Magnetic measurements were performed with a Quantum Design MPMS magnetometer. Magnetization curves M(H) were recorded at T = 5.0 K with a field range of ±40 kOe. Magnetization as a function of temperature was measured in zero-field cooling (ZFC) and field cooling (FC) modes, in the temperature range of 5.0–300 K under an external magnetic field of H = 100 Oe. The magnetization curves were rescaled to the Fe mass content in each sample, based on the TGA measurements.
3. Results and discussion
3.1. Thermogravimetric analysis
In order to choose the temperature for the samples' calcination, TGA analysis was carried out on the SBA/POO2Fe samples in a temperature range from 20 °C–900 °C in three steps, namely heating to 120 °C, calcination at 120 °C, and heating until 900 °C with a rate of 5 °C min −1.
In the case of crystalline material formation in mesoporous silica pores, one or few well-distinguishable regions on the weight loss diagram were presented [23, 50]. These regions corresponded to the structural transitions of the material inside pores. However, in the case of SBA/POO2Fe, there were no distinctive regions between 200 °C and 750 °C (figure 4) which suggests the amorphic nature of the products of thermal decay. However, altogether the TGA can be divided into three main parts, namely, 20 °C–120 °C, 120 °C–800 °C, and over 800 °C.
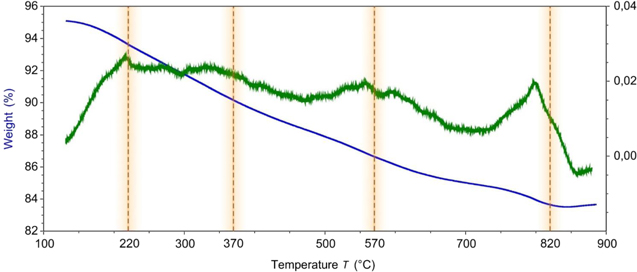
Figure 4. Thermogravimetric analysis curve of the SBA/POO2Fe sample in the 120 °C–900 °C region.
Download figure:
Standard image High-resolution imageIn the first region, the main process was a loss of adsorbed water, which caused a general weight loss of 5% (from 100% to 95%). In the second region, weight loss was at a level of 11% (from 95% to 84%) and was connected with the chemically-bonded water abruption, thermal decomposition of methyl (trimethylsilane-) groups and anchored iron propilphosphonate chains. The last ones were decomposed with the formation of various phosphates, pyrophosphates and oxides, the formation of which was observed in similar systems [24, 50, 51]. Since, according to electron diffraction, at this region, no crystalline products were noticed, one can assume that those products were in a complex amorphous form spread on the inner surface of the silica mesopores. This assumption is in good correlation with the TEM and BET results. In that case, such a broad decomposition region can be explained by the vast amount of various combinations of possible bonding of Fe atoms to the silica surface and one another through oxygen and different phosphorous-based bridges. Although this region is generally flat, a few local minimums at 220 °C, 370 °C and 570 °C were chosen for further study of the thermal evolution of the studied material, and, at the final region—over 800 °C, after the sharp loss at 800 °C–820 °C, the weight of the material slightly increased. As will be shown later, it can be connected with the fact the studied material lost its mesoporous structure. This weight gain can be explained by the reactions of hot Fe-containing glass with atmospheric water and oxygen.
3.2. SEM imaging and EDS measurements
SEM imaging was done for all studied samples in order to confirm their general homogeneity and the absence of any visible impurities. The results of the SEM are presented in figure 5. Generally, all studied powders were homogeneous at this scale and similar to each other. The studied powders consist of individual particles, corresponding to the individual SBA-15 particles which is a typical structure for the SBA-15 based materials.
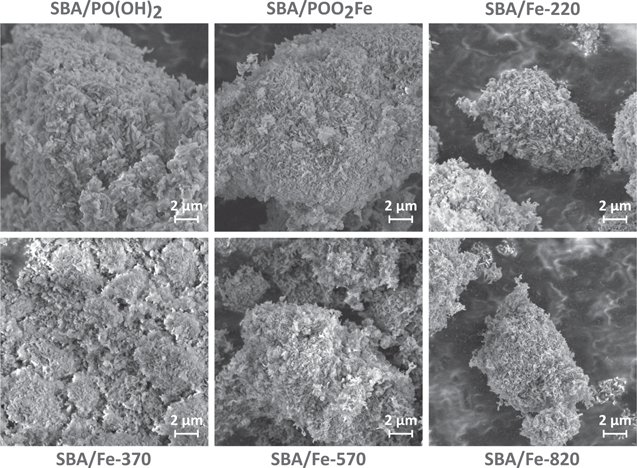
Figure 5. SEM images of the studied samples.
Download figure:
Standard image High-resolution imageAdditionally, to confirm the assumed Fe concentration and the chemical purity of the samples, EDS measurements were performed. The atomic ratio of Si, P and Fe averaged over five measurements taken at different places of each sample are presented in table 2. The obtained results confirmed the required atomic ratio of 10:1:1.
Table 2. Results of the EDS measurements of the SBA-15-based samples functionalized with Fe.
| Atomic percentage, % | |||
|---|---|---|---|
| Samples | Si | P | Fe |
| SBA/POO2Fe | 82,2 | 8,8 | 9,0 |
| SBA/Fe-220 | 82,6 | 8,6 | 8,8 |
| SBA/Fe-370 | 81,7 | 9,0 | 9,3 |
| SBA/Fe-570 | 82,2 | 8,8 | 9,0 |
| SBA/Fe-820 | 83,3 | 8,1 | 8,6 |
Additional confirmation of the homogeneity of the samples was obtained by the results of a linear EDS scan. In figure 6, one can see the studied regions of the sample and the corresponding results of the EDS scan. The depicted curves correspond to the intensity of the EDS signal (Kα line) from the studied elements where the different elements share both the maxima and minimums of their intensity, which, according to the results of the SEM imaging, are located in places with a greater or lesser amount of the studied samples, proving the samples' chemical composition homogeneity.
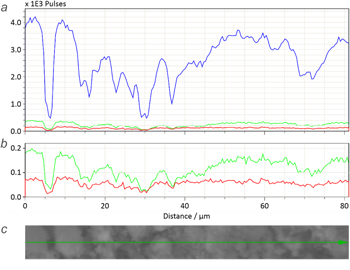
Figure 6. Example of EDS scan measurements done on SBA/Fe-370: (a) results of the linear EDS scan for all elements and (b) magnified area with results for P and Fe as well as (c) SEM image of the scanned region.
Download figure:
Standard image High-resolution image3.3. Transmission electron microscopy
In order to directly confirm the mesostructure of the studied materials and observe the possible formation of any particles in them, TEM imaging was done for all the studied samples. As can be seen from figures 7(a)–(d), the mesostructure typical of SBA-15 silica is observed and presented up to 570 °C. The samples have the form of elongated particles with parallel channels arranged in a fine hexagonal pattern with a pore diameter of approximately 5–6 nm. All these particles along their silica walls look homogenous without any visible agglomerations or large defects, which can be treated as additional evidence of the uniform distribution of functional groups for the SBA/POO2Fe sample and a thin homogeneous layer of Fe-based compounds in the case of samples calcined up to 570 °C. Additionally, none of the measurements of the mentioned samples revealed electron diffraction patterns.
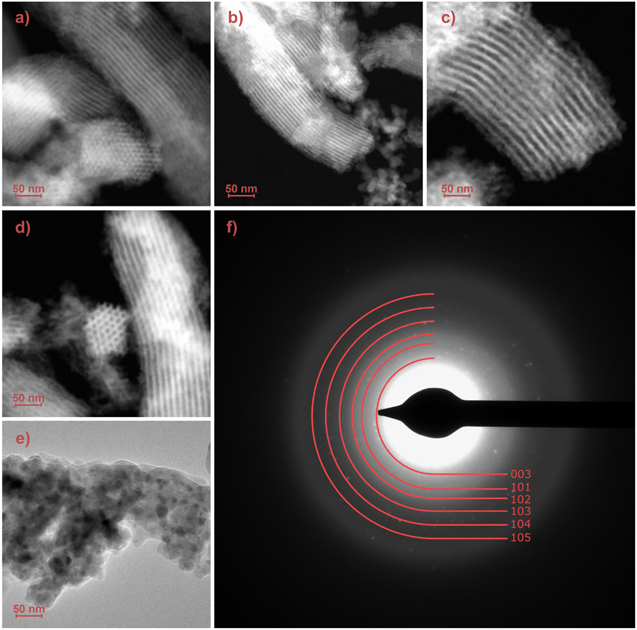
Figure 7. Transmission electron microscopy images for a SBA/Fe sample before (a) and after thermal annealing at 220 °C (b), 370 °C (c), 570 °C (d) and 820 °C (e) and SAED pattern for the SBA/Fe-820 (f).
Download figure:
Standard image High-resolution imageA completely different situation was observed in the case of the sample calcined at 820 °C (SBA/Fe-820). For this sample, as can be seen from figure 6(e), the complete loss of the mesostructure is observed via the destruction of the Fe-doped silica backbone, which coincides well with the results of previous measurements. As a result of this transformation, amorphous silica glass particles with crystalline inclusions were obtained. The crystallinity of those particles was proved by the electron diffraction pattern, indexed with lattice parameters of ferrihydrite (figure 7(f)). Miller indexes of 003, 101, 102, 103, 104 and 105 hkl correspond to the inter-planar distance of 0,31, 0,25, 0,22, 0,20, 0,17 and 0,15 nm. [52–55]
Figure 8 shows the TEM images of the SBA/Fe-820 sample in a higher magnification. According to the TEM imaging, the size of those nanocrystals is in the range of approximately 5–20 nm. The distribution of the particle sizes can be seen in figure 8(f). As can be seen both from the bright and dark field imaging, the presented nanocrystals are well-separated in the silica matrix without any clusters of nanoparticles or nanocrystal-free regions, which is also observed on the images on the greater scale (figure 8(c)).
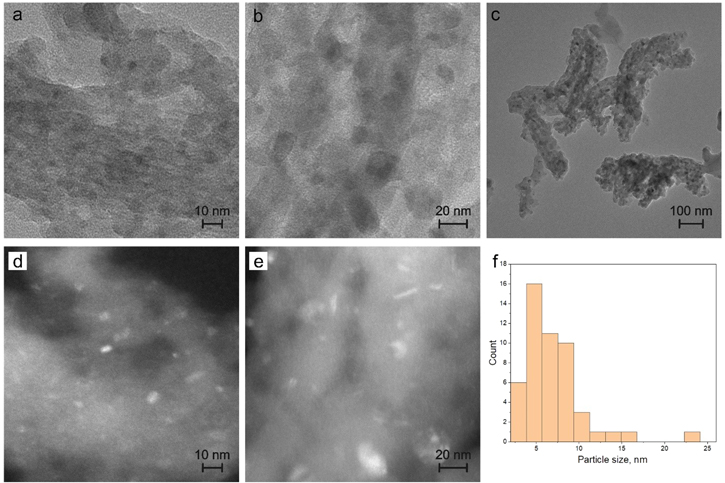
Figure 8. Transmission electron microscopy images for SBA/Fe-820 samples under bright field imaging (a), (b), (c) and dark field imaging (d), (e), highlighting the presented nanocrystals and corresponding particle size distribution diagram (f).
Download figure:
Standard image High-resolution imageAdditionally, Fe-containing samples were studied using high-resolution EDS line-scan measurements under TEM imaging. The results of the line-scan measurements of the relative Si and Fe content in the studied Fe-containing mesoporous samples, as well as corresponding marked regions of the line-scan, are shown in figure 9. As can be seen, the Si/Fe ratio remains generally at the same level along the entire line-scan, giving a noticeably large deviation only on the borders of the particles, without any large agglomeration of Fe, proving the uniformity of the sample on the nanoscale. Moreover, the slight wave-like shape of the line-scan reflecting the multichannel structure indicates the location of Fe inside the pores. At the same time, one can notice that in the case of SBA/POO2Fe and SBA/220, the lines corresponding to the elemental content of Fe and Si are much smoother than in the case of SBA/370 and SBA/570. This phenomenon can be explained via the thermal stability of Fe-functionalized propylphosphonate groups. In the case of the first two samples, those groups have not undergone thermal decomposition, and Fe ions are bonded to them, granting a more homogeneous distribution of Fe in the sample. In contrast, in the case of SBA/370 and SBA/570, those groups have been eliminated though Fe ions were placed still mainly on the pore walls. As a result, a less homogeneous distribution of Fe ions, illustrated by the wave-like sharp shape of line-scans, was observed.
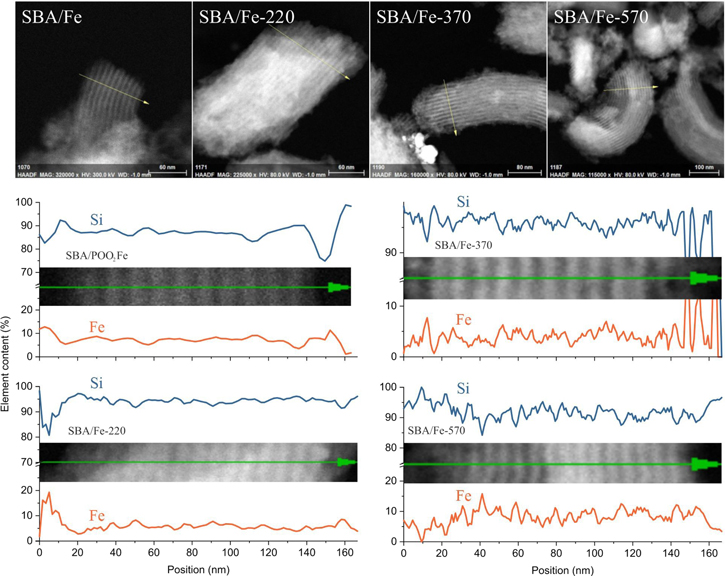
Figure 9. Transmission electron microscopy images of the studied samples and line-scans of the marked regions.
Download figure:
Standard image High-resolution imageThe position of Fe ions in the silica mesochannels was additionally confirmed by high-resolution EDS mapping. It was difficult to carry out this measurement for each sample since some materials were unstable during the long process (due to the relatively low concentration of iron, mapping took at least four hours). For this reason, we present the results for SBA/POO2Fe and SBA/220. The rest of the samples were 'moving' during the process, and the results were not acceptable. As a result, we obtained EDS maps showing the position of iron and silicon atoms. In order to visualize the places in which iron concentration is higher than silicon content, we proceed with the graphical subtraction operation. The result of this, together with the source maps, can be seen in figure 10. It can be clearly seen in the results of the intersection that the Fe atoms are localized mainly at the inner surface of the silica channels. This observation is in accordance with the synthesis's assumption: Fe atoms are bounded inside silica pores.
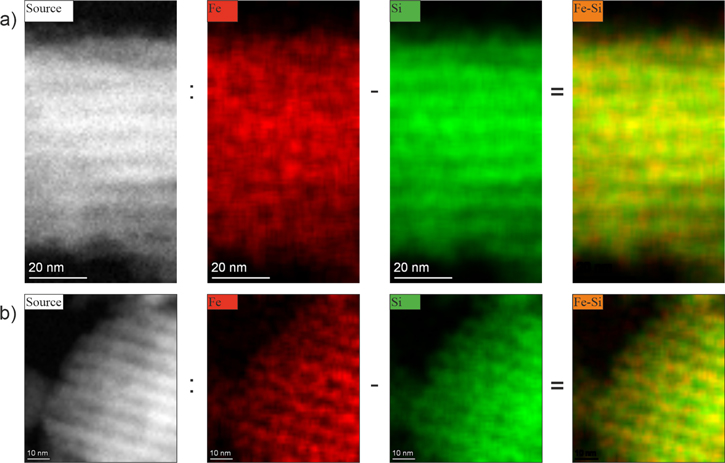
Figure 10. Elemental maps for the SBA/POO2Fe sample (a) and SBA/Fe-220 (b). From the left: source TEM image, maps of the Fe atoms' position, the same maps of the silicon position, and the result of the graphical subtraction of previous maps.
Download figure:
Standard image High-resolution image3.4. Physisorption analysis
A series of nitrogen physisorption isotherms were collected to determine the structural changes in iron phosphonate functionalized silica SBA-15 during calcination. Each thermally treated sample, as-prepared sample, and reference sample were tested at 77 K. The nitrogen physisorption isotherms are shown in figure 11(a) for all samples. Each sample possesses a sharp increase in nitrogen adsorption at the p/p0 values close to 1 due to the capillary condensation of N2 between the particles. For better visualization of the individual adsorption isotherms, in figure 11(b), the results of the measurements are presented in the 0.05−0.95 p/p0 range with the offset.
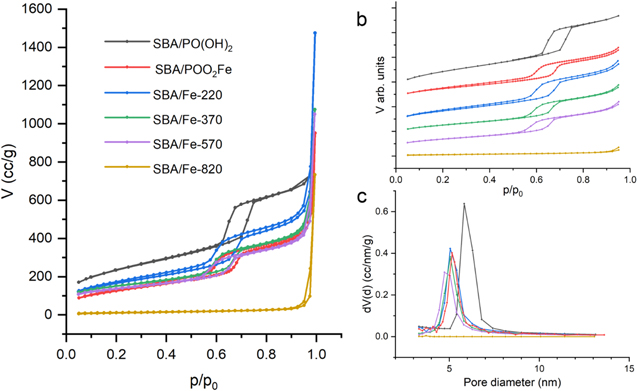
Figure 11. Nitrogen adsorption isotherms of iron phosphonate functionalized SBA-15 silica at successive stages of thermal evolution (a), nitrogen adsorption–desorption isotherms presented in the 0.05−0.95 p/p0 range with the offset for better visualisation of hysteresis loop (b) and BJH pore size distribution calculated from the desorption isotherm branch (c).
Download figure:
Standard image High-resolution imageIn the case of non-activated samples as well as samples activated with Fe ions before and after calcination at 220 °C, 370 °C and 570 °C, the corresponding isotherms are characteristic of type IV (a) according to IUPAC nomenclature, pointing to the fact that those samples possess mesoporous structures. All these samples show a sharp step in nitrogen adsorption near 0.6 p/p0 (figure 11(b)) related to the narrow pore size distribution. In contrast, the sample activated with Fe ions after calicination at 820 °C has lost most of its adsorbing abilities and the mentioned hysteresis loop has been transformed to the isotherm of type II, characteristic of nonporous or macroporous materials, indicating the loss of the mesoporous structure in this sample as a result of thermal treatment.
The specific surface area was determined by the BET method and is summarized in table 3. The greatest surface area was measured for the sample before the functionalization with Fe ions. After the functionalization, the surface area significantly decreased as a result of filling the pores with Fe ions and bonding them to propyl-phosphonate anchoring molecules. After thermal treatment at 220 °C, the specific surface area increased, which corresponds to the elimination of organic parts of organic molecules according to a big mass loss in TGA. Further heating caused a slight decrease in the surface area, which can be explained as a partial blocking of the pores or damaging of the silica walls. A giant decrease in the surface area at 820 °C confirms the initial theory about the loss of the mesostructuration of this sample. The same tendency was also observed for the pore volume measurements.
Table 3. N2 sorption characteristic of untreated and thermally treated samples.
| Sample | SBET a , (m2 g−1) | V b , (cc/g) | D c , (nm) |
|---|---|---|---|
| SBA/PO(OH)2 | 843 | 1.129 | 5.83 |
| SBA/POO2Fe | 468 | 0.825 | 5.16 |
| SBA/Fe-220 | 596 | 0.996 | 5.06 |
| SBA/Fe-370 | 536 | 0.818 | 5.06 |
| SBA/Fe-570 | 491 | 0.759 | 4.73 |
| SBA/Fe-820 | 43 | 0.150 | — |
a SBET - specific surface area. b V - pore volume. c D - pore diameters.
Pore size distributions in the mesopore range were determined by the BJH method for the desorption branch of the isotherm (table 4). Figure 11 shows a very narrow pore size distribution for all samples. The pore diameter before heat treatment was 5.16 nanometers and decreased slightly after annealing until the silica structure was completely destroyed at 820 °C.
Table 4. Average distance between Fe ions calculated for square and hexagonal lattices.
| Sample | WTa | S b , nm2 | Dsq c , nm | Dhex d , nm |
|---|---|---|---|---|
| SBA/POO2Fe | 1 | 7,00 | 2,65 | 2,84 |
| SBA/Fe-220 | 0,935 | 8,34 | 2,89 | 3,10 |
| SBA/Fe-370 | 0,900 | 7,21 | 2,69 | 2,89 |
| SBA/Fe-570 | 0,865 | 6,35 | 2,52 | 2,71 |
| SBA/Fe-820 | 0,835 | — | — | — |
a WT is the relative residual mass after heating. b S - specific surface area. c Dsq - average distances between atoms, calculated for the square 2D lattice. d Dhex - average distances between atoms, calculated for the hexagonal 2D lattice.
Additionally, based on the measurements of the specific surface area, mass loss from TGA and the EDS results, the average space separation between Fe ions was calculated by dividing the number of Fe ions in the given mass of the sample on its surface area. The number of Fe ions ( ) can be calculated from the results of TGA, assuming that the thermal decomposition was full and, after treatment at 820 °C, its composition at the mass minimum can be expressed as 10SiO2 + FePO4 as:
where WT
is the relative residual mass after the heating taken from TGA measurements,  - molar mass of 10SiO2 + FePO4, MT
- assumed molar mass based on TGA results, m - mass of the sample and NA - Avogadro's number.
- molar mass of 10SiO2 + FePO4, MT
- assumed molar mass based on TGA results, m - mass of the sample and NA - Avogadro's number.
Assuming that all Fe ions are spread ideally on the silica surface and neglecting its curvature, we can calculate the average area per Fe ion in the first assumption by dividing the number of ions in 1 g of powders by the specific surface area. The surfaces per one ion S, as well as the average distances between atoms, calculated for the square Dsq and hexagonal Dhex 2D lattice, are presented in table 4. The obtained distances are in the range of 2.5–3.1 nm and are much greater than the effective interaction distances, suggesting that in that assumption, Fe ions are spatially separated. Therefore, we can state that the obtained material matches perfectly with the stated characteristics, which were suggested in section 1.
3.5. X-ray diffraction
The XRD patterns of all the studied samples are shown in figure 12. The patterns for SBA/PO(OH)2, SBA/POO2Fe, SBA/Fe-220, 370 and 570 have high-intensity, broad peaks at 2θ = 15–35°, which can be assigned to the amorphous SBA-15 silica. The diffractograms showed no other peaks, pointing to the absent/low amount of the crystalline substances in these samples or the insufficient crystal size.
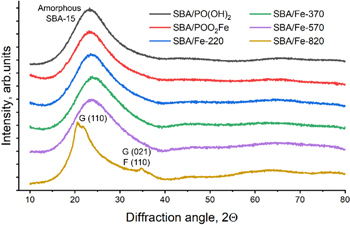
Figure 12. XRD patterns for the studied samples with the specified Miller indices for the ferrihydrite (F) and goethite (G) phases.
Download figure:
Standard image High-resolution imageIn contrast, in the case of SBA/Fe-820, we can see a shift of the main peak, suggesting the change in the morphology of the SBA-15, which, as can be stated now, may be connected to the loss of the mesostructure and formation of the glass-like particles. Additionally, a few low-intensity diffraction peaks are observed for this sample, related to the presence of crystals in the studied sample. The peak at about 35° is characteristic of ferrihydrite (F) [55], while signals at about 21° and 35° may be assigned to the goethite (G) [56], a more stable phase to which ferrihydrite can transform.
3.6. Raman spectroscopy
Raman spectroscopy was applied to monitor the alteration of the specific band arrangement resulting from the SBA-15 pore channel activation through Fe or due to the impact of temperature on the functionalized system. According to reports and due to compliances of the Raman spectrum, the success of the activation procedure by the appropriate metal ought to be realized after theoretical calculations, the peak fitting analysis of the experimental spectrum, and finally, through comparing the spectrum of SBA-15 sample containing hydroxyl-propyl-phosphonate with the iron-propyl-phosphonate groups (see figure 13) [49].
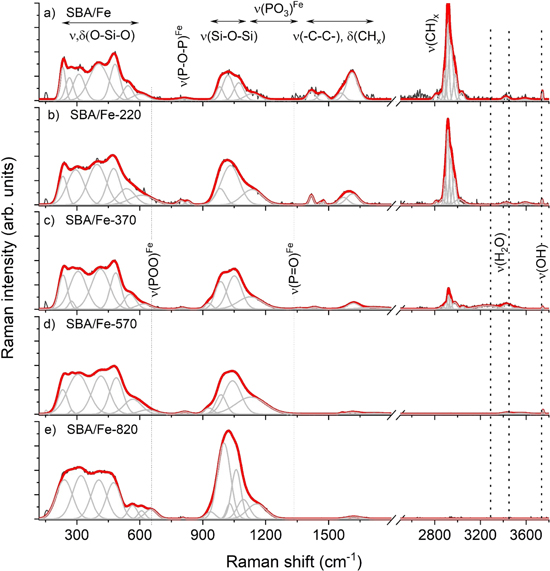
Figure 13. Raman spectra of SBA/POO2Fe silica powder obtained for a sample before (a) and after thermal annealing at 220 °C (b), 370 °C (c), 570 °C (d) and 820 °C (e). Spectra illustrated in two regions: 120−1550 cm−1 and 2500−3800 cm−1. Characteristic bands corresponding to the ν(P = O)Fe, ν(PO3)Fe, ν(P-O-P)Fe as well as ν,δ(Si-O), ν(OH) and ν(H2O) were highlighted through arrows and/or dotted lines.
Download figure:
Standard image High-resolution imageSimilar to papers on compatible materials, a spectrum of the SBA/POO2 Fe (figure 13(a)) is dominated by silica-related bands with the stretching and deformation modes of the medium-range order superstructures (150−650 cm−1) and the stretching vibration of silicon-oxygen within tetrahedral Qn (n = 0−4 and stands for the number of bridging oxygen per SiO4 tetrahedron) modes (850−1250 cm−1) [57–65]. A more detailed look at the Raman data showed information about the O-bending motion within n-membered rings or silica network depolymerization. In this context, the SBA/POO2 Fe band arrangement seems to be very similar to the spectrum of the reference sample, with the bands suggesting the presence of three- (D2 defect 620 cm−1), four- (D1 defect 473 cm−1), and five-membered rings (395 cm−1) (figure 13(a)) [66–70].
Functionalization of the silica by the propyl-phosphonate units implies the activation of additional stretching modes of the propylene –C–C– chain, deformation modes of methylene groups (1250−1800 cm−1) and stretching modes of CH2, x = 2 groups (2800 − 3200 cm−1). A weak band around 3727 cm−1 corresponds to the stretching modes of hydroxyl units. At the same time, the OH band suggests incomplete activation of hydroxyl-propyl-phosphonate groups or passivation of the silica surface, which can be caused by the steric hindrances of anchored groups.
Unfortunately, metal ions are usually not directly observable by vibrational spectroscopy, which may activate a new type of vibration corresponding to the appearance of new bands [22, 23, 69]. As a result, the incorporation of Fe into the pore channel, according to theoretical calculation, ought to lead to the activation of the ν(P = O)Fe as well as ν(POO)Fe modes, which should be observed on the Raman spectrum in the form of low intense bands around 1340 cm−1 and 670 cm−1, respectively [49]. Here, the lack of the ν(P = O)Fe, as well as (POO)Fe-related bands combined with a significant increase of the intensity of Qn-bands compared to the reference, suggests an atypical mechanism related to the Fe incorporation into the SBA-15 system. One of the hypotheses assumes that some of the Fe ions have the possibility of migrating within the channel and due to the laser can initiate partial degradation of the propyl-phosphonate groups, releasing to the pore environment phosphonic acid units. As a result of the reactive nature of the nanometric pore channel, as well as the presence of Fe and phosphonic acid ions under the laser, the Fe phosphate structure forms locally in the form of a highly disordered glass-like structure [70–72]. The glass-like iron phosphate structure can cover the internal pore wall of the channel. This hypothesis can be supported by the literature data illustrating a similar band arrangement in the 850−1200 cm−1 region. According to such data, the most intense band, around 1032 cm−1, originates from the PO3-stretching modes with one NBO (natural bond orbital) [73]. In turn, the higher frequency bands result from asymmetric PO3 modes or symmetric PO2-stretching modes with two NBOs. The low-lying band around 976 cm−1 corresponds to the PO3 modes or PO4 units with all bridging oxygen. In this context, the low intense bands between 700 and 800 cm−1 are assigned to the symmetric P–O–P stretching modes [70].
Raman spectra of samples annealed at 220 °C and 370 °C (figures 13(b), (c)) reveal numerous bands typically for the asymmetric and symmetric stretching vibration of CH2 groups but with declining intensity as the sintering temperature rises. It points to the lowering number of the methylene moieties due to the extent of the degradation of the propyl chain. Additionally, low intense bands found on the spectrum of the SBA-15-POO2Fe system sintered at 370 °C that are featured in-between 3200−3600 cm−1 suggest the strong capillary effect with increased potential of the water incorporation into the silica pore, in contrast to other samples. At the same time, the intensity of the OH-band at 3727 cm−1 decreased when the temperature of the sintering rose.
Moreover, the Raman spectra of SBA-15-POO2Fe calcined at 570 °C and 820 °C (figures 13(d), (e)) are devoid of the methylene and water signal, indicating complete dehydration and degradation of the propyl-phosphonate units. Finally, there is also no OH signal on the spectrum of the sample annealed at 820 °C, suggesting complete dehydroxylation of such a system. A similar observation was found in the fingerprint region. Here, the higher the temperature of the annealing, the lower the intensity of the –C–C– and δ(CHx).
The number of bands typical for the medium-range order silica superstructures is generally invariant with only slight changes of their position and full width at half maximum as the temperature of sintering increases but only to 570 °C. The band arrangement observed on the spectrum of the sample sintered at 820 °C was strongly rebuilt for the position, number, and full width at half maximum. This effect, in correlation with dehydroxylation, indicates disordering or even full amorphization of the silica network, which is also confirmed by the results of BET and TEM.
3.7. X-ray photoemission spectroscopy
To study the type of functional group content and surface composition of silica-based studied materials, they were investigated using x-ray photoemission spectroscopy (XPS). All the samples were investigated by XPS, which allowed for the analysis of impurities, and the surface oxidation degree. Figure 14 shows the high-resolution spectra of C1s, Si2p, P2p, O1s, and Fe2p lines. Individual plots are related to the XPS spectra of the SBA/POO2Fe sample series, which have undergone various thermal treatments (from room temperature to 820 °C).
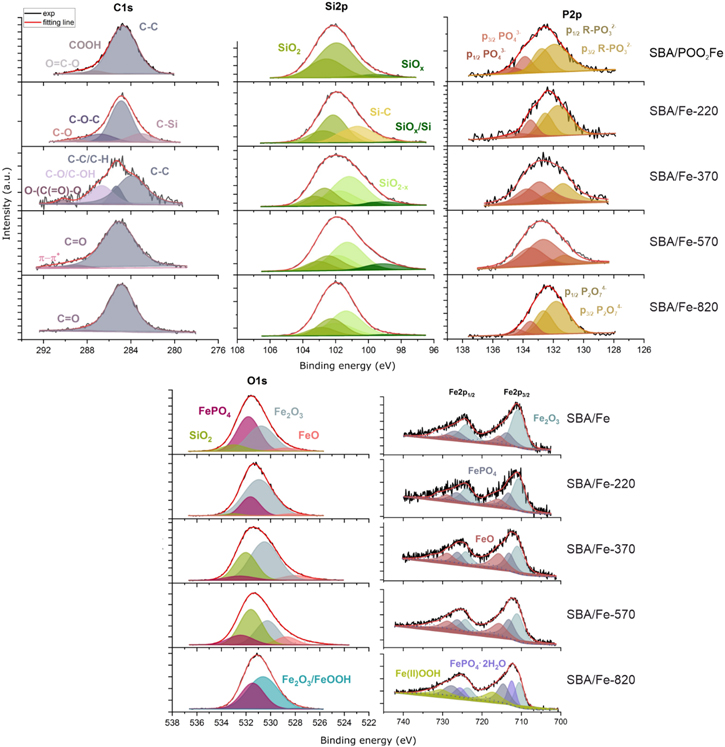
Figure 14. Deconvoluted high-resolution x-ray photoelectron spectra of the annealed SBA/POO2Fe samples.
Download figure:
Standard image High-resolution imageDepending on the temperature used to calcine the samples, different amounts of Fe were measured on the surface of the sample. Initially, the sample which was not thermally processed shows 2.25 at% of Fe at the surface. After the thermal treatment in the range of 220 °C−570 °C, the amount of Fe at the surface decreased to 1.62 at%−1.72 at%, which, taking into account the surface sensitivity of the XPS technique, can be related to the partial loss of Fe ions from the outer surface of the SBA-15 particles due to the thermal destruction of the anchoring propylphosphonate groups. In contrast, further heating up to 820 °C shows an increase of Fe content at the surface to 4.07 at% (table 5) which may be related to the release of Fe atoms from the mesopores after their destruction and loss of mesoporous structure. Generally, for all samples, XPS spectra could be interpreted as a superposition of signals coming from Fe, while the indicated phases such as FePO4 · H2O (712.44eV) [74], FeOOH (717.25eV) [75] and different iron oxides like Fe2O3 or FeO (710.6 eV to 711.1 eV) [76, 77] should be treated as Fe atoms at various coordinations. Similarly, different phases can also be attributed to the signal, recorded for O1s and P2p core level lines (figure 14). However, as was described earlier, Fe atoms in these samples, in most cases, are identified as separate. Therefore, the recorded results do not reveal individual phases but point to large variability in the coordination of individual Fe atoms and prove previous assumptions on the form and distribution of Fe atoms.
Table 5. The results of elemental analysis in at% for Fe-functionalized samples calcined at various temperatures taken from XPS measurements.
| Sample | C1s | O1s | Si2p | P2p | Fe2p |
|---|---|---|---|---|---|
| SBA/POO2Fe | 14.53 | 56.43 | 25.12 | 1.66 | 2.25 |
| SBA/Fe-220 | 19.93 | 54.49 | 23.19 | 0.78 | 1.62 |
| SBA/Fe-370 | 3.76 | 65.87 | 27.72 | 0.93 | 1.71 |
| SBA/Fe-570 | 4.62 | 65.13 | 27.26 | 1.27 | 1.72 |
| SBA/Fe-820 | 11.92 | 56.16 | 24.38 | 3.48 | 4.07 |
As for the C1s spectrum, we can obtain information on the thermal decomposition of the organic groups. It is important to notice that the spectra for the non-calcined and calcined at 820 °C samples show relatively sharp peaks. In the case of a non-calcined sample, such a signal generally confirms the assumed structure of anchored organic groups, whereas a sample calcined at 820 °C shows the presence of C on the surface of particles in the form of thermally stable C=O groups and certain residual C–H containing moieties. At the same time, results for the samples calcined at 220 °C–570 °C indicate multiple phases, which perfectly correlates with the process of the thermal decomposition of organic groups in this temperature range. Similarly, P2p spectra show the decomposition of phosphonate units into phosphates with their further transformation into pyrophosphates at higher temperatures.
According to the Si2p line analysis, when the temperature increases, the SiO2 content decreases on the surface. The binding energy of SiO2 was found in the range 101.9 eV–102.2 eV [76]. Further, the Si2p3/2 line at about 99.5 eV was observed for all the samples, whose peak is assigned to SiOx. Additionally, sample SBA/Fe-220 shows a peak at 106.7 eV, ascribed as SiC. Generally, these results reveal a similar tendency to that observed for the C1s and P2p line, pointing to the higher variability in phase composition for samples calcined at 220 °C–570 °C.
3.8. Mössbauer spectroscopy
All samples were analyzed using Mössbauer spectroscopy and the obtained spectra for all measurements are presented in figure 15. The spectra measured at room temperature showed only a double line fitted with one component characterized by quadrupole splitting (QS) and isomer shift (IS). This splitting is caused by the electric field gradient that arises as a result of the asymmetric distribution of electric charges of neighboring ions (and own electrons) acting on the Fe nuclei. No trace of sextets, providing information about magnetic splitting, suggests paramagnetic ordering of the sample. The values of the hyperfine parameters were collected in table 6.
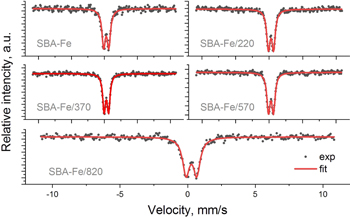
Figure 15. Mössbauer spectra measured at 298 K for iron phosphonate functionalized SBA-15 silica calicinated at different temperatures.
Download figure:
Standard image High-resolution imageTable 6. The hyperfine parameters (isomer shift (IS) and quadrupole splitting (QS)) with line width (w) of the Mössbauer spectra measured for iron phosphonate functionalized SBA-15 silica calicinated at different temperatures.
| Samples | IS [mm s−1] | QS [mm s−1] | w [mm s−1] |
|---|---|---|---|
| SBA/POO2Fe | 0.28 | 0.78 | 0.31 |
| SBA/Fe-220 | 0.28 | 0.77 | 0.31 |
| SBA/Fe-370 | 0.30 | 0.68 | 0.26 |
| SBA/Fe-570 | 0.28 | 0.74 | 0.29 |
| SBA/Fe-820 | 0.27 | 0.76 | 0.27 |
The IS values were close to each other and ranged from 0.27–0.30 mm s−1, while QS changed from 0.68 to 0.78 mm s−1. A relatively large QS may be due to the presence of fine particles. Simultaneously, a narrow line width (w) providing information about the smaller distribution of QS means more homogeneous Fe surroundings, which may also suggest larger particles. The lowest value of QS observed for the sample calcined at 370 °C indicates relatively small asymmetry in the electric surroundings or slightly larger particles. The values of the QS and IS are very close to those obtained by Ziganshin et al [78] or Wang et al [79] for ferrihydrite. The structure of ferrihydrite with a grain size ranging from 2–6 nm can be described by hexagonal space group P63mc and chemical formula (Fe10O14(OH)2). This structure, in its ideal form, consists of 80% FeO6 octahedrons and 20% FeO4 tetrahedrons [80]. Higher QS values compared to the literature data can be related to the distortion of FeO6 observed for small crystallites [79]. The presence of ferrihydrite suggested by Mössbauer measurements was also indicated by electron diffraction and XRD measurements.
3.9. Magnetic properties
In order to analyze the magnetic properties of the investigated material, the magnetization dependence on the applied field was measured for all samples at the temperature of 5.0 K (figure 16). The samples show nearly linear M(H) curves with a slightly sigmoidal shape, the most pronounced for a sample calcined at 570 °C. It suggests a weak superparamagnetic or antiferromagnetic ordering. None of the samples reached saturation with the highest applied magnetic field (40 kOe). As can be observed, there are no monotonic changes in the behavior of the magnetization curves with calcination temperature. Taking into account the structural analysis and evaluated average interatomic Fe–Fe distance in the SBA/Fe sample, we can suppose that magnetic ions are not directly bonded and show weak magnetic interactions. Similar behavior was observed for Ni ions distributed inside SBA-15 silica [22]. The decrease in the magnetization signal observed for the samples SBA/Fe-220 and SBA/Fe-370 is probably related to the higher separation of Fe ions with increasing calcination temperature. In contrast, the highest magnetization response is observed for the sample SBA/Fe-570. The lack of organic groups in this sample that coordinate Fe ions leads to a higher concentration of magnetic atoms on the silica, which may be responsible for the observed M(H) behavior. The lowest magnetization signal was revealed for the sample calcined at the highest temperature. At this temperature, according to the presented structural studies, the silica loses its porous structure and iron-containing nanocrystals are distributed in the silica matrix.
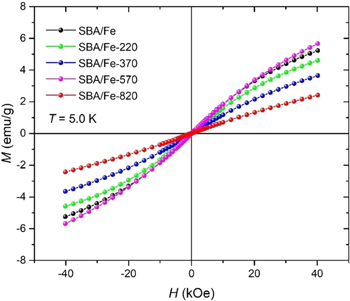
Figure 16. Dependence of magnetization on the applied field measured at temperature T = 5.0 K (the lines are a guide for the eyes).
Download figure:
Standard image High-resolution imageAdditional information about the magnetic behavior of the samples was obtained from the temperature dependence of magnetization. As can be seen in figure 17, both the ZFC and FC curves coincide for all the samples, which is in accordance with the observed non-hysteretic behavior in the M(H) curves. However, an interesting observation was made for the sample SBA/Fe-820. The slight bifurcation of the ZFC-FC curves, revealed below the temperature of 15 K, indicates a different magnetization mechanism compared to other samples. The Mössbauer, electron diffraction patterns and XRD studies imply the formation of a ferrihydrite crystalline phase for this sample. According to the literature, the ferrihydrite is an antiferromagnet with a small ferromagnetic-like moment [81, 82]. Thus, the bifurcation of MZFC(T) and MFC(T) curves may be connected with the presence of weak antiferromagnetic interactions in the SBA/Fe-820 sample, which also explains the low magnetization value (figure 16). The lack of hysteresis in the M(H) dependences, usually observed for this compound at low temperatures, may be related to its large distortion caused by fine crystallites and the presence of Si and P, which can build into the ferrihydrite structure [79, 83].
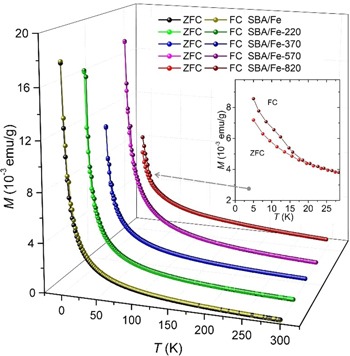
Figure 17. Temperature dependence of ZFC and FC magnetization for applied field H = 100 Oe (the lines are a guide for the eyes).
Download figure:
Standard image High-resolution image4. Conclusions
In this paper, we have reported the synthesis and initial investigation of a novel series of nanomaterials based on the SBA-15 mesoporous silica functionalized with Fe ions inside the pores. The materials were obtained as a result of the thermal decomposition of the anchored iron propylphosphonate groups inside the silica nanoreactors at different temperatures, namely 220 °C, 370 °C, 570 °C and 820 °C. The morphology, structure and magnetic properties of the samples were studied using such techniques as TGA, SEM and TEM imaging combined with EDS mapping, nitrogen physisorption analysis, Raman spectroscopy, XPS, Mössbauer spectroscopy, and SQUID measurement.
The results showed that as a result of the thermal treatment, the obtained materials show gradual decomposition of the iron propylphosphonate and trimethylsilyl groups attached to the silica walls, resulting in the formation of an SBA-15-like structure with an amorphous Fe-containing thin coating on the silica walls after heating up to 570 °C (figure 18). These materials, due to their Fe atom separation in the atomic-scale thin amorphous layer on the greatest surface area (up to 500–600 m2 g−1) of the mesoporous silica with various coordination environments, seem to be of great interest for applications in catalysis, adsorption, and non-linear optics due to the great number of active Fe sites spread over a large area.
Figure 18. Schematic of the thermal evolution of Fe phosphonate functionalized SBA-15 silica.
Download figure:
Standard image High-resolution image
The obtained mesoporous structures seem to be stable under heating up to approximately 800 °C, according to the results of the TGA measurements, which indicate an increase in mass, associated with the inclusion of the atmosphere's water and oxygen in the structure. Obtained after thermal treatment at 820 °C, the samples show almost complete loss of the SBA-15 mesostructure and the formation of glass-like particles with incorporated 5–20 nm ferrihydrite nanocrystals.
The presented results of the synthesis and investigations of the obtained materials show the viability of the earlier-proposed 2D solid solvent approach, as well as the derived synthesis route, which, being easily modifiable, can be utilized to obtain novel materials with unique structures.
Acknowledgments
This work has been supported by the resources of the National Science Centre (Grant-No:2017/26/E/ST5/00162 (LL), 2021/43/D/ST8/00737 (ML), and 2020/37/B/ST8/03637 (MD)).
Data availability statement
All data that support the findings of this study are included within the article (and any supplementary files).
Conflicts of interest or competing interests
The authors declare that they have no known competing financial interests or personal relationships that could have appeared to influence the work reported in this paper.