
Abstract
Objective. In the following review we outline how ultrasound can be used to measure physiological processes in the gastrointestinal tract. Approach. We have investigated the potential of ultrasound in assessing gastrointestinal physiology including original research regarding both basic methodology and clinical applications. Main results. Our main findings show the use of ultrasound to study esophageal motility, measure volume and contractility of the stomach, assess motility, wall thickness, and perfusion of the small bowel, and evaluate wall vascularization and diameters of the large bowel. Significance. Ultrasound is a widely accessible technology that can be used for both scientific and clinical purposes. Being radiation-free and user friendly, the examination can be frequently repeated enabling longitudinal studies. Furthermore, it does not influence normal GI physiology, thus being useful to estimate motility and subtle changes in physiology. Accordingly, ultrasound scanning and physiological measurements may make a big difference for the scientist and the doctor; and for the patients who receive an efficient work-up.
Export citation and abstract BibTeX RIS

Original content from this work may be used under the terms of the Creative Commons Attribution 4.0 licence. Any further distribution of this work must maintain attribution to the author(s) and the title of the work, journal citation and DOI.
Introduction
Ultrasonography is a popular and widely used imaging technique in modern medicine. Originally it was mainly used to visualize organs and search for visible pathology such as tumors, but recent advances have opened a whole range of new possibilities. Today, we can use ultrasound to measure perfusion, blood flow, contractile activity, elasticity, as well as real-time assessment of the dynamic function of the gastrointestinal (GI) tract. The method has several advantages; it is safe, non-invasive, does not involve radiation, and is widely available. Compared to other imaging modalities such as computer tomography (CT) and magnetic resonance imaging (MRI), ultrasound has the advantage of being a real-time imaging modality, and the examining physician can interpret the findings as the patient is examined. However, the images are not standardized in the same way as images from CT and MRI, making the modality more user dependent. But still, for some applications ultrasound (US) performs superior to other modalities. An example is the diagnostics of lesions in the liver, where contrast-enhanced ultrasound in many cases performs better than CT or MRI (Wang et al 2020). Volume estimation of the gastric stomach can be done in a non-invasive matter by dynamic MRI or 3D ultrasound. The two methods showed excellent agreement in a prospective comparative study (Buisman et al 2016). But in other cases, simple US measurements can serve as a pragmatic solution to a practical challenge. A simple cross section measurement of the gastric antrum correlates with approximately 90% agreement to MRI, but is more easy to use in a pre-operative setting in children (Schmitz et al 2016). The small bowel is the part of the GI tract that is least accessible by standard endoscopic methods. For this reason, imaging techniques are important for both diagnostics and for examination of physiological processes. Ultrasound is a reliable method for assessing bowel wall thickness, and wall thickness assessed with ultrasound have showed good agreement with inflammation and fibrosis in biopsies. The same was not true for MRI in a comparative study from 2018 (Wilkens et al 2018). Perfusion of the bowel wall can also be measured by both contrast-enhanced ultrasound and by dynamic contrast-enhanced magnetic resonance enterography. The two methods show moderate correlation in one study from 2017 (Wilkens et al 2017). Most often ultrasound is used as a non-invasive method which is capable of frequent repeated measurement without any side-effects for the patient. However, ultrasound can also be combined with invasive methods like endoscopy, manometry, and impedance measurement.
Disadvantages with ultrasonography are that it may be subject to image impairment due to excessive abdominal fat and gas bubbles within the gut lumen and the technique is relatively user dependent. High density tissue such as bone reflects ultrasound waves to such a degree that underlying tissues are impossible to visualize. Regarding GI physiology, there are some limitations as to what can be measured with ultrasound. The physiological processes of acid and enzyme secretion, nutrient and fluid absorption cannot be directly observed by ultrasound.
In this review, we will bring attention to the possibilities of assessing the physiological functions of the GI tract with ultrasound technology, from a clinician's point of view.
Ultrasound in the investigation of the esophagus
The main function of the esophagus is swallowing, a complicated sequence of peristalsis coordinated with relaxation of proximal and distal sphincters. A second function is that of protecting the esophageal mucosa and airways against reflux of gastric contents. Thirdly, the sphincters of the esophagus will relax during eructation, to allow for venting of air from the stomach.
These functions require careful regulation of esophageal motility with brainstem centers for coordinating swallowing, as well as for transient lower esophageal sphincter relaxations, the event that allows for venting of air, but also initiates most episodes of gastro-esophageal reflux. Both the inner circular muscle layer of the wall, which also includes most of the lower esophageal sphincter, and the outer longitudinal layer participate in the generation of the peristaltic waves and are of interest in the study of normal and abnormal esophageal motility.
The esophagus is not easily accessible for transcutaneous ultrasound, except in the newborn child. Instead, endoscopic ultrasound has developed rapidly and constitutes today an important diagnostic and therapeutic tool in routine practice. This chapter will focus on the use of intraluminal ultrasound for studying esophageal motility in health and disease.
Motility disorders of the esophagus have traditionally been studied and defined by manometry, lately with up to 36-channel high-resolution manometry allowing for Clouse plots with color-coded pressure charts (Kahrilas et al 2017). Radiographic studies with video recordings of the images add geometric information and can be combined with manometry particularly in studies of the oropharyngeal phase of swallowing.
The ability of high frequency endosonography to visualize the individual layers of the wall in real time and study contractile activity has been demonstrated in several different settings. In an animal model using a 20 MHz M-mode probe in the mid-esophagus, Taniguchi and coworkers could demonstrate significant thickening of the circular layer during occlusive contractions (contractions that closed the lumen), but also thinning of the wall during dilations (Taniguchi et al 1993). Miller and coworkers combined manometry with a 20 MHz cross-sectional ultrasound probe and could define 4 phases of swallowing a semi-solid bolus in healthy subjects. First a baseline period with no dilation or pressure increase, next a passive dilation of the lumen with thinning of the muscularis, then a pressure rise in phase 3 with maximum thickness of the muscle, and return to baseline conditions in phase 4 (Miller et al 1995a).
Furthermore, disorders of hypercontractility will over time lead to hypertrophy of the muscular layers in the region of the esophagus involved. Miller and coworkers studied 29 patients with achalasia with a 20 MHz miniprobe and found that the total thickness of the muscularis, as well as the circular and longitudinal smooth muscle were significantly increased on average 1.6 times as compared to 19 healthy controls (Miller et al 1995b). In later studies, manometry was combined with endosonography and transabdominal ultrasound to study the functional anatomy of the esophago-gastric junction in patients with gastro-esophageal reflux disease (Vegesna et al 2014). It was found that the movement of the proximal gastric mucosa and submucosa orally was significantly reduced in patients as compared with healthy controls.
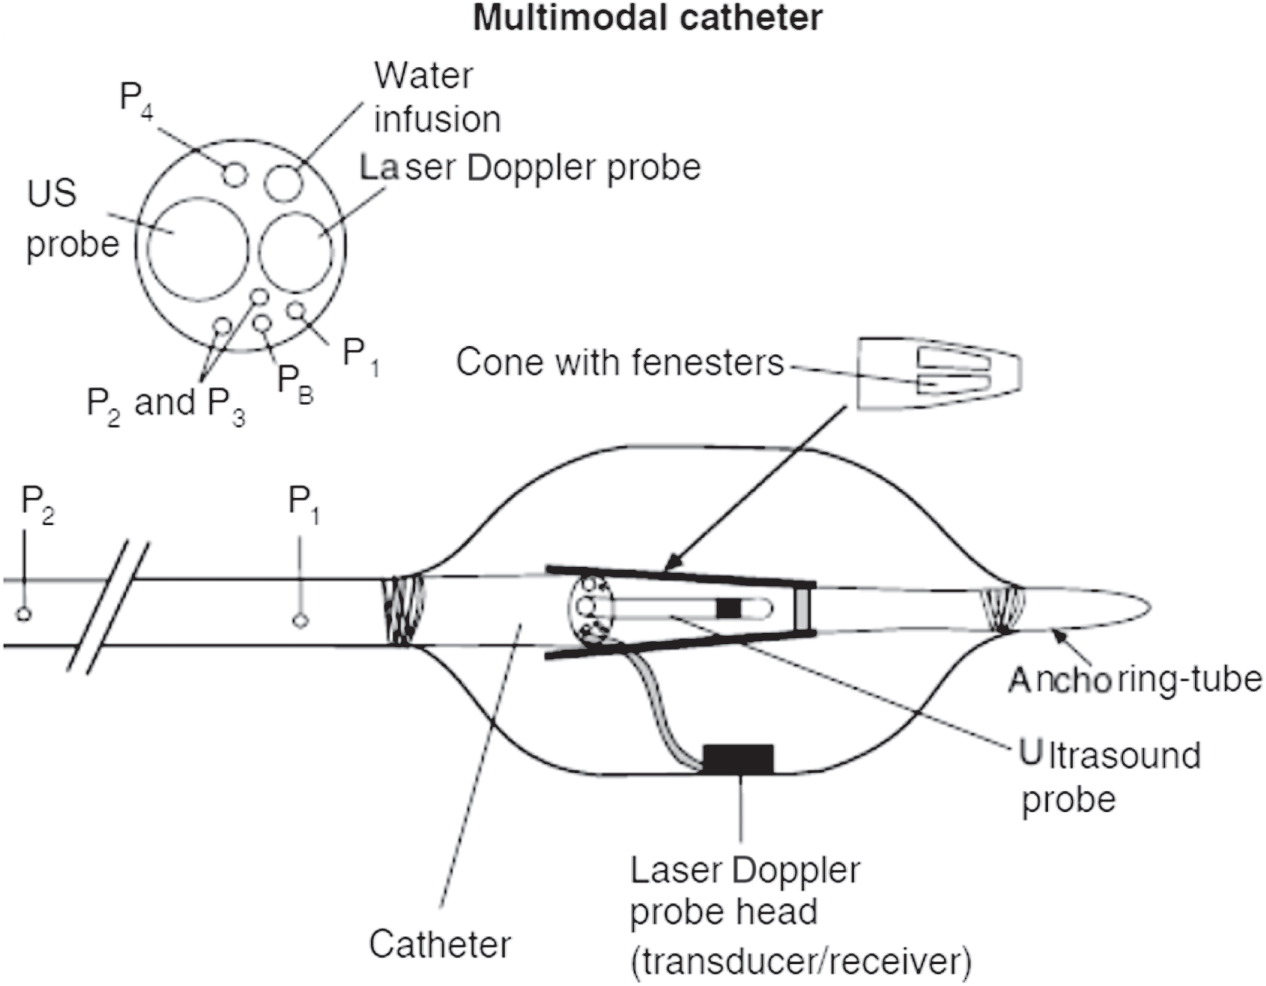
A further development has been the inclusion of an ultrasound miniprobe into multimodal catheters to study biomechanical properties of the esophageal wall (Hoff et al 2018). Hoff and coworkers used an inflatable bag catheter which included manometry proximal to and inside the bag, laser Doppler flowmetry, and an ultrasound miniprobe (figure 1) to measure wall thickness and compliance in patients with unexplained chest pain (Hoff et al 2006). It was possible to calculate wall stress and strain based on geometric measurements and relate these to sensation of discomfort and pain during distension of the bag. It was found that wall stress was more closely related to pain intensity, which may indicate that measurements of wall thickness by ultrasound was less precise or of less importance (Hoff et al 2010). These biomechanical measures were found to correlate with sensation, as opposed to perfusion of the mucosa as measured with laser Doppler flowmetry, indicating that the chest pain elicited was of biomechanical origin.

Figure 1. A multimodal catheter consisting of an inflatable bag catheter which included manometry proximal to and inside the bag, laser Doppler flowmetry, and an ultrasound miniprobe to measure wall thickness and compliance in patients with unexplained chest pain (Hoff DAL 2006). Laser Doppler flowmetry was used to assess mucosal blood flow (with permission from authors and journal). Hoff et al (2010). John Wiley & Sons. © 2010 Blackwell Publishing Ltd.
Download figure:
Standard image High-resolution imageA limitation compared to manometry and MRI has been that ultrasound records two-dimensional geometry, but does not usually allow for measurements at more than one level at a time, which limits the anatomical and functional evaluation of the organ (Zhao et al 2018).
Ultrasound of the stomach
The stomach is of obvious importance to digestion, with a dual mission: the proximal part (the fundus and the proximal part of the gastric corpus) of the stomach expands (accommodates) when we eat, allowing temporary storage of food, and the distal part (the distal part of the corpus and the antrum) of the stomach contracts and propels small portions of the food over to the duodenum for further digestion. Impairments in either function may provoke symptoms in patients. In addition, secretion of gastric fluids is crucial for digestion, but not usually studied by ultrasound. Relevant physiological measurements of the stomach are volume estimations and dynamic measurements: gastric emptying, antral contractility, transpyloric flow and proximal accommodation after a meal.
Ultrasound can provide qualitative and quantitative information about gastric motility, both fasting and after meal ingestion. It enables the operator to study effects of different meals on gastric motility and distribution, as long as visibility is maintained. The meal composition is of great importance here, as lipids and gas impair visibility. Water and carbohydrates do generally not offer any problems.
Contractile activity
Ultrasound is well suited for visualization and monitoring gastric contractions and propagation of waves (Bateman et al 1977, Holt et al 1980, Hausken and Berstad 1992, Hausken et al 1992, Wedmann et al 1995, Ahluwalia et al 1996). It is possible to measure both frequency and amplitude. The contraction amplitude is defined as the maximal reduction of antral area induced by a contraction, divided by relaxed area. Gastric wall layer involvement can be studied in detail during peristalsis (figure 2) by use of high-resolution ultrasound (frequencies in the range 7–15 MHz). For detecting antral contractions, and in particular non-occlusive contractions, ultrasound is more sensitive than manometry (Hveem et al 2001).

Figure 2. Ultrasound image of the fluid-filled gastric antrum in a horizontal section showing a non-occlusive contraction. All the five GI wall layers can be easily observed in the anterior part of the gastric wall.
Download figure:
Standard image High-resolution imageThe antral motility in a postprandial state can be reduced by acute mental stress. This was demonstrated in a study where the participants played a video game, trying to avoid collisions on a highway (Hausken et al 1993). Stress reduced mainly the amplitudes of antral contraction. To study the effect of motilin, assessment of antral contractions by ultrasound was found to be a well suited method, with the advantage of being non-invasive (Luiking et al 1998, Kamerling et al 2002). Others have studied how gastric contractility was affected by strenuous exercise (Brown et al 1994) and by consuming a dietary supplement of ginger (Wu et al 2008).
Gastric emptying
The gold standard for measurement of gastric emptying is still scintigraphy although this method has low spatial and temporal resolution. In the standard protocol, the patient ingests a meal of Tc-99m-labeled low-fat egg white, and an antero-posterior γ-camera is used to record the gastric area. Retention of >10% of the radiolabelled meal 4 hours after ingestion, or >60% after 2 h is considered pathological (Tougas et al 2000). However, the method has several disadvantages. Radiation exposure limits its application, in particular in women of childbearing potential, and the procedure is not suited for repeated measurements over time (Grover et al 2019). Other options for measuring gastric emptying include MRI, Wireless motility capsule and ultrasound.
Ultrasonography has been widely used to assess gastric emptying rates (Bateman and Whittingham 1982, Bolondi et al 1985, Holt et al 1986, Desaga and Hixt 1987, Duan et al 1993, Ricci et al 1993, Cordova-Fraga et al 2012), and good correlation to radionuclide estimates of emptying rates have been detected (Bolondi et al 1985, Tympner et al 1986, Marzio et al 1989, Jones et al 1997). It has a broad range of applications. Anaesthesiologists and surgeons use point-of-care ultrasound of the antrum to evaluate if the stomach is sufficiently empty before surgery, and to examine for post-operative gastric dysfunction (Perlas et al 2009, Coriat et al 2014, Mirbagheri et al 2016). Due to its accessibility and being radiation free, ultrasound is used in pregnancy and during labor to assess gastric emptying and gastric volume (Scrutton et al 1999, Wong et al 2007, Arzola et al 2018, Nascimento et al 2019). It is a widely used method for measuring gastric emptying in children, both preterm babies (Ewer et al 1994, McClure and Newell 1999, Indrio et al 2009a, Perrella et al 2015, Indrio et al 2017a) and infants (Fabiani et al 2000, Vivatvakin et al 2010, Indrio et al 2011, Indrio et al 2017b), as well as older children (Xiao et al 2013, Du et al 2017). Ultrasound is suitable to measure both gallbladder and gastric emptying simultaneously (Arienti et al 1994, Colecchia et al 2006). For comparing how different foods, medications and drinks affect gastric emptying, ultrasound is a natural choice. Furthermore, studies have been done to assess if gastric emptying is affected by milk in the tea compared to no milk (Hillyard et al 2014), or by artificial sweeteners compared to sugar in alcoholic beverages (Wu et al 2006), by chewing gum (Bouvet et al 2017) or smoking cigarettes (Lazaar et al 2015). These studies provide a scientific fundament for recommendations for pre-operative routines.
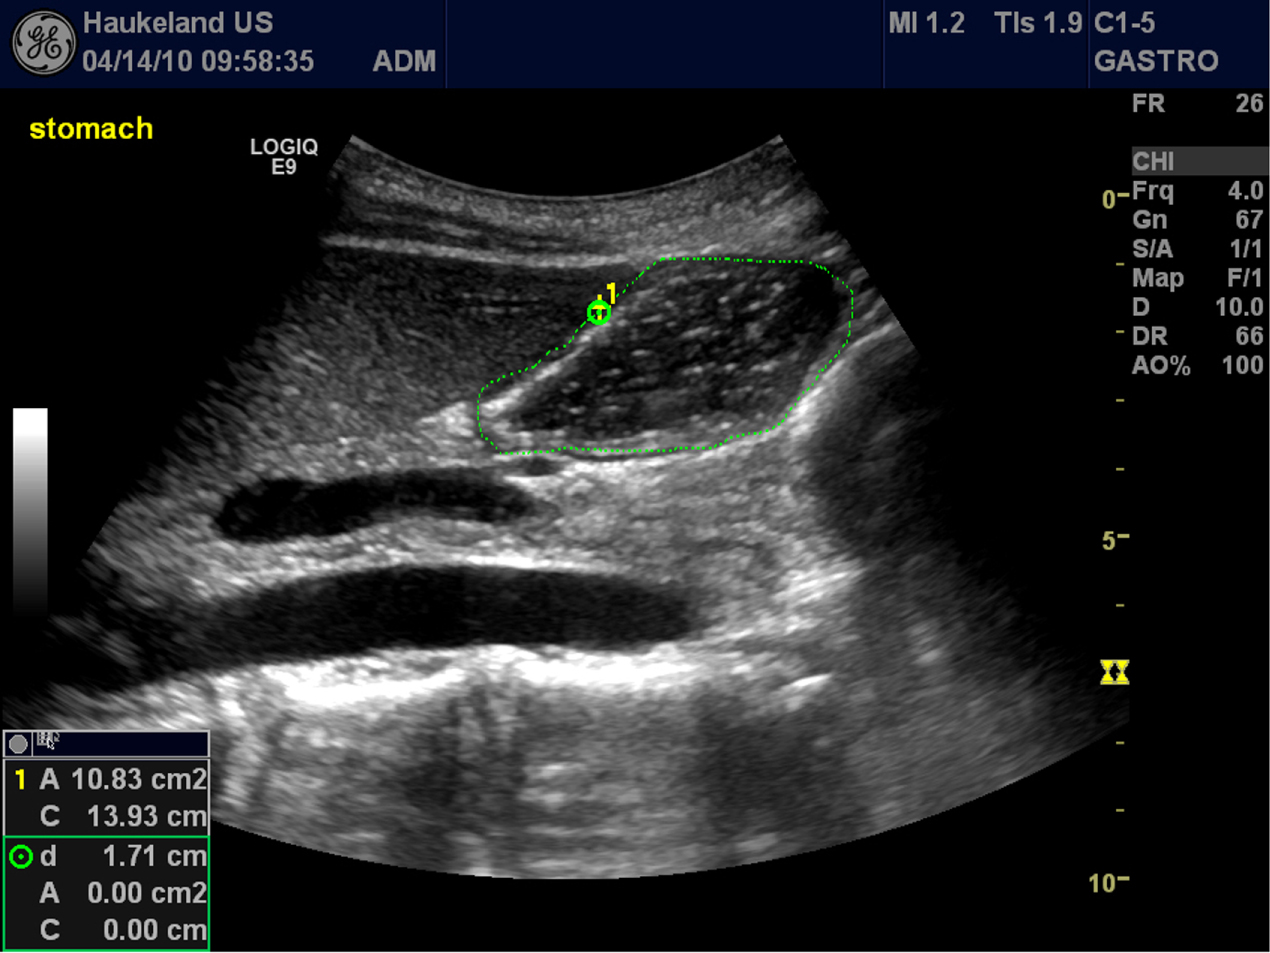
The antrum is the part of the human stomach that is easiest to visualize by ultrasound and is the most widely accepted section for assessing gastric emptying. A common method for scanning the antrum is to examine the patient in a semi-sitting position with a curvilinear probe finding a section where the aorta, superior mesenteric vein and antrum is concurrently visible (figure 3). In this way, the antrum can be visualized in both fasting and postprandial states. The antral area can be measured by tracing along the outer area of the muscularis propria (Fujigaki et al 1993, Hveem et al 1994), or by a calculation based on two perpendicular diameters from an image acquisition in a sagittal view (the cranio-caudal and antero-posterior diameters) (Bolondi et al 1985). Studies comparing liquid content of the stomach by estimated volume by ultrasound of the antrum, report a linear relationship between liquid contents and ultrasound area, with correlation coefficients between 0.6 and 0.9 (Van de Putte and Perlas 2014). However, the choice of liquid meal is of importance when using ultrasound, as fat and proteins may impact the visibility (Hjelland et al 2004).

Figure 3. The antrum visualized in a sagittal section (in the circumscribed area), using the aorta and superior mesenteric vein as landmarks. The liver is seen in the upper left corner of the ultrasonogram.
Download figure:
Standard image High-resolution imageGastroduodenal flow
Duplex ultrasound is a combination of Doppler measurement and B-mode image. This technique can be used to synchronously visualize the movements of gastroduodenal contents and velocity curves of transpyloric flow (King et al 1984, Hausken et al 1992). The physiology of gastric emptying and transpyloric flow has been investigated in several studies. By use of Duplex sonography, it was demonstrated that gastric emptying started simultaneously with intake of food (Hausken et al 1998, Minderhoud et al 2004). A short gush of duodenogastric reflux normally precedes the peristaltic closure of the pylorus, and this was first shown by Duplex sonography (Hausken et al 1992).
Strain imaging of the gastric wall
Tissue Doppler imaging is an ultrasound technique commonly used in cardiology, which enables mapping of local tissue velocities and providing information about moving walls (Grubb et al 1995, Uematsu et al 1997). A weakness of measuring the point velocity of tissue is that it does not differentiate between actively contracting and passively following tissue. To address this problem, a Doppler method based on strain rate imaging (SRI) was developed to enable this differentiation. Strain is an expression of tissue deformation as a function of stress or applied force. In general terms, strain means tissue deformation as a function of applied force (stress) (Gregersen et al 1999). The strain rate is a measure of the rate of deformation. SRI can be used to estimate strain in moving tissue, and Gilja et al showed in 2002 that it can facilitate detailed analysis of the gastric smooth muscle during contractions. It was even possible to discern the difference in contractility of the outer versus the inner muscular layers of the gastric wall (Gilja et al 2002). Furthermore, SRI also enables the examiner to assess non-occlusive contractions (Ahmed et al 2012). This is a great advantage compared to manometry, which rarely detects contractions of this character.
Gastric accommodation and intragastric distribution
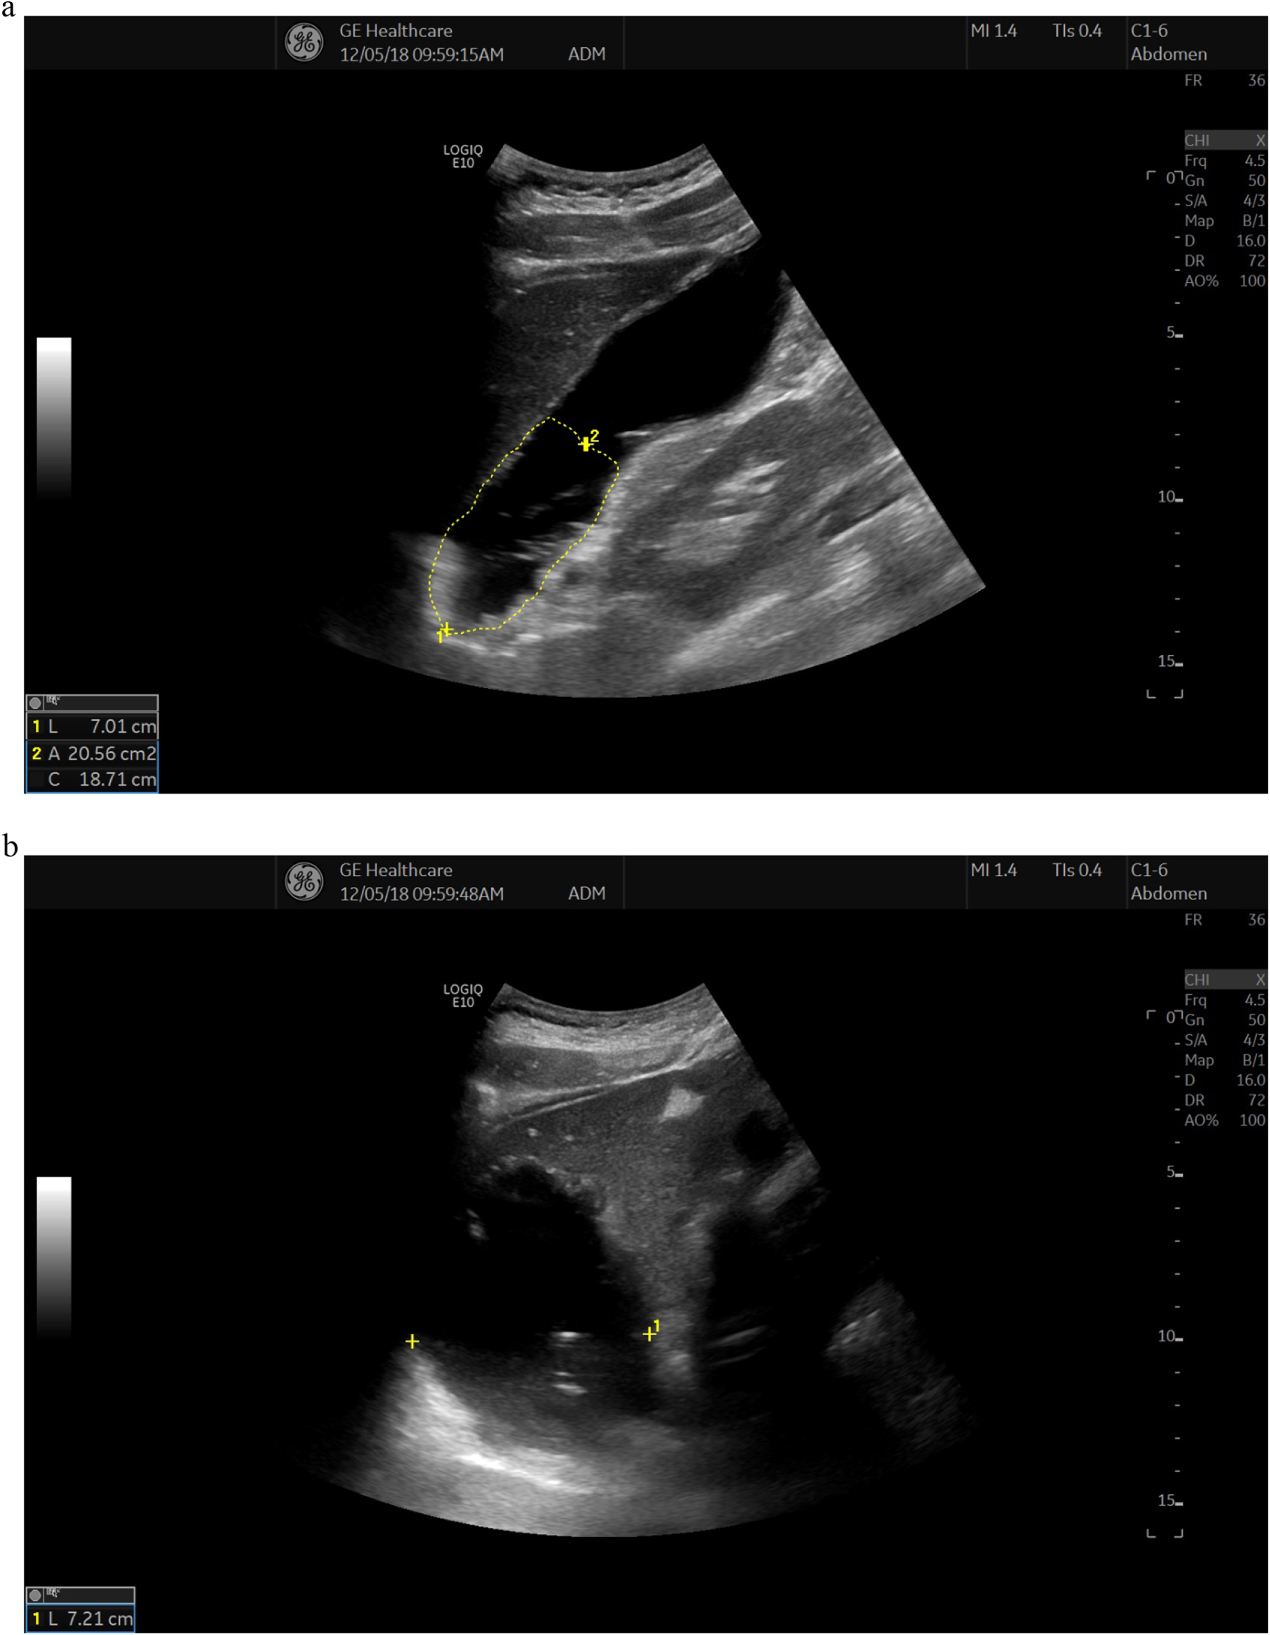
When ingesting a meal, the normal human stomach responds by reducing the tone in the wall and increasing compliance in the fundus and upper half of the corpus. This mechanism is initiated by reflexes triggered by the mechanical distention of the oesophageal wall (adaptive relaxation) and gastric wall (receptive relaxation). The result is an increased proximal volume, enabling the stomach to temporarily store the food until appropriate portions can be emptied into the duodenum. This process is called gastric accommodation and is largely depending on vagal nerve stimuli. Traditionally, the gastric accommodation was measured using the barostat, and this is still considered the golden standard for studying the phenomena (Azpiroz and Malagelada 1985, Tack et al 1998). The barostat is a device coupled to an intragastric balloon, allowing measurements of proximal intragastric volume and pressure during, i.e. a liquid meal. It is both and uncomfortable and may influence the accommodation (Mundt et al 2002). For this reason, other options for measuring gastric accommodation have been developed, including MRI, single photon emission CT and ultrasound (De Schepper et al 2004). The proximal gastric size can be measured using ultrasound to estimate accommodation of meals (Gilja et al 1995). To visualize the proximal stomach, the subject is seated in a chair, leaning slightly backwards. The transducer is positioned in the epigastrium by the left subcostal margin and tilted cranially. Two standardized image sections are chosen to monitor the proximal stomach size: first a sagittal section with the left renal pelvis in a longitudinal projection, the left lobe of the liver and the tail of the pancreas as internal landmarks (figure 4(a)). Second, the transducer is then rotated 90° clockwise to obtain an oblique frontal section where the left hemidiaphragm, the top margin of the fundus, and the liver parenchyma serve as landmarks (figure 4(b)). By using these two sections, accommodation has been studied in several patient groups. By this method, patients with functional dyspepsia (Gilja et al 1996, Lunding et al 2008, Fan et al 2013, Steinsvik et al 2016, Steinsvik et al 2020), diabetes (Undeland et al 1998), liver cirrhosis (Izbéki et al 2002), and children with recurrent abdominal pain (Olafsdottir et al 2000) were found to have impaired accommodation. Patients with irritable bowel syndrome had normal gastric accommodation (Steinsvik et al 2020), and patients with reflux esophagitis even showed signs of hyper accommodation or a distended proximal stomach (Tefera et al 2002).

Figure 4. (a) The proximal stomach after a liquid meal. Sagittal section of the proximal stomach. A proximal gastric area is outlined in the sagittal section by tracing from the top margin of the fundus and 7 cm downwards along the axis of the stomach. The left lobe of the liver is seen on the anterior side of the stomach and the left kidney is observed at the posterior of the stomach. (b) Oblique frontal section of the proximal stomach showing the diameter measurement after a liquid meal. The top margin of fundus and the hemidiaphragm is visualized at the bottom of the image.
Download figure:
Standard image High-resolution imageNitrogen monoxide is a key neurotransmitter in regulating adaptive relaxation (Hausken and Berstad 1994). In a double blind placebo-controlled cross-over study Gilja et al administered glyceryl trinitrate, an exogenous donor of NO, to patients with functional dyspepsia to study the effects on gastric accommodation and symptoms in response to a meal (Gilja et al 1997a). They found that glyceryl trinitrate caused a concomitant improvement of proximal gastric accommodation measured by ultrasound and epigastric pain, nausea and total symptom scores in response to a meat soup meal, confirming the usefulness of ultrasound in accommodation studies.
In another study, the proximal stomach was explored measuring the stomach at the level of the incisura angularis by ultrasound, in combination with multichannel high-resolution impedance-manometry (Storlid et al 2018). In this way, the gastric accommodation reflex, stress and strain of the stomach wall was assessed, demonstrating a marked drop in stomach pressure 60 s after ingestion of a liquid meal.
Three-dimensional (3D) ultrasound of total gastric volumes
3D imaging has been available for many years in several modalities, including computed tomography, MRI as well as ultrasound. 3D ultrasound has many applications including cardiology, obstetrics, visualization of vessels and lymph nodes, and in gastroenterology. It is particularly useful to estimate volumes of non-symmetrical organs such as the stomach and gallbladder.
A magnetometer-based position and orientation measurement (POM) device has been widely used to allow 3D ultrasound imaging of various organ systems. A system for magnetic scan head tracking was validated both with respect to its precision in locating specific points in space (Detmer et al 1994) and to its accuracy in volume estimation (Hodges et al 1994, Matre et al 1999). The technology was further developed, and enabled the operator to measure total gastric volumes and intragastric distribution of meals by ultrasonography (Gilja et al 1997b). A 3D reconstruction of the total stomach volume based on magnetic scan head tracking is depicted in figure 5.

Figure 5. A 3D reconstruction of the total stomach volume based on magnetic scan head tracking is depicted in the cube.
Download figure:
Standard image High-resolution imageNot only volume estimation can be done by 3D ultrasound. By using a Fourier series method and 3D ultrasound Liao and coworkers analyzed the surface of the gastric antrum, gastric fundus and whole stomach. They found that the geometry of the stomach cannot be assumed spherical, and this finding has implications to mathematical models of tension estimates based on Laplace's law (Liao et al 2004). 3D ultrasonography has been used to measure gastric volume and gastric emptying in several other studies (Tefera et al 2002, Gentilcore et al 2006, Van Lelyveld et al 2006, Dizdar et al 2007, Kuo et al 2009, Nair et al 2009, Vanis et al 2011, Giezenaar et al 2018).
Ultrasound of the small intestine
Small bowel physiology can be observed by investigating indirect consequences of digestion such as bowel motility and blood flow. This chapter will focus on these aspects of small bowel physiology and how they are affected by a meal.
Motility
After a meal enters the small bowel from the stomach peristalsis eventually will propagate the chyme through to the colon. The progression is not a steady one as the peristaltic contraction will start in several locations and go in both directions in the small bowel. The peristaltic contractions are more frequent and the propagation faster in the jejunum but will slow down going through the ileum. The slowing down is particularly apparent in the terminal ileum ('the ileal break') before crossing the ileocecal valve. The contractions are caused by slow wave activity from the interstitial cells of Cajal in Auerbachs plexus working as a pacemaker. The signals can be excited or inhibited leading to a contraction or not with humoral, neuronal or mechanical stimuli (Stanghellini et al 2000, Thomson et al 2003, Rao et al 2011, Malagelada and Malagelada 2017).
Motility can be studied directly studying peristaltic contractions or indirectly by studying transit times. Most methods in use cannot investigate all aspects of motility. To our knowledge, there is only one study that have investigated small bowel transit time with ultrasound. In 1996 Ahmed et al investigated the use of a 'sono-capsule' consisting of a 1 cm large latex balloon filled with water and a metal core in 10 healthy volunteers. They found that the passage through the small bowel took 1.5–3 h (Amend and Greiner 1996). No follow-up study was made so reliability is not known, but it is safe to assume that such a test would be quite work intensive as the average oropyloric time was 2.4 h which would require a repeated ultrasound investigation over a period of at least 5–6 h. In actual patients with reduced motility in the small bowel the investigation would be even longer.
There are more examples of studies that have investigated regional intestinal motility. For instance, quite a few have observed increased fasting motility in patients with celiac disease (Dietrich et al 1999, Rettenbacher et al 1999, Micetic-Turk et al 2001, Fraquelli et al 2004). In a group with suspected celiac disease Fraquelli et al found that 10/12 patients with celiac disease had frequent peristaltic activity everywhere in the small bowel during fasting (Fraquelli et al 2004). Only 19/150 of those without had the same finding. Unfortunately, this evaluation of motility is rather coarse. During fasting motility in the small bowel varies through three phases where phase three is short lasting (2–15 min) and is recognized by frequent peristaltic movement (Thomson et al 2003). The authors have no way of knowing if patients were in phase III or not (Fraquelli et al 2004, 2006). In a study by von Volkmann et al on patients with a defect in the GUCY2C gene causing familial GUCY-2 diarrhoea syndrome (FGDS), regional motility in the jejunum and terminal ileum was investigated using transabdominal ultrasound. They measured occlusive and non-occlusive contractions and found that the patients had significantly more non-occlusive and fewer occlusive contractions than the healthy volunteers in the terminal ileum. The patients also had more back-and-forth movement of intestinal content compared to the healthy volunteers. Furthermore, the patients had vast amounts of fasting fluid in the small bowel making observation of peristalsis easy. To achieve a similar volume effect on the intestine the healthy volunteers had to ingest a polyethylenglycol (PEG) solution, a laxative that is not absorbed in the intestine (von Volkmann et al 2016). In another study using a meal challenge, the same group compared the FGDS group with healthy volunteers over several time points and found that the FGDS patients had significantly more non-occlusive contractions in the ileum at all time points after the meal challenge. This time a PEG Solution was not used, but further validation of this method is needed and also its usefulness must be investigated for other patient groups (von Volkmann et al 2017) as non-occlusive contractions might be a finding specific for FGDS patients.
Blood flow
Just as motility of the small bowel is dependent on fasting state, blood flow in the bowel will also vary according to meal digestion. The regulation of the blood flow is complex and is dependent on central regulation and local adjustments. In contrast to motility, the flow is quite stable when the patient is fasting even during peristalsis as most of the increase in flow after a meal is due to increased mucosal flow (Granger and Kvietys 1981, Rosenblum et al 1997).
Ultrasound-quantification of blood flow can be performed mainly at two anatomical levels. The arterial flow to the small bowel goes mainly through the superior mesenteric artery. However, this vessel also supplies half of the colon and that is a confounding factor. Blood flow can also be measured directly in the bowel wall. Here several different ultrasound techniques such as color and power Doppler, pulse wave Doppler and contrast-enhanced ultrasound (CEUS) can be applied. The bowel wall is very thin, however, and it is challenging to do measurements in healthy bowel to establish normal values (Nylund et al 2017).
With pulse wave Doppler you can measure several parameters such as peak systolic velocity (PSV), end diastolic velocity (EDV) and derivatives of the flow curve over time of which one is the time averaged mean velocity (TAMV). By measuring the vessel area, the actual blood flow through the vessel in milliliters can be calculated. The sample area is placed within the vessel and for accuracy the direction of the vessel should be as close to the direction the ultrasound as possible. The angle cannot be more than 60 degrees because then the calculation errors will be too large. This can be a challenge for the SMA as it runs in parallel to the abdominal wall but is solved by tilting the probe as much as possible. There are two other parameters where you can avoid some of the inaccuracies of angle estimation. The fractions (PSV-EDV)/PSV and (PSV-EDV)/TAMV are called the resistive index and pulsatility index, respectively (Nylund et al 2017).
A large variability in the normal values limits its use for diagnostic purposes (Dietrich et al 2007). The method is well documented for identifying a stenosis of the SMA in patients with suspected chronic mesenteric ischemia (Revzin et al 2019). Using CT angiography as a reference standard the accuracy for detecting a significant stenosis in the celiac artery ranges from 82% to 93% and in the superior mesenteric artery from 81% to 96% (Moneta et al 1993, Zwolak et al 1998). Pulsed Doppler has no place in the diagnostics of patients with inflammatory bowel disease where there is much overlap between patients with active and inactive disease (Maconi et al 2018).
With color or power Doppler slow moving blood in intramural vessels can be detected. When performing the examination, the measurement is done within an adjustable region (box) and the size of the box should be fitted to and made as small as possible to ensure an adequate frame rate. The color hue describes the direction of movement while the intensity describes the movement speed. The settings should be optimized to ensure optimal detection of small vessels with slow moving blood within the bowel wall (Nylund et al 2017). Regardless of equipment, it is rare to detect more than one or two vessels within a normal bowel wall. The examination should be made on fasting patients for standardization, and to reduce movement artefacts caused by peristalsis making it difficult to separate noise from actual blood flow. In clinical practise different semi-quantitative scores are used describe the blood flow within the bowel wall and these are particularly used for patients with inflammatory bowel disease (Bots et al 2018, Maconi et al 2018).
While pulse wave Doppler measurement of the SMA are too far away from the target organ and color/power Doppler cannot be used for quantitative blood flow measurements, CEUS can be used for perfusion quantification. Ultrasound contrast consist of gas-filled microbubbles with a lipid coating that will oscillate when they are suspected to ultrasound of a certain frequency (Postema and Gilja 2011). The ultrasound contrast is injected intravenously, but contrary to CT or MRI contrast they stay inside the capillaries and are not dependent on functioning kidneys for expulsion. The gas is expelled through the lungs while the lipid coating is broken down in the liver. A specific contrast mode is used on the ultrasound scanner as the nonlinear signals that are reflected from these microbubbles can be detected while suppressing the tissue signal (Postema and Gilja 2011). There is also a clear relationship between the signal intensity and the amount of bubbles in the region of interest which should make it ideal for perfusion quantification (Lampaskis and Averkiou 2010).
Contrast-enhanced ultrasound has been available now for two decades and a multitude of different techniques have been introduced for interpreting the results. Some of the simpler methods used have been to measure the intensity of contrast in the GI wall at peak enhancement after a bolus injection (Ripolles et al 2011, Lu et al 2017). This has been introduced in clinical practice as it feasible without much post-processing but has not gained universal interest. Contrast-enhancement can also be analyzed over time (figure 6). This is called dynamic contract-enhanced ultrasound (DCE-US). The analysis of DCE-US recordings gives time-intensity curves (TIC) and require post-processing. It allows the investigator to look at both spatial and temporal changes in intensity. Some scanners have implemented software for generating TICs, but again it is mostly used as a research tool.

Figure 6. The bolus-and-burst technique: The ultrasound contrast agent Sonazoid was given as a bolus to a patient with Crohn's disease and terminal ileitis. In the upper panel the B-mode image on the left shows a slightly thickened terminal ileum between the abdominal wall and the psoas muscle. The contrast image on the right shows the intensely enhancing small bowel wall 13 s after the arrival of contrast and a yellow region of interest drawn in the anterior wall. Finally, the lower panel shows the evolution of the contrast enhancement over time. In the curve the first and second pass of contrast through the bowel wall is quite visible in the dataset as two intensity peaks. This is a mix of the arterial input function and the tissue perfusion function. After about 700 images (1 min after the bolus injection) the sharp increase in intensity is due to a burst of the bubbles due a brief exposure to ultrasound with a high mechanical index. Afterwards the tissue reperfusion can be observed without the contribution of the arterial input function.
Download figure:
Standard image High-resolution imageThe reason for this is most likely because of the multitude of factors that influence the intensity values and thus the perfusion quantification (Gauthier et al 2012a, 2012b, Jirik et al 2013, Frohlich et al 2015). Jirik et al have however suggested a solution for this using a method for estimating the arterial input function (Jirik et al 2013) and for scaling the blood volume to the flow in a vessel (Nylund et al 2013). The arterial input function dominates the first part of the time-intensity curve and is affected by such factors as the injection speed of the contrast bolus, the distance from the point of injection to the heart, the size and blood volume of the patient. By correcting for the arterial input function from the time-intensity curve you are left with the tissue residue function which is only dependent on the actual local blood flow. When combined with scaling the absolute blood flow in the bowel wall can be calculated. Nylund et al found that healthy volunteers had a blood flow of 44.9 ml/min/100 mltissue although the values varied from 6.6 to 91.2 ml (Nylund et al 2013). The large variability is probably due to the difficulties of performing perfusion measurements in the normal small bowel wall. The measurements using absolute perfusion estimation should be independent of patient- and equipment-related factors. Though not demonstrated in the bowel, studies suggest that the interobserver data for this method is promising (Engjom et al 2018) and that you can indeed compare perfusion parameters between different scanners (Stangeland et al 2017). Currently there are no commercial systems providing these data and since the post-processing is cumbersome, it is primarily a research tool. Absolute perfusion measurements in the intestinal wall in humans is not commonly performed as it is difficult to study. The values in the study by Nylund et al compare well to the results from Hulten et al from 1976. In a study using a gas washout technique they found that blood flow in the small intestinal wall was 38 (17–75) ml min−1 per 100 g in patients with a healthy bowel (Hulten et al 1976). This finding was later confirmed by Ahn et al using laser Doppler also in an intraoperative setting. Since interventions such as abdominal surgery tend to lower the perfusion in the bowel, the true value is probably higher (Ahn et al 1986).
Meal effects
The effects of a test meal on the small bowel have to some extent been studied using ultrasound. In a study by Nylund et al a meal of 300 kcal was given to 23 healthy volunteers. The wall thickness in the terminal ileum after 30 min increased from 1.2 to 1.3 mm. When measuring the individual wall layers it was clear that the changes could be attributed to increased thickness of the mucosa and submucosa (Nylund et al 2012).
Apart from the previously mentioned study by von Volkmann et al we did not find any studies investigating the motility of the small bowel after a meal challenge (von Volkmann et al 2017). In this study, the results from the analysis comparing the healthy before and after the meal are not shown. A figure showing boxplots of the amount of small bowel contractions at time periods 30, 60, 120 and 240 min seems to suggest that there are more occlusive contractions in the jejunum after the meal.
Several have investigated the changes in SMA flow. Already in 1988 Moneta et al examined seven healthy volunteers and before and after different meal challenges. The study included a water 'meal', a fatty meal, a carbohydrate meal, a protein meal and a mixed meal. They found a clear increase in all flow parameters with peak after 30 min. Similar studies have been performed several times, but often with slightly different set ups such as changes in meal composition or parameters being investigated (Giovagnorio et al 1998, Ludwig et al 1999). Generally, a fatty meal causes the largest increase in flow (Moneta et al 1988, Sidery et al 1994), but it may be delayed due to differences in gastric emptying. This can be avoided by giving the meal directly into the duodenum (Symersky et al 2007). Even the type of fatty acids used in the fatty meal can have different effects on the flow with long chain fatty acids (12–18 carbons) having the largest effect (Vu et al 2001). Also giving an parenteral nutrition actually seems to lower the flow in the SMA (Gatt et al 2009).
MRI has the last couple of years emerged as an interesting method for studying motility with several studies coming out only recently (Khalaf et al 2018, 2019, de Jonge et al 2019a, 2019b). Access to this technology could serve as an inspiration to develop similar ultrasound methods.
Ultrasound of the large intestine
In trained hands, ultrasound is easy to perform and can be used as a first-line diagnostic modality for the diseases of the colon. The best validated measure of disease is the bowel wall diameter. The thickness of the normal colonic wall does usually not exceed 3 mm and the wall layer stratification is preserved. By adding ultrasound elastography, the stiffness of chronic diseases due to increased fibrosis is possible to estimate. The bowel wall vascularity can similarly to the small intestine be assessed with Doppler and contrast techniques.
Bowel wall thickness
Nylund et al published a study of 122 healthy subjects aged 23–79 demonstrating wall thickness distribution throughout the GI tract. An abnormal GI wall should be suspected if the thickness exceeds 2–3 mm depending on localization, except for in the gastric antrum and rectum (Nylund et al 2012).
Bowel wall thickness in inflammatory bowel disease
The use of transabdominal ultrasound to follow-up active Crohn's disease is recommended in recent ECCO diagnostic guidelines (Maaser et al 2018), and an example is shown in figure 7. The role of ultrasound in ulcerative colitis (UC) is less documented. Maaser et al recently published a large study on UC. They evaluated intestinal ultrasound (IUS) in 224 patients with UC in routine medical practice. At baseline, 88.5% of the patients had an increased bowel wall thickness (BWT) >3 mm in the descending or sigmoid colon. After treatment the bowel wall thickness decreased in the sigmoid and descending colon and remained low at week 6 and 12. Normalization of BWT and clinical response after 12 weeks of treatment showed a high correlation (Maaser et al 2020).

Figure 7. Wall thickness in sigmoid colon in a patient with active Crohn's colitis. The asterixis indicate the muscularis propria of the colonic wall, and the luminal layer of the mucosa. A bowel wall thickness >3 mm is considered pathological.
Download figure:
Standard image High-resolution image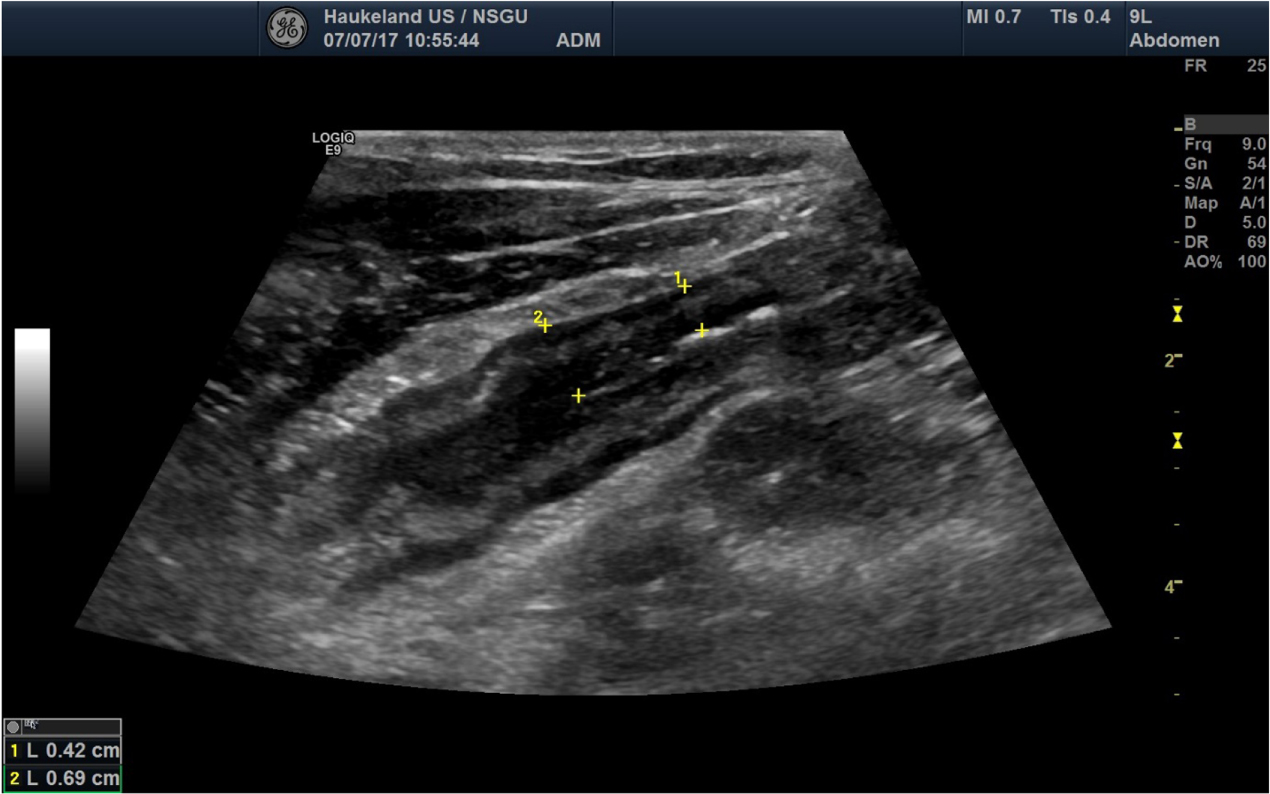
To characterize vascularity in IBD, Girlich et al examined the use of CEUS in 11 patients with UC. They found a significant correlation between disease activity by histology and the ratio of the time taken to reach peak the peak signal activity (Girlich et al 2012). Socaciu et al evaluated the usefulness of CEUS to assess disease activity in 65 patients with UC and found that AUC of time-intensity curves correlated with endoscopic activity. Furthermore, the sensitivity of CEUS in 22 patients with UC after repeating the measurements 3 months apart, the authors found that AUC demonstrated the best predictive marker of endoscopic activity (Socaciu et al 2015).
Diverticular disease and diverticulitis
Diverticulitis is also characterized using measures of the thickness of the colonic wall. In contrast to diverticulosis, diverticulitis is an inflammation complicated with fewer, transmural signs of infection which may lead to perforation, abscesses and end up with surgery if not treated.
In case of diverticulitis, intestinal wall thickening, pericolic inflammation and fluid can be detected adjacent to the diverticula. Using color Doppler US increased vascularity can be detected in the affected, inflamed, and thickened gut wall. Diagnostic accuracy of US and CT are comparable in diagnosing diverticulitis (Laméris et al 2008). US is recommended as the primary imaging modality (Bor et al 2016).
Another common cause for hospitalization with abdominal pain is appendicitis. This is routinely diagnosed by a combination of laboratory tests, clinical examination and imaging. CT and US are both frequently used and show comparable diagnostic accuracy (Laméris et al 2008).
Ultrasound of the rectum
The rectal diameter may be a relevant measurement in the assessment of constipation. Momeni et al examined children with constipation with transabdominal sonography for the evaluation of rectal diameter and rectal wall thickness. Ultrasonography was performed with a full urinary bladder to improve visualization of the lower GI tract. The rectal diameter was larger in children with constipation than in children without constipation, and the rectal wall was thinner. They concluded that transabdominal rectal diameter measurement may be useful in the diagnosis of constipation (Momeni et al 2019).
Conclusion
Ultrasound offers many possibilities of physiological measurements of the GI tract ranging from the basics of wall thickness and estimation of organ size and volume, to assessments of strain, stiffness, and vascularization. Being a real-time examination, ultrasound enables the user to measure and evaluate the function of the GI tract in various diseases. Most parts of the GI tract can be imaged with ultrasound non-invasively, although not every single loop of the intestines would be accessible due to overlaying gas-filled intestine. Regarding physiological measurement using ultrasound, the most frequent application is evaluation of gastric motility. Its wide availability and radiation-free technology makes ultrasound a practical and safe choice both for research and a large range of clinical applications.