

Abstract
The higher-order predictions of the lepton charge asymmetry  (the W-boson charge asymmetry
  ) for the leptonic final state of the W-boson hadroproduction in proton–proton (pp) collisions are presented. The predictions from the state-of-the-art computations are reported for achieving adequate description of the
  by including next-to-leading order (NLO) electroweak (EW) radiative corrections in combination with next-to-NLO (NNLO) quantum chromodynamics (QCD) radiative corrections. The combined predictions NNLO QCD+NLO EW and NNLO QCD × NLO EW, based on standard additive and factorised combination prescriptions in turn, are provided in the fiducial phase space of the pseudorapidity of the decay lepton (of the rapidity of the W-boson), comprising both central and forward detector acceptance regions as ηl ≤ 4.5 (yW ≤ 4.5). The inclusion of the NLO EW effects for the
  (
( ) constitutes additional input for the relative u- and d-quark densities in the proton, which is also of high importance in the domain of the high-precision studies. The predicted
  distributions are compared with the actual measurements by CERN Large Hadron Collider (LHC) experiments at 8 TeV pp collisions energies. The combined predictions for the
  (
( ) distributions are also provided in comparisons with the NNLO QCD predictions at both 13 TeV and 14 TeV energies. The impact of the NLO EW corrections for the
  (
( ) distributions is extensively assessed by means of relative correction factor analysis with respect to the NNLO QCD predictions, in addition to a detailed K-factor analysis with respect to the leading order (LO) accuracy. The predicted results show that the NLO EW effects have larger impact in the forward ηl region of the
  contrary to the central ηl region, and is sizable in some of the yW ranges of the
  . The paper suggests inclusion of the presented EW corrections at NLO to have explicit accounting for the EW effects for the
  (
( ) in phenomenological studies.
Export citation and abstract BibTeX RIS
1. Introduction
Productions of weak gauge bosons (W and Z bosons) through charged-current and neutral-current Drell-Yan mechanisms [1] have long been important benchmark processes at past and current hadron colliders. Hadroproductions of W and Z bosons provide prominent tests of quantum chromodynamics (QCD) and electroweak (EW) domains of the standard model (SM) of high-energy particle physics. These bosons have sizable production cross sections and are measured very precisely owing to small background contributions in their subsequent leptonic decay channels. These precise measurements enable substantial inputs for determination of parton distribution functions (PDFs) in the proton. Their hadroproductions feature other experimental aspects such as improving modeling of rarer SM background processes and in new physics searches, as well as improving calibration of detector response for better lepton, missing transverse energy, and jet resolutions. In addition, both W- and Z-boson hadroproductions constitute a broad testing ground for Monte Carlo generators and higher-order theoretical tools.
W-boson hadroproduction in its leptonic decay channel is proceeded by one high transverse momentum pT
-isolated lepton and significant amount of missing transverse energy due to detector-escaping neutrino, particularly in proton-proton (pp) collisions at the CERN Large Hadron Collider (LHC) as pp → W± → l±
ν+X. Here l is either an electron e or a muon μ and X stands for accompanying final state. W± bosons are predominantly produced via annihilation mechanism of a valence quark with a sea antiquark from interacting protons as  and
and  . W+ bosons have higher production rates than W− bosons as required by the excess of two valence u quarks over one valence d quark in the proton. This asymmetry as a consequence of difference in W+ and W− boson production rates is called as W-boson charge asymmetry, which is expressed by their cross sections σ(W+ → l+
ν) and
. W+ bosons have higher production rates than W− bosons as required by the excess of two valence u quarks over one valence d quark in the proton. This asymmetry as a consequence of difference in W+ and W− boson production rates is called as W-boson charge asymmetry, which is expressed by their cross sections σ(W+ → l+
ν) and  in differential form as a function of W boson rapidity yW
as
in differential form as a function of W boson rapidity yW
as

W-boson charge asymmetry  is mainly sensitive to valence u- and d-quark distributions in terms of incoming parton momentum fractions (Bjorken x values), because yW
depends strongly on x values as from the expression
is mainly sensitive to valence u- and d-quark distributions in terms of incoming parton momentum fractions (Bjorken x values), because yW
depends strongly on x values as from the expression  , where mW
stands for the mass of the W-boson and
, where mW
stands for the mass of the W-boson and  does for the center-of-mass energy. The sensitivity to the valence quark distributions can be shown by rewriting the equation (1) in terms of the valence (sea) quark distributions u(x) (
 ) and d(x) (
 ) as
) as

where the expression is simplified with the approximation  by treating the sea quark contributions to the proton momentum to be equal such as for small x values in the central region yW
∼ 0. Moreover,
by treating the sea quark contributions to the proton momentum to be equal such as for small x values in the central region yW
∼ 0. Moreover,  exhibits symmetric characteristic with respect to yW
in pp collisions, whereas it is antisymmetric in
exhibits symmetric characteristic with respect to yW
in pp collisions, whereas it is antisymmetric in  collisions as because of strongly reduced sensitivity to sea-quark contributions. Although
  can be predicted theoretically, it cannot be directly determined in experiments due to absence of information about longitudinal component of neutrino's momentum from W-boson decay. Despite this experimental restriction, the same information as
  can still be attained by measurements of charge asymmetry using decay lepton from W boson. This lepton charge asymmetry can readily be measured in terms of decay lepton pseudorapidity ηl
(where it is literally linked to yW
), by exploiting a definition analogously from equation (1) as
can still be attained by measurements of charge asymmetry using decay lepton from W boson. This lepton charge asymmetry can readily be measured in terms of decay lepton pseudorapidity ηl
(where it is literally linked to yW
), by exploiting a definition analogously from equation (1) as

Lepton charge asymmetry  stands for both the original
  observable and the V–A (vector–axial vector) structure of W boson which are convoluted, where the V–A structure signifies anisotropic decay of W-boson in leptonic mode. By the same token as
  , precise measurement of
  variable provide considerable constraints for the relative densities of u and d quarks in the proton as functions of parton x values.
  variable can also be exploited to extract additional information for sea-quark distributions and to distinguish among various PDF models relying on different parametrization. In addition,
  is favored by actual experiments as experimental uncertainties partially cancel in its measurements resulting in greater precision in tests of the SM.
Charge asymmetry measurements for inclusive W-boson hadroproduction were mostly carried out using  observable by the CDF and D0 Collaborations at the Tevatron [2–9] based on
  collisions data.
  measurements were carried out in the ATLAS and CMS experiments at the LHC using pp collisions data in the central detector acceptance ∣ηl
∣ ≤ 2.5 at various center-of-mass energies up to 8 TeV [10–17].
measurements were carried out in the ATLAS and CMS experiments at the LHC using pp collisions data in the central detector acceptance ∣ηl
∣ ≤ 2.5 at various center-of-mass energies up to 8 TeV [10–17].  was complementarily measured in the LHCb experiment at the LHC up to 8 TeV [18–21] for the forward region 2.0 ≤ ηl
≤ 4.5 going beyond the central acceptance region. The LHC measurements have already investigated into
was complementarily measured in the LHCb experiment at the LHC up to 8 TeV [18–21] for the forward region 2.0 ≤ ηl
≤ 4.5 going beyond the central acceptance region. The LHC measurements have already investigated into  variable for a broad range of x values 10−4 < x < 1, enabling improvements for existing PDF constraints at very small and large x values. Furthermore, precise measurements of
  pave the way for stringent tests of higher-order theoretical calculations beyond leading order (LO) which are convoluted with different PDFs. Ensuing the precision level attained by the LHC measurements, this in turn necessitates theoretical computations to include next-to-LO (NLO) and next-to-NLO (NNLO) radiative corrections in the strong coupling αS
and as well as in the EW coupling α of underlying perturbation theory. Calculations for radiative corrections to Drell-Yan processes in terms of inclusive cross section have been carried out since for some time at NLO [22] and NNLO [23, 24] in QCD perturbation theory. NNLO QCD corrections to W boson differential cross section in leptonic decay modes have also been calculated [25–29]. The dominant EW radiative corrections are induced by quantum electrodynamics (QED) effects in distributions of leptons in final states, and by substantial Sudakov logarithms [30] regarding kinematic distributions at very high energies. In accordance with this information, calculations of EW corrections up to NLO were also reported thoroughly for W-boson leptonic decay in the related literature [31–35]. Higher-order calculations continue to advance by also the inclusion of mixed QCD-EW effects of
pave the way for stringent tests of higher-order theoretical calculations beyond leading order (LO) which are convoluted with different PDFs. Ensuing the precision level attained by the LHC measurements, this in turn necessitates theoretical computations to include next-to-LO (NLO) and next-to-NLO (NNLO) radiative corrections in the strong coupling αS
and as well as in the EW coupling α of underlying perturbation theory. Calculations for radiative corrections to Drell-Yan processes in terms of inclusive cross section have been carried out since for some time at NLO [22] and NNLO [23, 24] in QCD perturbation theory. NNLO QCD corrections to W boson differential cross section in leptonic decay modes have also been calculated [25–29]. The dominant EW radiative corrections are induced by quantum electrodynamics (QED) effects in distributions of leptons in final states, and by substantial Sudakov logarithms [30] regarding kinematic distributions at very high energies. In accordance with this information, calculations of EW corrections up to NLO were also reported thoroughly for W-boson leptonic decay in the related literature [31–35]. Higher-order calculations continue to advance by also the inclusion of mixed QCD-EW effects of  which are based on dedicated approaches including such as the pole approximation [36–38].
In this phenomenological work, the state-of-the-art predictions, including both NNLO QCD and NLO EW radiative corrections, are reported for the charge asymmetry observable  (
( ) of the W-boson hadroproduction at the LHC. The study aims to fill gaps in the related literature by explicitly carrying out the computations of the combined predictions NNLO QCD+NLO EW and NNLO QCD × NLO EW to have explicit accounting for the NLO EW effects for the
  (
( ) distribution in the fiducial phase space spanning from central to forward region as ηl
≤ 4.5 (yW
≤ 4.5). The combined NNLO QCD and NLO EW predictions are compared with the fixed-order NNLO QCD predictions, and are more necessarily justified by the comparisons with the LHC pp collisions data at 8 TeV energy. The impact of the NLO EW effects on the
) distribution in the fiducial phase space spanning from central to forward region as ηl
≤ 4.5 (yW
≤ 4.5). The combined NNLO QCD and NLO EW predictions are compared with the fixed-order NNLO QCD predictions, and are more necessarily justified by the comparisons with the LHC pp collisions data at 8 TeV energy. The impact of the NLO EW effects on the  (
( ) distribution at 13 TeV and 14 TeV energies are assessed by performing detailed studies of the NLO EW correction factors with regards to the (N)NLO QCD, and to the LO based on a detailed K-factor analysis. Moreover, the relative sizes of the NLO EW effects in the combined predictions are considered for the W±-boson differential cross sections for a comprehensive assessment of the NLO EW effects for the
  (
( ). The presented results clearly represent an important input for both theoretical predictions and experimental measurements to consider proper inclusion of the NLO EW corrections for a thorough description of the
  (
( ) distributions.
2. Details of the computations
Higher-order differential cross section calculations, from which the charge asymmetry  (
( ) predictions are obtained, are performed by using the MATRIX framework (version 2.0.0) [28, 39, 40]. The working instructions for setting up and running the MATRIX framework can be found in the [39], where they are readily available to use in a practical manner. The computations of cross sections are performed by relying on the Catani-Seymour dipole-subtraction approach at NLO QCD [41, 42] and NLO EW [43–47]. Besides that the computations of cross sections at NNLO QCD are achieved relying on the qT-subtraction formalism [48, 49]. The qT-subtraction method facilitates regularization for soft and collinear divergences of the real radiation contributions in the calculations by means of a cut-off value for the slicing parameter rcut
, which is fixed at rcut
= 0.0015(0.15%). The MATRIX framework is incorporated with the OpenLoops program through an interface to compute the required tree-level and one-loop scattering amplitudes [50–54], including spin- and color-correlated amplitudes for the subtraction of divergences. Leptons (both e and μ) as well as light quarks are considered to be massless except for top quark with mass mt
= 173.2 GeV from the default model-related settings of the framework. The W boson is treated off-shell with leptonic final states based on the complex-mass scheme [55]. In this scheme, the EW mixing angle as
) predictions are obtained, are performed by using the MATRIX framework (version 2.0.0) [28, 39, 40]. The working instructions for setting up and running the MATRIX framework can be found in the [39], where they are readily available to use in a practical manner. The computations of cross sections are performed by relying on the Catani-Seymour dipole-subtraction approach at NLO QCD [41, 42] and NLO EW [43–47]. Besides that the computations of cross sections at NNLO QCD are achieved relying on the qT-subtraction formalism [48, 49]. The qT-subtraction method facilitates regularization for soft and collinear divergences of the real radiation contributions in the calculations by means of a cut-off value for the slicing parameter rcut
, which is fixed at rcut
= 0.0015(0.15%). The MATRIX framework is incorporated with the OpenLoops program through an interface to compute the required tree-level and one-loop scattering amplitudes [50–54], including spin- and color-correlated amplitudes for the subtraction of divergences. Leptons (both e and μ) as well as light quarks are considered to be massless except for top quark with mass mt
= 173.2 GeV from the default model-related settings of the framework. The W boson is treated off-shell with leptonic final states based on the complex-mass scheme [55]. In this scheme, the EW mixing angle as  (and α) is defined using complex W- and Z-boson mass terms Moreover, the Gμ
input scheme is employed for the parametrization of the EW sector, implying the W-boson interactions with fermion currents, which encompasses the Fermi constant GF
and the weak boson masses mW
and mZ
. The related input values in the computations are used in line with the PDG [56] values for mW
, mZ
, decay widths ΓW
and ΓZ
, and GF
as the followings
(and α) is defined using complex W- and Z-boson mass terms Moreover, the Gμ
input scheme is employed for the parametrization of the EW sector, implying the W-boson interactions with fermion currents, which encompasses the Fermi constant GF
and the weak boson masses mW
and mZ
. The related input values in the computations are used in line with the PDG [56] values for mW
, mZ
, decay widths ΓW
and ΓZ
, and GF
as the followings

The values for the CKM matrix elements are fully adopted from the PDG [56] as per the default setting. Exceptionally, the one-loop diagrams with CKM in the EW contributions to off-shell W± process are not available within the OpenLoops program and their EW contributions are approximated using a trivial CKM matrix.
The quark-photon channels at NLO EW can result in considerable enhancement of the photon-induced effects and the contributions from these effects need to be accounted for in the computations. Collinear photon and charged lepton pairs are recombined into dressed leptons within a cone, where radius of cone ΔR is defined in terms of separations in azimuthal angle and pseudorapidity between photons and leptons and its value is set up to 0.1. Throughout the computations all phase space cuts, kinematic observables, and scales are considered using dressed lepton definition. Moreover, PDFs which take into account QED effects, are required to include  contributions for reliable cross-section calculation of hadronic decay processes. The NNPDF31 [57] PDF models are utilized based on the LUXqed methodology [58] which also include QED evolution for the determination of photon density. More precisely, NNPDF31_nlo_as_0118_luxqed and NNPDF31_nnlo_as_0118_luxqed PDF sets are used at appropriate perturbative orders that are all based on the αs
(mZ
) = 0.118 value. The LHAPDF (v6.2.0) platform [59] is exploited for the purpose of evaluation of the PDF sets.
contributions for reliable cross-section calculation of hadronic decay processes. The NNPDF31 [57] PDF models are utilized based on the LUXqed methodology [58] which also include QED evolution for the determination of photon density. More precisely, NNPDF31_nlo_as_0118_luxqed and NNPDF31_nnlo_as_0118_luxqed PDF sets are used at appropriate perturbative orders that are all based on the αs
(mZ
) = 0.118 value. The LHAPDF (v6.2.0) platform [59] is exploited for the purpose of evaluation of the PDF sets.
The calculations are carried out using realistic fiducial phase spaces regarding leptonic decay of W boson. Fiducial requirements are adopted from the actual charge asymmetry measurements that were based on 8 TeV data by the CMS [13] and LHCb [20] experiments at the LHC. The decay leptons (e or μ) with transverse momentum either  25GeV in the central region 0 ≤ ηl
≤ 2.4 or
25GeV in the central region 0 ≤ ηl
≤ 2.4 or  20 GeV in the forward region 2.0 ≤ ηl
≤ 4.5 are required to validate the calculations with the reference 8-TeV CMS and LHCb results, respectively. In the calculations at 13 TeV and 14 TeV, the leptons with
20 GeV in the forward region 2.0 ≤ ηl
≤ 4.5 are required to validate the calculations with the reference 8-TeV CMS and LHCb results, respectively. In the calculations at 13 TeV and 14 TeV, the leptons with  25 GeV are required in the entire acceptance spanning over both central and forward regions as 0 ≤ ηl
≤ 4.5. There are no requirements applied for either the transverse mass of the W boson or the missing transverse energy resulted from the decay neutrino, whereas these requirements can intentionally be utilized in pure experimental studies. Despite no explicit criteria are required for final-state jet(s), unresolved hadronic emission is permitted accompanying the leptonic final state of the W boson.
25 GeV are required in the entire acceptance spanning over both central and forward regions as 0 ≤ ηl
≤ 4.5. There are no requirements applied for either the transverse mass of the W boson or the missing transverse energy resulted from the decay neutrino, whereas these requirements can intentionally be utilized in pure experimental studies. Despite no explicit criteria are required for final-state jet(s), unresolved hadronic emission is permitted accompanying the leptonic final state of the W boson.
Calculations of hadronic cross sections in the context of perturbative QCD theory have dependance on both the renormalization scale μR and the factorization scale μF . The μR and μF are set equal to

in the computations. The ζR = ζF = 1 condition refers to the choice of central scale. Theoretical uncertainties from excluded QCD corrections beyond NNLO are estimated by varying the scales μR and μF using the usual 7-point variations (ζR , ζF )=(2,2), (2,1), (1,2), (1,1), (1,1/2), (1/2,1), (1/2,1/2). PDF uncertainties are also estimated by following the steps aas prescribed by the PDF4LHC working group [59, 60] so as to account for imperfect modeling of PDFs. In addition, uncertainties due to αs value are estimated by shifting αs by 0.001 up and down with regards to the default value of 0.118, which is the one exactly considered in the PDF sets. Finally, quadratic sum of scale, PDF, and αs uncertainties is considered in evaluation of total theoretical uncertainties, where they are quoted symmetrically in the predictions by taking the uncertainty only from the largest variation.
To this end, combination procedure of QCD and EW corrections in the computations needs to be reminded briefly (based on the [40]) in the following. Corrections at NNLO in QCD and at NLO in EW are combined using both standard additive and factorised (multiplicative) prescriptions. At higher orders, these corrections to differential cross section d σNNLO QCD and d σNLO EW can be expressed by making use of correction factors δQCD and δEW relative to the differential cross section at LO d σLO, respectively as

The first prescription corresponds to an additive combination as NNLO QCD+NLO EW, which is to be expressed in the following form

Factorised prescription is considered as an alternate combination NNLO QCD × NLO EW as given below

where it apparently enables an approximation of the additional QCD-EW contributions that are mixed at higher orders in the forms of  and
and  . Consequently, the factorised approach can be used to estimate roughly systematic uncertainty due to missing higher-order EW effects from the generated mixed QCD-EW contributions for the combined predictions based on the additive approach. Finally in the computations of the combined predictions from both the prescriptions, individual partonic channels
  at all orders of QCD, qg and
  at NLO QCD, gg and
  at NNLO QCD, and photon-induced channels q(g)γ at NLO EW are all naturally included.
3. Validation of the combined predictions
The combined predictions NNLO QCD+NLO EW and NNLO QCD × NLO EW, based on both additive and multiplicative prescriptions in turn, are compared with the actual  measurements available in the ηl
bins at 8 TeV. The combined predictions are compared also with the fixed-order NNLO QCD in addition to the CMS [13] and LHCb [20] measurements in the central ηl
≤ 2.4 and forward 2.0 ≤ ηl
≤ 4.5 regions, respectively. The predictions are acquired for the μ decay channel with the criterion of
measurements available in the ηl
bins at 8 TeV. The combined predictions are compared also with the fixed-order NNLO QCD in addition to the CMS [13] and LHCb [20] measurements in the central ηl
≤ 2.4 and forward 2.0 ≤ ηl
≤ 4.5 regions, respectively. The predictions are acquired for the μ decay channel with the criterion of  25 (20) GeV in the central (forward) acceptance to allow for direct comparisons with the measurements. The bin ranges for the ημ
are identical to those used in the measurements for the central and forward regions, respectively, as provided below
25 (20) GeV in the central (forward) acceptance to allow for direct comparisons with the measurements. The bin ranges for the ημ
are identical to those used in the measurements for the central and forward regions, respectively, as provided below
The NNLO PDF set NNPDF31 LUXqed is exploited in the predictions. Estimates of total theoretical uncertainty in the form of quadratic sum of scale, PDF, and αs
uncertainties are included for the predicted results, while total experimental uncertainty of both statistical and systematic components, which are quadratically summed as well, is quoted for the data points. The predicted  distributions at NNLO QCD, NNLO QCD+NLO EW, and NNLO QCD × NLO EW are shown in comparisons with the data distributions in figure 1. The combined predictions are observed to exhibit only slight deviations from the fixed-order NNLO QCD in the entire region ημ
≤ 4.5. The combined predictions generally reproduce the data distributions in the central ημ
region up to a difference that amounts to less than ∼5% within uncertainties. Nevertheless the combined predictions appear to overestimate the data up to ∼5%–6% in the forward ημ
region 2.75–4.0, the theoretical uncertainty is observed to be generally larger in this region as well. Consequently, the combined predictions including NLO EW corrections are justified without the presence of significant deviations from the pp collision data at 8 TeV. Apart from the presented validation, comparisons of the same kind of NNLO QCD predictions with the data are readily available for the
distributions at NNLO QCD, NNLO QCD+NLO EW, and NNLO QCD × NLO EW are shown in comparisons with the data distributions in figure 1. The combined predictions are observed to exhibit only slight deviations from the fixed-order NNLO QCD in the entire region ημ
≤ 4.5. The combined predictions generally reproduce the data distributions in the central ημ
region up to a difference that amounts to less than ∼5% within uncertainties. Nevertheless the combined predictions appear to overestimate the data up to ∼5%–6% in the forward ημ
region 2.75–4.0, the theoretical uncertainty is observed to be generally larger in this region as well. Consequently, the combined predictions including NLO EW corrections are justified without the presence of significant deviations from the pp collision data at 8 TeV. Apart from the presented validation, comparisons of the same kind of NNLO QCD predictions with the data are readily available for the  distribution in the [61, 62], exploiting several PDF sets without the QED effects. In these references, it has been relevantly shown that the small residual discrepancy with the data can be attributed to the large power corrections. The power-suppressed terms in these corrections, which survive after the elimination of infrared singularities at finite rcut
value, essentially stem from fiducial phase space cuts applied on the decay products.
distribution in the [61, 62], exploiting several PDF sets without the QED effects. In these references, it has been relevantly shown that the small residual discrepancy with the data can be attributed to the large power corrections. The power-suppressed terms in these corrections, which survive after the elimination of infrared singularities at finite rcut
value, essentially stem from fiducial phase space cuts applied on the decay products.

Figure 1. The  distributions by the NNLO QCD and the combined NNLO QCD and NLO EW predictions in comparisons with the CMS data in ημ
≤ 2.4 (top) and with the LHCb data in 2.0 ≤ ημ
≤ 4.5 (bottom) at 8 TeV. Total theoretical uncertainty from scale, PDF, and αs
uncertainties is included for the predictions and total experimental uncertainty is quoted for the data. In the lower insets, the predictions-to-data ratios are shown.
distributions by the NNLO QCD and the combined NNLO QCD and NLO EW predictions in comparisons with the CMS data in ημ
≤ 2.4 (top) and with the LHCb data in 2.0 ≤ ημ
≤ 4.5 (bottom) at 8 TeV. Total theoretical uncertainty from scale, PDF, and αs
uncertainties is included for the predictions and total experimental uncertainty is quoted for the data. In the lower insets, the predictions-to-data ratios are shown.
Download figure:
Standard image High-resolution imageThe  and
and  distributions by the combined predictions are compared with the NNLO QCD one to assess the impact of the inclusion of NLO EW effects at 13 and 14 TeV of current and future LHC energies. The predictions are provided for the combined e and μ decay channels with
  25 GeV requirement for the entire detector acceptance comprising both central and forward acceptances as ηl
≤ 4.5. The bin edges are used as the same for the ηl
and yW
, which are taken the same as those given in equation (9) in the entire region 0–4.5 except for the modified bin ranges 2.4–2.7, 2.7–3.0, and 3.0–3.5. The
25 GeV requirement for the entire detector acceptance comprising both central and forward acceptances as ηl
≤ 4.5. The bin edges are used as the same for the ηl
and yW
, which are taken the same as those given in equation (9) in the entire region 0–4.5 except for the modified bin ranges 2.4–2.7, 2.7–3.0, and 3.0–3.5. The  distributions are displayed in figure 2 with the comparisons of the combined predictions to the QCD prediction at NNLO. The contribution of NLO EW corrections are at a few percent level for the ηl
range 0–3.5 regardless of the type of prescription employed in the combination with respect to the NNLO QCD. The differences among the predictions with and without NLO EW are relatively larger for the ηl
range 3.5–4.5, where also uncertainties grow larger. Alternatively the
distributions are displayed in figure 2 with the comparisons of the combined predictions to the QCD prediction at NNLO. The contribution of NLO EW corrections are at a few percent level for the ηl
range 0–3.5 regardless of the type of prescription employed in the combination with respect to the NNLO QCD. The differences among the predictions with and without NLO EW are relatively larger for the ηl
range 3.5–4.5, where also uncertainties grow larger. Alternatively the  distributions are provided in figure 3 by noting larger uncertainties towards the central yW
range 0–0.4. Similarly to the
distributions are provided in figure 3 by noting larger uncertainties towards the central yW
range 0–0.4. Similarly to the  , the predictions using both types of combination prescription are consistent with each other regarding their estimated uncertainties for the probed yW
range. The differences among the predictions with and without NLO EW are noted throughout the entire yW
region, but they are relatively larger in the central and intermediate region for the
, the predictions using both types of combination prescription are consistent with each other regarding their estimated uncertainties for the probed yW
range. The differences among the predictions with and without NLO EW are noted throughout the entire yW
region, but they are relatively larger in the central and intermediate region for the  distributions as opposed to the
  distributions, where the inclusion of NLO EW effects appear to have larger impact.
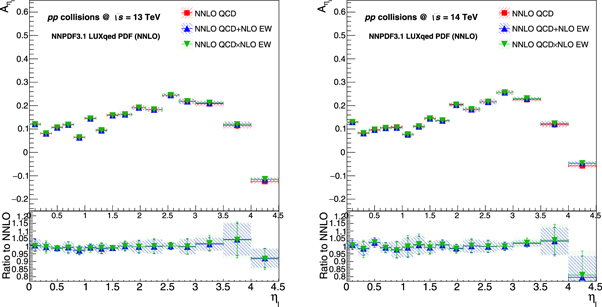
Figure 2. The  distributions by the NNLO QCD and the combined NNLO QCD and NLO EW predictions in ηl
≤ 4.5 at 13 TeV (left) and 14 TeV(right) energies. Total theoretical uncertainty from scale, PDF, and αs
uncertainties is quoted for the predicted distributions. In the lower insets, the combined predictions-to-NNLO QCD prediction ratios are shown.
distributions by the NNLO QCD and the combined NNLO QCD and NLO EW predictions in ηl
≤ 4.5 at 13 TeV (left) and 14 TeV(right) energies. Total theoretical uncertainty from scale, PDF, and αs
uncertainties is quoted for the predicted distributions. In the lower insets, the combined predictions-to-NNLO QCD prediction ratios are shown.
Download figure:
Standard image High-resolution image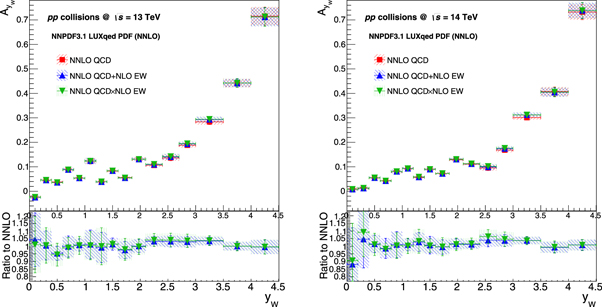
Figure 3. The  distributions by the NNLO QCD and the combined NNLO QCD and NLO EW predictions in ηl
≤ 4.5 at 13 TeV (left) and 14 TeV(right) energies. Total theoretical uncertainty from scale, PDF, and αs
uncertainties is quoted for the predicted distributions. In the lower insets, the ratios of the combined predictions-to-NNLO QCD prediction ratios are shown.
distributions by the NNLO QCD and the combined NNLO QCD and NLO EW predictions in ηl
≤ 4.5 at 13 TeV (left) and 14 TeV(right) energies. Total theoretical uncertainty from scale, PDF, and αs
uncertainties is quoted for the predicted distributions. In the lower insets, the ratios of the combined predictions-to-NNLO QCD prediction ratios are shown.
Download figure:
Standard image High-resolution image4. Relative NLO EW corrections
The NLO EW effects in the combined (N)NLO QCD+NLO EW and (N)NLO QCD × NLO EW predictions are investigated relative to the (N)NLO QCD predictions at both 13 TeV and 14 TeV. This is targeted to better figure out impact of the included EW corrections for achieving adequate description of the  (
( ) distribution. Relative sizes of the (N)NLO QCD+NLO EW and (N)NLO QCD × NLO EW corrections with regards to either NLO or NNLO QCD corrections, denoted by δ(λ), are defined respectively based on the following expressions
where the quantity λ stands for differential distributions of the d
σ(W+), d
σ(W−), and  (
( ) in terms of the ηl
(yW
). The relative correction factors in the differential cross sections δ(d
σ(W+)/d
ηl
) and δ(d
σ(W−)/d
ηl
) for the entire ηl
region 0–4.5 are displayed in figure 4. The included NLO EW corrections in the combined predictions are negative for both the d
σ(W+) and d
σ(W−) distributions throughout the entire ηl
region. The sizes of the NLO EW corrections are down to −2% in the ηl
range 0–3.0 and noticeably down to −6% in the ηl
range 3.0–4.5. The NLO EW effects are generally similar in size between W+ and W− boson leptonic decay channels, nevertheless they are not predicted exactly the same for the entire ηl
region. The differences emerge in both central and forward ηl
regions and amount up to ∼0.5% (∼1.0%) in the ηl
range 0–3.0 (3.0–4.5). Apparently, the differences of the EW effects between W+ and W− processes are more sizable towards the high-ηl
region which should be taken into account in a reliable higher-order prediction. Next up, the relative correction factor
) in terms of the ηl
(yW
). The relative correction factors in the differential cross sections δ(d
σ(W+)/d
ηl
) and δ(d
σ(W−)/d
ηl
) for the entire ηl
region 0–4.5 are displayed in figure 4. The included NLO EW corrections in the combined predictions are negative for both the d
σ(W+) and d
σ(W−) distributions throughout the entire ηl
region. The sizes of the NLO EW corrections are down to −2% in the ηl
range 0–3.0 and noticeably down to −6% in the ηl
range 3.0–4.5. The NLO EW effects are generally similar in size between W+ and W− boson leptonic decay channels, nevertheless they are not predicted exactly the same for the entire ηl
region. The differences emerge in both central and forward ηl
regions and amount up to ∼0.5% (∼1.0%) in the ηl
range 0–3.0 (3.0–4.5). Apparently, the differences of the EW effects between W+ and W− processes are more sizable towards the high-ηl
region which should be taken into account in a reliable higher-order prediction. Next up, the relative correction factor  for the
  distribution is given in figure 5. The NLO EW corrections appear to be minimized by cancellation in some of the bins in the central ηl
region, whereas they can exhibit sizable impact up to 2%–3% in the ηl
range 0–3.5. They grow larger than ∼4% onwards the very last two ηl
bins between 3.5–4.5. Therefore the NLO EW effects should not be disregarded for a thorough description of the
distribution is given in figure 5. The NLO EW corrections appear to be minimized by cancellation in some of the bins in the central ηl
region, whereas they can exhibit sizable impact up to 2%–3% in the ηl
range 0–3.5. They grow larger than ∼4% onwards the very last two ηl
bins between 3.5–4.5. Therefore the NLO EW effects should not be disregarded for a thorough description of the  distribution as the they can amount to a few percent in the central acceptance region and grow larger in the forward region.
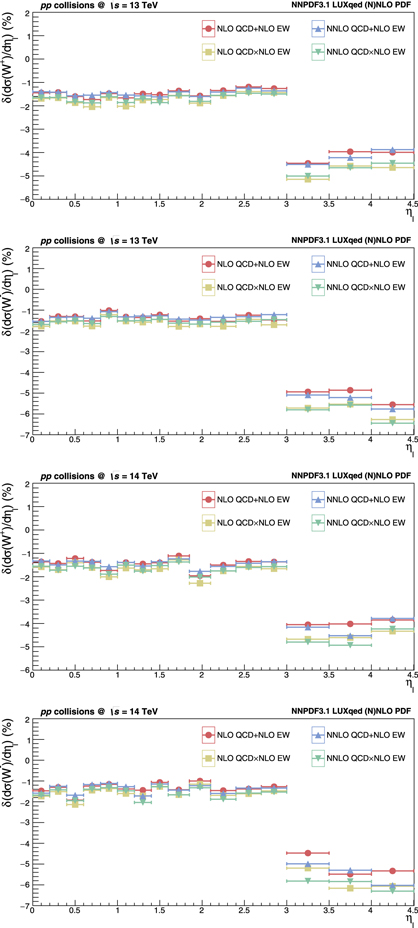
Figure 4. The relative correction factors δ(d σ(W+)/d ηl ) and δ(d σ(W−)/d ηl ) for the combined (N)NLO QCD and NLO EW predictions with respect to the fixed-order (N)NLO QCD predictions. The correction factors are provided in percent (%) for the entire ηl region 0–4.5 at both 13 TeV (top two plots) and 14 TeV (bottom two plots).
Download figure:
Standard image High-resolution image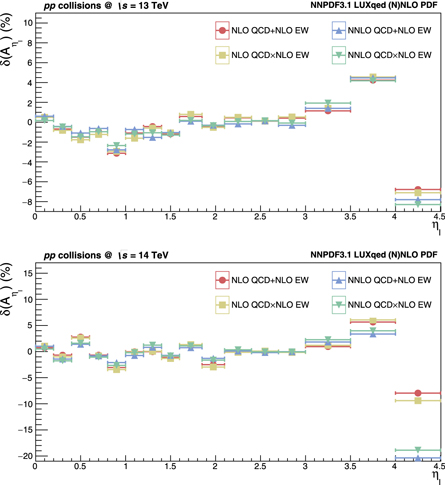
Figure 5. The relative correction factor  for the combined (N)NLO QCD and NLO EW predictions with respect to the fixed-order (N)NLO QCD predictions. The correction factor is provided in percent (%) for the entire ηl
region 0–4.5 at both 13 TeV (top) and 14 TeV (bottom).
for the combined (N)NLO QCD and NLO EW predictions with respect to the fixed-order (N)NLO QCD predictions. The correction factor is provided in percent (%) for the entire ηl
region 0–4.5 at both 13 TeV (top) and 14 TeV (bottom).
Download figure:
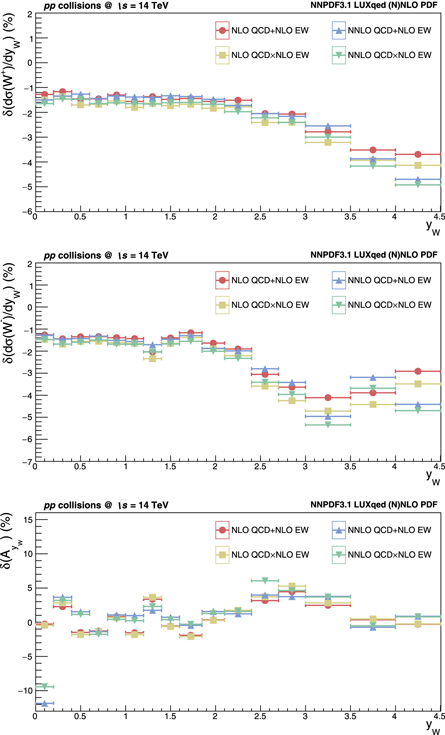
Standard image High-resolution imageAdditionally, the impact of the NLO EW corrections are also investigated for the d
σ(W+), d
σ(W−), and  in terms of the yW
at 14 TeV, as shown in figure 6. The EW effects appear to be negative for the d
σ(W+), d
σ(W−) as a function of the yW
. The NLO EW corrections amount to ∼−1.5% in the most central region and decrease continuously up to ∼−5% towards the forward yW
for the d
σ(W+). Similarly for the d
σ(W−), the NLO EW corrections have a decreasing trend in the yW
range 0–3.5 from ∼−1.5% to ∼−5%, but they can amount to ∼−3% in the very last two yW
bins. The EW effects are sizable for the
in terms of the yW
at 14 TeV, as shown in figure 6. The EW effects appear to be negative for the d
σ(W+), d
σ(W−) as a function of the yW
. The NLO EW corrections amount to ∼−1.5% in the most central region and decrease continuously up to ∼−5% towards the forward yW
for the d
σ(W+). Similarly for the d
σ(W−), the NLO EW corrections have a decreasing trend in the yW
range 0–3.5 from ∼−1.5% to ∼−5%, but they can amount to ∼−3% in the very last two yW
bins. The EW effects are sizable for the  as the correction factor
  can be as large as 4%–5% depending on the yW
range. The EW effects turn out to be minimized by cancellation in the last two yW
bins between 3.5–4.5. By the same token as
can be as large as 4%–5% depending on the yW
range. The EW effects turn out to be minimized by cancellation in the last two yW
bins between 3.5–4.5. By the same token as  , the NLO EW corrections should rather be accounted for a complete and reliable description of the
  . As a final remark on this part, the NLO EW corrections for the
  (
( ) distribution are observed to be comparable between the combined predictions relying on either additive or factorised prescription.
Figure 6. The relative correction factors δ(d
σ(W+)/dyW
) (top), δ(d
σ(W−)/dyW
) (middle), and  (bottom) for the combined (N)NLO QCD and NLO EW predictions with respect to the fixed-order (N)NLO QCD predictions. The correction factors are provided in percent (%) for the entire yW
region 0–4.5 at 14 TeV.
(bottom) for the combined (N)NLO QCD and NLO EW predictions with respect to the fixed-order (N)NLO QCD predictions. The correction factors are provided in percent (%) for the entire yW
region 0–4.5 at 14 TeV.
Download figure:
Standard image High-resolution image
5. K-factor analysis
The sizes of the NLO EW corrections that are included together with the NNLO QCD corrections in the combined predictions of NNLO QCD+NLO EW and NNLO QCD × NLO EW are investigated relative to the LO accuracy for the observables d
σ(W+), d
σ(W−), and  (
( ) in bins of the ηl
(yW
). For this purpose the so-called K-factor analysis is carried out to obtain the relative sizes of the NLO EW corrections with regards to the LO at 13 TeV and 14 TeV energies. The K-factor analysis is also considered for the sizes of the NLO QCD corrections with respect to the LO as well as of the NNLO QCD corrections to NLO QCD to enable comparisons with the relative sizes of the NLO EW corrections over the LO. It is worth to state that the (N)NLO predictions are obtained using the (N)NLO NNPDF31 LUXqed PDF set as before, while the LO predictions are obtained using the NLO NNPDF31 LUXqed PDF set as the corresponding PDF set at LO is not available. The K-factors in this regard are defined suitably as
) in bins of the ηl
(yW
). For this purpose the so-called K-factor analysis is carried out to obtain the relative sizes of the NLO EW corrections with regards to the LO at 13 TeV and 14 TeV energies. The K-factor analysis is also considered for the sizes of the NLO QCD corrections with respect to the LO as well as of the NNLO QCD corrections to NLO QCD to enable comparisons with the relative sizes of the NLO EW corrections over the LO. It is worth to state that the (N)NLO predictions are obtained using the (N)NLO NNPDF31 LUXqed PDF set as before, while the LO predictions are obtained using the NLO NNPDF31 LUXqed PDF set as the corresponding PDF set at LO is not available. The K-factors in this regard are defined suitably as

where λ is again used for the d
σ(W+), d
σ(W−), and  (
( ), which are predicted as a function of the ηl
(yW
). The predicted factors for KNLO EW, K NLO QCD, and KNNLO QCD are provided in bins of the ηl
at 13 (14) TeV in table 1 (table 2). KNLO EW factors differ by up to 1%–2% between the d
σ(W+) and d
σ(W−) at both 13 TeV and 14 TeV. Although they are generally around unity for the
), which are predicted as a function of the ηl
(yW
). The predicted factors for KNLO EW, K NLO QCD, and KNNLO QCD are provided in bins of the ηl
at 13 (14) TeV in table 1 (table 2). KNLO EW factors differ by up to 1%–2% between the d
σ(W+) and d
σ(W−) at both 13 TeV and 14 TeV. Although they are generally around unity for the  within 1%–2% in the ηl
range 0–3.0, the NLO EW corrections have impact equal to or larger than 3% for the ηl
range between 3.0–4.5. The NLO corrections in EW are predicted to impact the
within 1%–2% in the ηl
range 0–3.0, the NLO EW corrections have impact equal to or larger than 3% for the ηl
range between 3.0–4.5. The NLO corrections in EW are predicted to impact the  distribution more in the very forward ηl
region, where they require proper inclusion. As anticipated KNLO QCD factors are quite more sizable than KNLO EW ones for the d
σ(W+) and d
σ(W−) in the entire ηl
region. The NLO corrections in QCD appear to impact the
distribution more in the very forward ηl
region, where they require proper inclusion. As anticipated KNLO QCD factors are quite more sizable than KNLO EW ones for the d
σ(W+) and d
σ(W−) in the entire ηl
region. The NLO corrections in QCD appear to impact the  in the range up to 12%, depending on aparticular ηl
bin. Moreover, KNNLO QCD factors differ by up to ∼5%–6% between the d
σ(W+) and d
σ(W−), which cause considerably large impact on the
in the range up to 12%, depending on aparticular ηl
bin. Moreover, KNNLO QCD factors differ by up to ∼5%–6% between the d
σ(W+) and d
σ(W−), which cause considerably large impact on the  throughout the entire ηl
region. Conclusively, the higher-order predictions are unavoidably required to account for the NLO EW effects for the
throughout the entire ηl
region. Conclusively, the higher-order predictions are unavoidably required to account for the NLO EW effects for the  , more importantly in the very forward ηl
region, even though the impact induced by the NLO EW corrections over LO is less sizable as opposed to the ones by the (N)NLO QCD effects. The performed K-factor analysis also reveals that KNLO EW factors exhibit a stable pattern for the
, more importantly in the very forward ηl
region, even though the impact induced by the NLO EW corrections over LO is less sizable as opposed to the ones by the (N)NLO QCD effects. The performed K-factor analysis also reveals that KNLO EW factors exhibit a stable pattern for the  , i.e., do not vary much for the entire ηl
region as opposed to KNLO QCD and KNNLO QCD factors. Therefore, implementation of the NLO EW effects for the
, i.e., do not vary much for the entire ηl
region as opposed to KNLO QCD and KNNLO QCD factors. Therefore, implementation of the NLO EW effects for the  distribution in Monte Carlo-based or higher-order theoretical predictions could be more straightforwardly handled.
Table 1.
K-factors for the NLO EW corrections relative to LO (KNLO EW), NLO QCD corrections relative to LO (KNLO QCD), and NNLO QCD corrections relative to NLO QCD (KNNLO QCD), predicted using equation (11). K-factors are provided at 13 TeV for the observables d
σ(W+), d
σ(W−), and  in bins of the ηl
.
in bins of the ηl
.
| K-factor | KNLO EW | KNLO QCD | KNNLO QCD | ||||||
|---|---|---|---|---|---|---|---|---|---|
| ηl bin | d σ(W+) | d σ(W−) |

| d σ(W+) | d σ(W−) |

| d σ(W+) | d σ(W−) |

|
| 0.00–0.20 | 0.98 | 0.98 | 1.00 | 1.18 | 1.16 | 1.10 | 1.00 | 0.95 | 1.31 |
| 0.20–0.40 | 0.98 | 0.98 | 1.00 | 1.17 | 1.17 | 1.00 | 0.99 | 0.99 | 0.98 |
| 0.40–0.60 | 0.98 | 0.98 | 0.98 | 1.17 | 1.17 | 0.97 | 1.00 | 0.96 | 1.19 |
| 0.60–0.80 | 0.98 | 0.98 | 0.99 | 1.17 | 1.16 | 1.02 | 1.04 | 1.02 | 1.10 |
| 0.80–1.00 | 0.98 | 0.99 | 0.99 | 1.16 | 1.18 | 0.92 | 0.97 | 1.03 | 0.98 |
| 1.00–1.20 | 0.98 | 0.98 | 0.99 | 1.19 | 1.16 | 1.12 | 1.00 | 0.99 | 1.04 |
| 1.20–1.40 | 0.98 | 0.98 | 0.99 | 1.16 | 1.17 | 0.97 | 0.94 | 1.00 | 0.93 |
| 1.40–1.60 | 0.98 | 0.99 | 0.99 | 1.16 | 1.18 | 0.93 | 1.00 | 0.96 | 1.13 |
| 1.60–1.85 | 0.98 | 0.98 | 1.00 | 1.16 | 1.17 | 0.98 | 0.96 | 0.97 | 0.98 |
| 1.85–2.10 | 0.98 | 0.98 | 1.00 | 1.18 | 1.18 | 1.00 | 0.96 | 0.96 | 1.01 |
| 2.10–2.40 | 0.98 | 0.98 | 1.00 | 1.15 | 1.17 | 0.97 | 0.95 | 1.00 | 0.88 |
| 2.40–2.70 | 0.99 | 0.98 | 1.00 | 1.18 | 1.15 | 1.04 | 1.00 | 1.01 | 0.97 |
| 2.70–3.00 | 0.99 | 0.99 | 1.00 | 1.14 | 1.18 | 0.94 | 0.97 | 1.02 | 0.90 |
| 3.00–3.50 | 0.95 | 0.94 | 1.03 | 1.16 | 1.16 | 0.99 | 0.96 | 0.98 | 0.96 |
| 3.50–4.00 | 0.95 | 0.94 | 1.05 | 1.17 | 1.14 | 1.12 | 0.95 | 0.94 | 1.02 |
| 4.00–4.50 | 0.96 | 0.94 | 0.93 | 1.17 | 1.15 | 0.92 | 0.98 | 0.98 | 0.98 |
Table 2. K-factors at 14 TeV, predicted using equation (11), following the same description as table 1.
| K-factor | KNLO EW | KNLO QCD | KNNLO QCD | ||||||
|---|---|---|---|---|---|---|---|---|---|
| ηl bin | d σ(W+) | d σ(W−) |

| d σ(W+) | d σ(W−) |

| d σ(W+) | d σ(W−) |

|
| 0.00–0.20 | 0.98 | 0.98 | 1.01 | 1.17 | 1.17 | 1.04 | 1.00 | 0.93 | 1.34 |
| 0.20–0.40 | 0.98 | 0.99 | 0.98 | 1.17 | 1.17 | 0.99 | 0.98 | 0.97 | 1.10 |
| 0.40–0.60 | 0.98 | 0.98 | 1.03 | 1.16 | 1.17 | 0.95 | 1.01 | 0.98 | 1.16 |
| 0.60–0.80 | 0.98 | 0.99 | 0.99 | 1.17 | 1.17 | 1.02 | 1.03 | 1.02 | 1.04 |
| 0.80–1.00 | 0.98 | 0.99 | 0.98 | 1.16 | 1.16 | 1.02 | 1.03 | 1.02 | 1.08 |
| 1.00–1.20 | 0.98 | 0.99 | 1.00 | 1.17 | 1.17 | 0.99 | 0.93 | 0.99 | 0.91 |
| 1.20–1.40 | 0.98 | 0.98 | 1.01 | 1.18 | 1.18 | 0.99 | 0.97 | 1.00 | 0.88 |
| 1.40–1.60 | 0.98 | 0.99 | 0.99 | 1.18 | 1.18 | 1.00 | 0.95 | 0.95 | 1.10 |
| 1.60–1.85 | 0.99 | 0.98 | 1.01 | 1.16 | 1.16 | 0.98 | 0.96 | 1.00 | 0.87 |
| 1.85–2.10 | 0.98 | 0.99 | 0.98 | 1.17 | 1.17 | 1.01 | 0.97 | 0.93 | 1.12 |
| 2.10–2.40 | 0.98 | 0.98 | 1.00 | 1.17 | 1.17 | 1.00 | 0.96 | 1.00 | 0.90 |
| 2.40–2.70 | 0.98 | 0.98 | 1.00 | 1.15 | 1.16 | 0.98 | 0.98 | 1.01 | 0.92 |
| 2.70–3.00 | 0.98 | 0.98 | 1.00 | 1.16 | 1.17 | 0.97 | 1.00 | 0.97 | 1.05 |
| 3.00–3.50 | 0.95 | 0.94 | 1.03 | 1.16 | 1.17 | 0.98 | 1.00 | 1.00 | 1.00 |
| 3.50–4.00 | 0.95 | 0.94 | 1.07 | 1.15 | 1.14 | 1.07 | 0.94 | 0.97 | 0.90 |
| 4.00–4.50 | 0.96 | 0.94 | 0.90 | 1.16 | 1.13 | 0.86 | 0.97 | 0.93 | 0.84 |
In addition to the K-factors as a function of the ηl
, KNLO EW, KNLO QCD, and KNNLO QCD are investigated for the d
σ(W+), d
σ(W−), and  as a function of the yW
at 13 (14) TeV in table 3 (table 4). The analysis of K-factors in bins of the yW
is used for enabling comparisons with the presented K-factors in bins of the ηl
, which are more relevant for actual experimental measurements. The KNLO EW factors for the d
σ(W+) and d
σ(W−) in bins of the yW
differ only by up to 1%–2% at both 13 TeV and 14 TeV, as also observed for the ones in bins of the ηl
. The impact of the NLO EW effects over the LO on the
as a function of the yW
at 13 (14) TeV in table 3 (table 4). The analysis of K-factors in bins of the yW
is used for enabling comparisons with the presented K-factors in bins of the ηl
, which are more relevant for actual experimental measurements. The KNLO EW factors for the d
σ(W+) and d
σ(W−) in bins of the yW
differ only by up to 1%–2% at both 13 TeV and 14 TeV, as also observed for the ones in bins of the ηl
. The impact of the NLO EW effects over the LO on the  is as large as 3%–4% for the entire yW
region. More significantly, the
is as large as 3%–4% for the entire yW
region. More significantly, the  is observed to be less sensitive to the NLO EW effects than the
  in the very forward yW
region 3.0–4.5, in particular KNLO EW factors turn out to be unity in the last two yW
bins. The impact of the inclusion of the (N)NLO corrections in QCD in bins of the yW
follow a similar pattern for the d
σ(W+), d
σ(W−), and
in the very forward yW
region 3.0–4.5, in particular KNLO EW factors turn out to be unity in the last two yW
bins. The impact of the inclusion of the (N)NLO corrections in QCD in bins of the yW
follow a similar pattern for the d
σ(W+), d
σ(W−), and  with the ones in bins of the ηl
apart from a few exceptions. Such as, the KNNLO QCD factors vary in a wider range for the
with the ones in bins of the ηl
apart from a few exceptions. Such as, the KNNLO QCD factors vary in a wider range for the  than the
  . Moreover, KNLO QCD and KNNLO QCD factors do not reveal large sensitivity to (N)NLO QCD effects for the
  in the forward yW
region 3.0–4.5 in addition to KNLO EW factors, which is in contrast with the observation of the corresponding K-factors as discussed for the
in the forward yW
region 3.0–4.5 in addition to KNLO EW factors, which is in contrast with the observation of the corresponding K-factors as discussed for the  in the forward ηl
region.
in the forward ηl
region.
Table 3.
K-factors for the NLO EW corrections relative to LO (KNLO EW), NLO QCD corrections relative to LO (KNLO QCD), and NNLO QCD corrections relative to NLO QCD (KNNLO QCD), predicted using equation (11). K-factors are provided at 13 TeV for the observables d
σ(W+), d
σ(W−), and  in bins of the yW
.
in bins of the yW
.
| K-factor | KNLO EW | KNLO QCD | KNNLO QCD | ||||||
|---|---|---|---|---|---|---|---|---|---|
| yW bin | d σ(W+) | d σ(W−) |

| d σ(W+) | d σ(W−) |

| d σ(W+) | d σ(W−) |

|
| 0.00–0.20 | 0.98 | 0.98 | 0.99 | 1.17 | 1.16 | 1.17 | 0.93 | 1.06 | 1.21 |
| 0.20–0.40 | 0.98 | 0.98 | 1.01 | 1.16 | 1.16 | 1.01 | 0.97 | 0.97 | 1.00 |
| 0.40–0.60 | 0.98 | 0.99 | 0.97 | 1.18 | 1.17 | 1.07 | 0.99 | 0.99 | 1.00 |
| 0.60–0.80 | 0.98 | 0.98 | 0.98 | 1.17 | 1.16 | 1.14 | 1.04 | 0.96 | 1.79 |
| 0.80–1.00 | 0.98 | 0.98 | 1.01 | 1.17 | 1.16 | 1.08 | 0.96 | 0.94 | 1.19 |
| 1.00–1.20 | 0.98 | 0.98 | 1.01 | 1.17 | 1.15 | 1.18 | 1.04 | 0.95 | 2.01 |
| 1.20–1.40 | 0.98 | 0.98 | 1.00 | 1.18 | 1.18 | 0.99 | 0.99 | 1.03 | 0.84 |
| 1.40–1.60 | 0.98 | 0.98 | 1.02 | 1.17 | 1.16 | 1.09 | 1.01 | 1.00 | 1.08 |
| 1.60–1.85 | 0.98 | 0.99 | 0.99 | 1.17 | 1.18 | 0.92 | 0.98 | 1.03 | 0.87 |
| 1.85–2.10 | 0.98 | 0.98 | 1.00 | 1.18 | 1.16 | 1.05 | 0.97 | 0.93 | 1.18 |
| 2.10–2.40 | 0.98 | 0.97 | 1.03 | 1.17 | 1.17 | 1.01 | 0.95 | 0.99 | 0.84 |
| 2.40–2.70 | 0.98 | 0.97 | 1.03 | 1.17 | 1.16 | 1.01 | 0.93 | 0.98 | 0.83 |
| 2.70–3.00 | 0.97 | 0.96 | 1.03 | 1.18 | 1.18 | 1.01 | 0.97 | 0.99 | 0.93 |
| 3.00–3.50 | 0.97 | 0.95 | 1.04 | 1.15 | 1.16 | 0.98 | 0.99 | 0.96 | 1.05 |
| 3.50–4.00 | 0.96 | 0.96 | 1.00 | 1.14 | 1.16 | 0.99 | 0.97 | 0.97 | 1.00 |
| 4.00–4.50 | 0.96 | 0.97 | 1.00 | 1.13 | 1.17 | 0.99 | 0.91 | 0.96 | 0.98 |
Table 4. K-factors at 14 TeV, predicted using equation (11), following the same description as table 3.
| K-factor | KNLO EW | KNLO QCD | KNNLO QCD | ||||||
|---|---|---|---|---|---|---|---|---|---|
| yW bin | d σ(W+) | d σ(W−) |

| d σ(W+) | d σ(W−) |

| d σ(W+) | d σ(W−) |

|
| 0.00–0.20 | 0.98 | 0.99 | 0.97 | 1.17 | 1.16 | 1.08 | 0.94 | 0.99 | 0.77 |
| 0.20–0.40 | 0.99 | 0.98 | 1.03 | 1.17 | 1.17 | 1.01 | 0.93 | 0.98 | 0.79 |
| 0.40–0.60 | 0.99 | 0.98 | 1.02 | 1.17 | 1.16 | 1.18 | 1.00 | 0.97 | 1.39 |
| 0.60–0.80 | 0.98 | 0.99 | 0.98 | 1.16 | 1.15 | 1.07 | 0.99 | 0.98 | 1.07 |
| 0.80–1.00 | 0.98 | 0.98 | 1.01 | 1.17 | 1.17 | 1.09 | 1.03 | 0.96 | 1.80 |
| 1.00–1.20 | 0.98 | 0.98 | 1.00 | 1.17 | 1.16 | 1.02 | 1.03 | 0.93 | 2.05 |
| 1.20–1.40 | 0.98 | 0.98 | 1.03 | 1.19 | 1.16 | 1.16 | 1.00 | 1.02 | 0.85 |
| 1.40–1.60 | 0.98 | 0.98 | 1.01 | 1.17 | 1.17 | 1.02 | 1.03 | 0.98 | 1.37 |
| 1.60–1.85 | 0.98 | 0.98 | 1.00 | 1.17 | 1.18 | 0.97 | 1.00 | 1.02 | 0.90 |
| 1.85–2.10 | 0.98 | 0.98 | 1.02 | 1.17 | 1.16 | 1.03 | 0.97 | 0.92 | 1.27 |
| 2.10–2.40 | 0.98 | 0.98 | 1.01 | 1.18 | 1.17 | 1.05 | 0.98 | 1.00 | 0.88 |
| 2.40–2.70 | 0.98 | 0.97 | 1.04 | 1.17 | 1.18 | 0.98 | 0.93 | 1.04 | 0.73 |
| 2.70–3.00 | 0.98 | 0.96 | 1.04 | 1.16 | 1.17 | 0.98 | 0.96 | 0.99 | 0.91 |
| 3.00–3.50 | 0.97 | 0.95 | 1.04 | 1.16 | 1.15 | 1.01 | 1.01 | 0.93 | 1.14 |
| 3.50–4.00 | 0.96 | 0.96 | 1.00 | 1.13 | 1.15 | 0.98 | 0.95 | 1.00 | 0.95 |
| 4.00–4.50 | 0.95 | 0.93 | 1.01 | 1.13 | 1.19 | 0.98 | 0.93 | 0.84 | 1.03 |
6. Conclusions
In the reported work, the charge asymmetry  (
( ) predictions are presented in terms of the ηl
(yW
) for the leptonic final state of the W-boson hadroproduction in pp collisions. The predictions are presented from the computations of both NNLO QCD and NLO EW radiative corrections to achieve adequate theoretical description. The combined predictions NNLO QCD+NLO EW and NNLO QCD × NLO EW, ensuing standard additive and factorised combination prescriptions in turn, for the
) predictions are presented in terms of the ηl
(yW
) for the leptonic final state of the W-boson hadroproduction in pp collisions. The predictions are presented from the computations of both NNLO QCD and NLO EW radiative corrections to achieve adequate theoretical description. The combined predictions NNLO QCD+NLO EW and NNLO QCD × NLO EW, ensuing standard additive and factorised combination prescriptions in turn, for the  (
( ) distributions are of importance in the domain of higher-precision studies which aim to reach the precision at or even less than percent level as required by present and future experimental results. The combined predictions for the
  (
( ) provide significant inputs which can primarily be transferred to the knowledge of precise determination of the relative u- and d-quark density functions in the proton. In addition, the presented combined predictions are substantially necessary for the relevant field of collider phenomenology to have explicit accounting for the NLO EW effects for the observable
  (
( ).
).
The combined NNLO QCD and NLO EW predictions are first compared with the genuine NNLO QCD predictions along with the actual LHC measurements at 8 TeV pp collisions energy. The combined predictions are thoroughly justified with the measurements in both the central ηl
≤ 2.4 and forward 2.0 ≤ ηl
≤ 4.5 acceptance regions apart from a few deviations which generally amount to less than ∼5%. The combined predictions are also compared with the NNLO QCD predictions at both 13 and 14 TeV energies for the entire acceptance ηl
≤ 4.5 to assess the impact of the included EW corrections at NLO. The NLO EW effects are shown to result in sizable impact for the  distribution in the very forward ηl
region ∼3.0–4.5 and for the
distribution in the very forward ηl
region ∼3.0–4.5 and for the  distribution in almost through the entire low- and intermediate-yW
region. The differences between the combined predictions NNLO QCD+NLO EW and NNLO QCD × NLO EW are found to be small, i.e., at the level of a few per mille. Nevertheless, comparisons of the predictions based on additive and factorised approaches are essentially useful to anticipate the impact of mixed QCD-EW effects, which are literally known to be missing in the additive approach. Owing to the small difference from the checks on the comparisons, no systematic uncertainty due to missing mixed QCD-EW effects is included for the NNLO QCD+NLO EW predictions of the charge asymmetry.
distribution in almost through the entire low- and intermediate-yW
region. The differences between the combined predictions NNLO QCD+NLO EW and NNLO QCD × NLO EW are found to be small, i.e., at the level of a few per mille. Nevertheless, comparisons of the predictions based on additive and factorised approaches are essentially useful to anticipate the impact of mixed QCD-EW effects, which are literally known to be missing in the additive approach. Owing to the small difference from the checks on the comparisons, no systematic uncertainty due to missing mixed QCD-EW effects is included for the NNLO QCD+NLO EW predictions of the charge asymmetry.
The impact of the EW corrections at NLO in the combined predictions is extensively studied for the differential cross sections d
σ(W+) and d
σ(W−), in addition to the  (
( ) by means of the relative NLO EW correction factors with regards to the NNLO predictions in QCD. The relative correction factors are shown to be −2% (−6%) in the ηl
range 0–3.0 (3.0–4.5) for the d
σ(W+) and d
σ(W−), where their differences are observed to be up to ∼1.0% in the high-ηl
region 3.0–4.5 between W+- and W−-boson processes. The NLO EW effects exhibit sizable impact on the
) by means of the relative NLO EW correction factors with regards to the NNLO predictions in QCD. The relative correction factors are shown to be −2% (−6%) in the ηl
range 0–3.0 (3.0–4.5) for the d
σ(W+) and d
σ(W−), where their differences are observed to be up to ∼1.0% in the high-ηl
region 3.0–4.5 between W+- and W−-boson processes. The NLO EW effects exhibit sizable impact on the  distribution as the relative correction factors turn out to be up to 2%–3% in the ηl
range 0–3.5 and more than ∼4% in the highest two ηl
bins 3.5–4.5. The relative correction factors are also investigated for the d
σ(W+), d
σ(W−), and
distribution as the relative correction factors turn out to be up to 2%–3% in the ηl
range 0–3.5 and more than ∼4% in the highest two ηl
bins 3.5–4.5. The relative correction factors are also investigated for the d
σ(W+), d
σ(W−), and  as a function of the yW
. They are explicitly shown to be ∼-1.5% in the most central yW
acceptance, while decreasing up to ∼−5% in the forward yW
acceptance for the d
σ(W+) and d
σ(W−). The impact of the NLO EW effects on the
as a function of the yW
. They are explicitly shown to be ∼-1.5% in the most central yW
acceptance, while decreasing up to ∼−5% in the forward yW
acceptance for the d
σ(W+) and d
σ(W−). The impact of the NLO EW effects on the  is found to amount up to 4%–5% depending on the yW
range. These observations are in support of requirement of proper accounting for the NLO corrections in EW in theoretical predictions to achieve a complete and reliable description of the
is found to amount up to 4%–5% depending on the yW
range. These observations are in support of requirement of proper accounting for the NLO corrections in EW in theoretical predictions to achieve a complete and reliable description of the  (
( ) distribution. In addition, a comprehensive K-factor analysis is performed to further assess the relative sizes of the NLO corrections in EW with regards to the LO accuracy in comparisons with those of the (N)NLO QCD corrections. The NLO EW K-factors for the
  are predicted to vary in the range 1%–2% in the ηl
region 0–3.0, whereas they are 3% or even more in the ηl
region 3.0–4.5. The K-factor analysis conclusively revealed that the forward ηl
region 3.0–4.5 is more prone to the requirement of the inclusion of the NLO corrections in EW in
are predicted to vary in the range 1%–2% in the ηl
region 0–3.0, whereas they are 3% or even more in the ηl
region 3.0–4.5. The K-factor analysis conclusively revealed that the forward ηl
region 3.0–4.5 is more prone to the requirement of the inclusion of the NLO corrections in EW in  predictions. The NLO EW K-factors over the LO for the
  are investigated to be as large as 3%–4% in some of the yW
ranges. More significantly,
are investigated to be as large as 3%–4% in some of the yW
ranges. More significantly,  is shown to be less sensitive to the NLO EW effects in the very forward region 3.0–4.5 contrary to the
  , by the K-factor analysis over the LO. The presented NLO EW K-factors can be considered in the related phenomenological studies of the
  (
( ) for properly correcting for the NLO EW effects.
Data availability statement
The data generated and/or analysed during the current study are not publicly available for legal/ethical reasons but are available from the corresponding author on reasonable request.
Conflict of interest
The author declares no conflict of interest.