
Abstract
Objective. Voluntary control of sensorimotor rhythms (SMRs, 8–12 Hz) can be used for brain–computer interface (BCI)-based operation of an assistive hand exoskeleton, e.g. in finger paralysis after stroke. To gain SMR control, stroke survivors are usually instructed to engage in motor imagery (MI) or to attempt moving the paralyzed fingers resulting in task- or event-related desynchronization (ERD) of SMR (SMR-ERD). However, as these tasks are cognitively demanding, especially for stroke survivors suffering from cognitive impairments, BCI control performance can deteriorate considerably over time. Therefore, it would be important to identify biomarkers that predict decline in BCI control performance within an ongoing session in order to optimize the man–machine interaction scheme. Approach. Here we determine the link between BCI control performance over time and heart rate variability (HRV). Specifically, we investigated whether HRV can be used as a biomarker to predict decline of SMR-ERD control across 17 healthy participants using Granger causality. SMR-ERD was visually displayed on a screen. Participants were instructed to engage in MI-based SMR-ERD control over two consecutive runs of 8.5 min each. During the 2nd run, task difficulty was gradually increased. Main results. While control performance (p = .18) and HRV (p = .16) remained unchanged across participants during the 1st run, during the 2nd run, both measures declined over time at high correlation (performance: −0.61%/10 s, p = 0; HRV: −0.007 ms/10 s, p < .001). We found that HRV exhibited predictive characteristics with regard to within-session BCI control performance on an individual participant level (p < .001). Significance. These results suggest that HRV can predict decline in BCI performance paving the way for adaptive BCI control paradigms, e.g. to individualize and optimize assistive BCI systems in stroke.
Export citation and abstract BibTeX RIS

Original content from this work may be used under the terms of the Creative Commons Attribution 4.0 license. Any further distribution of this work must maintain attribution to the author(s) and the title of the work, journal citation and DOI.
1. Introduction
Besides serving as a powerful tool to improve understanding of brain oscillatory activity (Schultze-Kraft et al 2016), brain–computer interface (BCI) systems play an increasing role in the medical field, e.g. to operate a hand exoskeleton to restore lost hand function in finger paralysis after stroke or spinal cord injury (Ang et al 2011, Soekadar et al 2016). The best established method for such clinical application utilizes voluntary control of sensorimotor-rhythms (SMRs, 8–12 Hz) recorded by electroencephalography (EEG) (Birbaumer and Cohen 2007). To gain control, stroke survivors are usually instructed to engage in motor imagery (MI) or to attempt moving the paralyzed fingers resulting in task- or event-related desynchronization (ERD) of SMR (SMR-ERD). Besides assistance, there is increasing evidence that repeated BCI use can trigger neural recovery leading to improved hand motor function (Ramos et al 2013, Ang et al 2015, Frolov et al 2017a, Cervera et al 2018, Bai et al 2020). However, optimal frequency, dose and intensity of BCI training to maximize the rehabilitation effect remains unclear (Soekadar et al 2015, Young et al 2015, Lang et al 2016). Recently, it was proposed that merging both strategies, i.e. introducing assistance to perform bimanual activities of daily living (ADL) in the context of stroke rehabilitation protocols, may substantially increase the impact of BCI technology and broaden its use in the medical field (Soekadar et al 2019, Soekadar 2020, Soekadar and Nann 2020).
However, BCI control tasks, e.g. performing repetitive MI of grasping movements, are cognitively demanding. As a consequence, decline in concentration and attention due to mental fatigue can negatively affect BCI control performance (Curran and Stokes 2003, Myrden and Chau 2015). Especially stroke survivors suffering from cognitive impairments including post-stroke fatigue (Christensen et al 2008, Acciarresi et al 2014) have a limited capacity to maintain reliable BCI control over a longer period of time (Frolov et al 2017b). Current research showed that subjective fatigue and inattention correlated with diminished BCI performance (Foong et al 2019). This does not only reduce applicability of BCIs for assistance but also for triggering motor recovery, e.g. after stroke, because decline in attention was shown to negatively affect cortical plasticity (Stefan et al 2004).
Despite extensive research efforts to identify predictive performance markers across subjects (Blankertz et al 2010, Hammer et al 2012), there is currently no adaptive control paradigm applied in BCI neurorehabilitation in which within-session decline in SMR-based BCI performance becomes predicted on an individual level. Avoiding such performance decline would be critical to sustain high control performance during assistance and to optimize efficacy of rehabilitation protocols. Also, maintaining optimal BCI control performance would be highly relevant for the management of the patient's motivation to engage in regular use (Hammer et al 2012), and to prevent overtraining in terms of dose and intensity (Soekadar et al 2015). However, tracking negative trends in BCI performance over the course of a training session is difficult due to large trial-to-trial variations within each individual user (Grosse-Wentrup and Schölkopf 2012). Moreover, given that the long-term goal is to apply BCI systems in everyday life environments, e.g. during ADLs (Soekadar et al 2016), the required self-paced BCI protocol further impedes detection of a negative performance trend. It would be thus important to identify sensitive biomarkers that predict decline in BCI performance at a point at which optimization of the patient–machine interaction scheme can yield stable control performance.
Recently, neuroadaptive human–computer interaction systems gained interest as they allow for passive cognitive monitoring without interfering with active voluntary control commands (Zander and Kothe 2011, Gerjets et al 2014). For instance, a neuroadaptive control paradigm has been developed to classify and adapt to the cognitive state of pilots during demanding flight simulations to increase their task accuracy (Klaproth et al 2020). Neuroadaptive technology has been widely used to discriminate between and adapt for different levels of workload during cognitive tasks, e.g. during a working memory task (Hogervorst et al 2014). While cortical features are commonly used for classification, e.g. changes in the alpha (8–12 Hz) or theta (4–8 Hz) power band (Klimesch 1999), also peripheral physiological measures as heart rate (HR), heart rate variability (HRV), respiration rate or skin conductance were shown to be suitable for discrimination (Hogervorst et al 2014).
Unlike EEG-based classification approaches that commonly require a high number of electrodes and sophisticated analysis methods (Faller et al 2019), peripheral physiological measures like HR or respiration rate are straightforward to record and less complex in analysis. Already over 150 years ago, Claude Bernard discovered the close interaction between the brain and the heart (Thayer and Lane 2009). Cortical control of cardiac activity is mediated by the joint activity of sympathetic and parasympathetic (vagus) nerves (Levy 1990). Especially the vagus nerve originating from the brain and directly innervating the heart muscle has an important control function in slowing down pulse and HR (countering the sympathetic innervation, which accelerates the pulse) to continuously adapt to physiological processes and account for changes in physical and/or cognitive demands. The strongest vagally-mediated adaptation process constitutes the adjustment of the HR to breathing, also called respiratory sinus arrhythmia (RSA). Since breathing induces unintended changes in blood pressure, HR needs to be constantly adapted for pressure stabilization (Aasman et al 1987). Besides cortical control of cardiac activity via efferent nerves, i.e. top-down control, there are also afferent nerve fibers for bottom-up control (Cameron 2001). For instance, mechanosensory and chemosensory neurons forward important information from the heart to the brain to obtain a robust control loop. Thus, there is a complex bidirectional brain–heart interaction that allows for constant adaptation to changing physiological demands (Shaffer et al 2014).
To quantify the activity of the parasympathetic system, analysis of HRV is broadly applied. More specifically, there is strong evidence that particularly the high-frequency (HF)-HRV component in the range of 0.15–0.4 Hz reflects the modulation of vagus nerve activity (Malik and Camm 1993, Berntson et al 1997). In addition to physiological adaptation processes, numerous studies have shown that vagal activity is also sensitive to cognitive processes and attenuates during cognitively demanding tasks, e.g. during driving (Stuiver et al 2014) and aviation simulation (Rowe et al 1998, Muth et al 2012), visual attention test (Duschek et al 2009) or a sustained perceptual attention task (Overbeek et al 2014). Suppression of vagal activity induced by high cognitive demand results in lower adaptation to variations in blood pressure and thus reduced HRV (Hogervorst et al 2014).
However, despite extensive research in the field of psychophysiology, it is unknown to what extend voluntary control of SMR in the context of BCI control impacts vagal activity. Moreover, it is unknown whether HF-HRV can be used as a biomarker to predict decline in BCI control performance. Hence, understanding this relationship is an important prerequisite for the development of HRV-based neuroadaptive BCI systems to optimize control performance and stroke neurorehabilitation protocols.
A driving simulator study showed that measures of the autonomous system like HR can reflect cognitive demand linked to driving performance (Mehler et al 2009). It was also shown that HF-HRV can reflect cognitive demand (Muth et al 2012) suggesting that HF-HRV might predict BDI performance.
Although there are studies indicating that resting-state HF-HRV recorded before the actual task can contain predictive information, e.g. for P300 BCI performance (Kaufmann et al 2012) or for cooperative behavior in a hawk–dove game (Beffara et al 2016), such approach does not provide time-resolved information on within-session BCI performance. Given that detection of such trends are rather difficult to detect due to large trial-to-trial variations over the course of a BCI control session within each individual user (Grosse-Wentrup and Schölkopf 2012), the 1st objective (O1) was to evaluate specificity of HRV decline for BCI control performance using linear regression analyses based on multilevel models. The 2nd objective (O2) was then to test whether HF-HRV predicts average BCI control performance on a participant level within a single run consisting of 50 BCI control trials. For this, we performed a Granger causality analysis to investigate the predictive characteristics of HRV. Granger causality, introduced by Clive Granger in 1969 (Granger 1969), is a statistical hypothesis test and has been widely applied in economic science as a forecasting method, e.g. of two stock market time series. In short, a variable X (here HRV) Granger-causes a 2nd variable Y (here BCI control performance), when prediction of Y is better including information of X than without (Wiener 1956). This is done by a series of F-tests on lagged values. It is important to note that the Granger causality analysis does not necessarily provide evidence for a causal relationship in a more general sense between X and Y, but rather shows a statistical relationship indicating that past information of X improves prediction of Y (Maziarz 2015). Recently, Granger causality has gained broad interest and various applications in the field of neuroscience (Seth et al 2015).
2. Methods
2.1. Participants
Twenty-four able-bodied participants (seven females, mean age 33 ± 12 years) were invited to the University Hospital of Tübingen, Germany, for a familiarization and experimental session on two consecutive days. During the familiarization session, all participants gave written informed consent and were pre-screened whether they were able to elicit detectable SMR-ERD and whether they showed a normal heartbeat pattern to allow for HRV analysis. In case of regular medication intake (e.g. beta blocker) or neurological diseases (e.g. neuropathy due to diabetes mellitus), participants were excluded from the study. After successful pre-screening, 17 participants were invited to the experimental session on the following day. The study protocol was in line with the Declaration of Helsinki and was approved by the local ethics committee at the University of Tübingen (registration code of ethical approval: 201/2018BO1).
2.2. Task description and study design
The participants were instructed to engage in MI of left or right grasping movements and received visual feedback based on SMR-ERD modulations presented on a screen in front of them. Participants performed two consecutive runs with 50 trials each resulting in an overall duration of 500 s (8.5 min) per run. A run consisted of a pseudorandomized and externally paced sequence of MI and relax tasks with participants instructed to blank their minds and rest. Both tasks had a length of 5 s and were separated by intertrial intervals (ITIs) with a randomized duration of 4–6 s.
The study followed a within-participant repeated measures one-factor design with task difficulty as independent variable. To increase task difficulty between runs, SMR-ERD detection threshold as well as ratio in number of MI to relax tasks were manipulated. During the 1st run, SMR-ERD detection threshold was kept constant and task ratio was balanced (task difficulty: 'normal'). To increase task difficulty during the 2nd run (task difficulty: 'hard'), SMR-ERD detection threshold was gradually lowered by −20% relative to the individual SMR-ERD detection threshold determined during calibration every 100 s. In contrast, detection threshold for the relax tasks, in which participants should stay above that threshold (i.e. true negative rate), was kept constant. We reasoned that changing this threshold could be perceived as very frustrating, because feedback gradually would indicate that participants cannot reach a relaxed state which would introduce even more stress. Moreover, task ratio was unbalanced with 60% MI to 40% relax tasks (overview of study design see figure 1). The increase in task difficulty during the 2nd run was not communicated to the participants to avoid biasing their motivational state or influence their expectations.
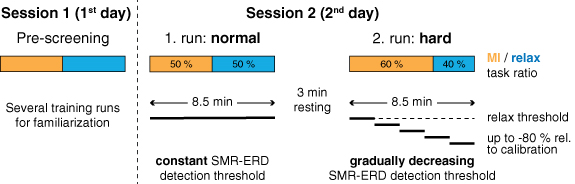
Figure 1. Overview of study design. Participants were invited for a pre-screening session (session 1) followed by an experimental session (session 2) on two consecutive days. During the pre-screening session, participants were familiarized with the setup and the MI neurofeedback task. On the following day, participants performed two 8.5 min (500 s) long runs with different task difficulty, i.e. normal and hard. Task difficulty was increased, 1. by altering the ratio of MI to relax tasks from a balanced to a 60%/40% ratio (of note: MI and relax tasks are pseudorandomized uniformly over the entire run) and 2. by gradually decreasing the SMRs ERD detection threshold every 100 s by −20% up to −80% relative to the individual SMR-ERD detection threshold determined during calibration. Relax threshold was not altered (horizontal dashed line).
Download figure:
Standard image High-resolution image2.3. BCI control
EEG was recorded from 22 conventional recording sites (Fp1, Fp2, AFz, F3, Fz, F4, T7, C3, Cz, C4, T8, CPz, P7, P3, Pz, P4, P8, POz, O1, O2, M1, and M2 according to the international 10/20 system) and referenced to FCz. Ground electrode was placed at Fpz. Dependent on the selected laterality of the imagined grasping movements, either C3 for the right hand or C4 for the left hand together with the respective four nearest electrodes for Laplacian filtering were selected for further signal processing (McFarland 2015). Two additional channels were used to assess the HR for offline HRV analysis (see section 2.4). All biosignals were amplified with a wireless saline-based EEG system (smarting®, mBrainTrain®, Belgrade, Serbia, in combination with a customized GT Gelfree-S3 EEG cap, Wuhan Greentek Pty Ltd, Wuhan, China) and sampled at 500 Hz. All impedances were kept below 10 kΩ. To provide visual online feedback of participant's voluntary SMR control, the BCI2000 software platform was used for real time processing and classification (Schalk et al 2004).
First, EEG signals at C3 or C4 (dependent on the imagined hand) were bandpass-filtered at 1–30 Hz as well as Laplace-filtered to increase signal-to-noise ratio (McFarland 2015, Soekadar et al 2016). Afterwards, instantaneous SMR power amplitude of a 3 Hz wide bin around the frequency of interest (FOI ± 1.5 Hz) was estimated from a 400 ms moving window based on an autoregressive model of order 50 according to the Burg algorithm (Soekadar et al 2011). FOI was individually determined during calibration and was set to the frequency showing the largest SMR power downmodulation during MI. Lastly, SMR-ERD was calculated according to the power method of Pfurtscheller and Aranibar (1979).
BCI online control required individual calibration before the two experimental runs. Therefore, participants performed three short calibration runs in which they followed 20 externally paced visual cues instructing them to either engage in MI or to relax. Based on the 1st run in absence of online feedback, individual average power was estimated to normalize instantaneous power for SMR-ERD computation. This means that the individual average power (also termed reference value, RV) (Soekadar et al 2011) of the 1st run is used as reference time period for the computation of SMR-ERD for the following runs, thus following the design of an asynchronous BCI (Soekadar et al 2016). During the following two calibration runs, an individual SMR-ERD detection threshold was determined to provide meaningful online feedback. Detection threshold was set to the average of elicited SMR-ERD across all MI tasks (Soekadar et al 2016, Nann et al 2020). The resulting calibration parameters, i.e. RV and detection threshold, were used as input parameters for the two subsequent task runs and remained unaltered.
2.4. Analysis of HRV
For the analysis of HRV, a one-lead electrocardiography (ECG) was derived with disposable Ag–AgCl electrodes (COVIDIEN plc, Dublin, Ireland) from the outer clavicles according to Mason and Likar (1966). ECG was lowpass-filtered at 130 Hz including removal of 50 Hz line noise. Interbeat intervals (IBIs) were extracted and corrected, in case IBIs exceeded the average IBI value of a window comprising 20 previous and 20 following beats by 30% (von Tscharner and Zandiyeh 2017). Cleaned IBIs were resampled at 4 Hz by using a modified Akima cubic interpolation to obtain equidistant time series (Camm et al 1996, Berntson et al 1997, Singh et al 2004). The resampled IBI time series was bandpass-filtered at 0.15–0.4 Hz resulting in a time series that only contained the HF-HRV component, which was found to reflect modulation in vagal tone (Malik and Camm 1993). To receive the final HRV outcome measure, standard deviation of the filtered IBI time series was computed. Similar to the Porges–Bohrer method (Lewis et al 2012), only variance of the frequency band of spontaneous breathing (HF band: 0.15–0.4 Hz) is evaluated. This has the advantage that other distracting sources of variance like blood pressure modulation (low-frequency band: 0.04–0.15 Hz) and non-stationary aperiodic trends (ultra-low-frequency band: <0.04 Hz) are removed resulting in increased signal-to-noise ratio. According to recent recommendations, no correction for respiration rate was performed since spontaneous breathing was present throughout the entire experiment (Thayer et al 2011, Laborde et al 2017). Since interindividual distribution of HRV measures are usually strongly positively skewed, HRV values are ln-transformed to regain normal distribution for further parametric statistical analysis (Riniolo and Porges 2000).
2.5. Outcome measures
To capture temporal HRV changes within each experimental run (run length equals 500 s), HRV measures were computed based on overlapping 100 s windows iteratively shifted by 10 s. This results in a HRV time series with 41 data points per run. Estimating HRV measures on the basis of such relatively short observation windows (called ultra-short-term HRV measures) recently gained interest as it allows to study HRV changes with a higher temporal resolution compared to standard window lengths (5 min or 24 h) (Shaffer and Ginsberg 2017). There is growing evidence that such ultra-short-term HRV measures, especially the ones that are processed within the time-domain, e.g. the standard deviation of heart fluctuations, correlate with the clinically accepted short-term measures computed over a standard window length of 5 min (Munoz et al 2015, Shaffer and Ginsberg 2017, Castaldo et al 2019).
The outcome measure for BCI performance was defined as the percentage of time the SMR-ERD detection threshold was exceeded during the MI task and not exceeded during the relax task relative to trial length. For offline SMR-ERD computation, the normalized instantaneous power modulation recorded during the online session was used (see section 2.3). To obtain the equal 100 s window length as for HRV data analysis, BCI performance measures were averaged across ten tasks (on average a task and a ITI resulted in 10 s duration). Shifting this window iteratively by 10 s results in a time series of 41 data points per run, equal to the length of the HRV time series.
For multilevel model analyses (see section 2.6) and plotting, both outcome measures were expressed as difference scores where values are subtracted from the 1st computed value of each run (representing difference to 1st 100 s) (Overbeek et al 2014). Looking at HRV reactivity instead of absolute values reveals within-participant short-term changes in each run and reduces undesired inter-individual variations, e.g. as age, gender or disease-related effects on HRV (Quintana and Heathers 2014, Laborde et al 2017).
2.6. Offline analysis
2.6.1. Multilevel model analysis
To investigate whether BCI performance as well as HRV changed over time and task difficulty, two separate multilevel models for each outcome measure were applied (Snijders and Bosker 1999, Raudenbush and Bryk 2002) using the package 'nlme' in R (Pinheiro et al 2013). Multilevel modeling is an extension of the linear regression analysis and constitutes a powerful and flexible method to analyze hierarchical and repeated-measures data (Muth et al 2012). In our study, the dependent variables 'BCI performance' and 'HRV' as outcome measures (level 1) were nested within 'participants' and 'task difficulty' residing at level 2. In addition, the predictor variables 'time' (41 continuous data points) and 'task difficulty' (two categorical levels: normal, hard) resided at level 1. Multilevel modeling can account for the lack of independence of the outcome measures within participants and is thus well suitable for a repeated-measures design. Additionally, unlike a repeated-measures ANOVA, the assumption of sphericity can be neglected. To account for the high autocorrelation of both outcome time series, which was caused by the moving windows, a 1st-order autoregressive covariance structure was modeled (Field et al 2012). Normality of residuals was checked by visual inspection with quantile–quantile plots (Q–Q plots) and scatter plots of fits vs residuals. To test for an overall effect of predictor variables onto the response variable, the model was compared with the baseline model (i.e. no predictors at levels 1 or 2) using a chi-square likelihood ratio test.
2.6.2. Granger-causality analysis
To test whether HRV predicted BCI control performance, Granger causality analysis was applied (Granger 1969). We tested whether the null hypothesis H0 (HRV does not Granger-cause BCI control performance) could be rejected. However, Granger causality analysis can indicate spurious causality when one or both time series are non-stationary (He and Maekawa 2001). Since both outcome measures were assumed to change over time, i.e. they show a trend, non-stationary of time series was presumed. Toda and Yamamoto (1995) introduced a method, which allows to test for Granger causality on non-stationary time series. This method is based on augmented vector autoregression (VAR) modeling and a modified Wald test statistic and was shown to be superior to the original Ganger test (R packages 'vars' and 'aod'). The Toda–Yamamoto implementation to test for Granger causality was applied on time series on single participant level. To combine test statistics of all participants, Fisher's combined probability test (Fisher's method) was applied to perform a meta-analysis of p-values (Fisher 1925) (R package 'metap'). Significance threshold for all statistical tests was assumed at p = .05.
3. Results
3.1. Changes of BCI performance over time
The comparison with the baseline model revealed a significant effect of 'time' and 'task difficulty' on 'BCI performance' (χ2(2) = 401.60, p < .0001). While there was no overall main effect of 'time' on 'BCI performance' (b = −0.087 [95% CI: −0.202, 0.029], t(1324) = −1.47, p = 0.142), there was a significant interaction of 'time' and 'task difficulty' (b = −0.523, [95% CI: −0.686, −0.359], t(1324) = −6.27, p = 0), indicating that 'task difficulty' affects the relationship between 'time' and 'BCI performance'. To investigate the effect over 'time' for each run individually, interaction was resolved by conducting separate multilevel models for normal and hard 'task difficulty'. The models were identical to the main model but excluded the main effect and interaction term of 'task difficulty'. These analyses showed that during the normal run, there was no change in BCI performance over time (b = −0.087 [95% CI: −0.212, 0.039], t(662) = −1.36, p = .176). However, during the hard run, there was a strong decline in BCI performance over time (b = −0.614 [95% CI: −0.723, −0.504], t(662) = −10.97, p = 0). The gradient of the regression line implies an average decline in BCI performance of −0.6% per 10 s, which accumulates to an overall drop of −24% at the end of the hard run (compared to a non-significant decrease of −3.5% in total during the normal run, figure 2).
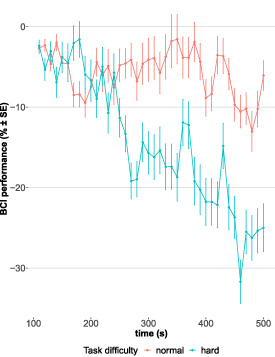
Figure 2. Change in BCI performance over time during runs with normal (red) and hard (blue) task difficulty level. Every run had a length of 500 s. Each point represents an average value (with error bars showing standard error, SE) across participants based on a 100 s window. Time series was generated by moving windows iteratively shifted by 10 s. First value of time series was computed based on the 1st 100 s and utilized as reference value for difference score calculation (i.e. subsequent values are subtracted from the 1st computed value).
Download figure:
Standard image High-resolution image3.2. Changes of HRV over time
Equal to the analysis of BCI performance, there was a significant effect of 'time' and 'task difficulty' on 'HRV' (χ2(2) = 94.71, p < .0001), but no overall main effect of 'time' was found (b = −0.002 [95% CI: −0.006, 0.001], t(1324) = −1.30, p = 0.193). Even though not significant, there was a trend for 'task difficulty' affecting the relationship between 'time' and 'HRV' (b = −0.004 [95% CI: −0.009, 0.001], t(1324) = −1.76, p = .079). Therefore, interaction was again resolved to investigate effects over time for both levels of 'task difficulty'. These analyses revealed that during the normal run, there was no change in HRV (b = −0.002 [95% CI: −0.005, 0.001], t(662) = −1.42, p = 0.157). During the hard run, however, HRV declined over time (b = −0.007 [95% CI: −0.01, −0.003], t(662) = −3.40, p < .001, figure 3). Thus, HRV shows the same behavior over time as BCI performance indicating that decline in HRV is specific to a decline in BCI performance.
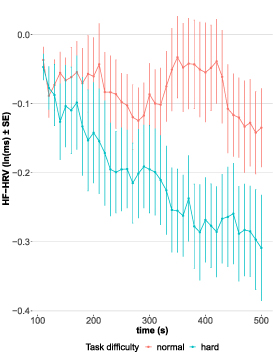
Figure 3. Change in natural logarithm (ln)-transformed HF-HRV over time during runs with normal (red) and hard (blue) task difficulty level. Every run had a length of 500 s. Each point represents an average value (with error bars showing SE) across participants based on a 100 s window. Time series was generated by moving windows iteratively shifted by 10 s. First value of time series was computed based on the 1st 100 s and utilized as reference value for difference score calculation (i.e. subsequent values are subtracted from the 1st computed value).
Download figure:
Standard image High-resolution image3.3. Time series prediction
Test statistic based on the Fisher's method showed that HRV Granger-caused BCI control performance considering all participants including both levels of task difficulty (χ2(68) = 997.9, p < .0001). All p-values except one were highly significant according to the Toda–Yamamoto implementation. Figure 4 shows the time series of HRV and BCI performance of one participant exemplarily. Only results for one participant did not reject the null hypothesis during a run with normal task difficulty (p = .22). In 30 out of 34 runs, the lag was determined at lag = 1 indicating that HRV precedes BCI control performance by 10 s. In only four cases lags were larger with up to 70 s. However, it should be noted that 10 s was the lowest resolvable time interval as duration of one task trial (5 s) in combination with a subsequent ITI (randomized between 4 and 6 s) was on average 10 s long. Therefore, windows were shifted by 10 s each and thus determined the respective time resolution.

Figure 4. Time series of: (a) HF-HRV and (b) BCI performance of one participant. Dashed arrows highlight fiducial turning points, where predictive characteristics of HRV is apparent.
Download figure:
Standard image High-resolution image
4. Discussion
It was shown that SMR-ERD-based brain/neural hand exoskeletons are promising tools to trigger neural recovery after stroke or spinal cord injury. However, BCI control tasks, e.g. MI or attempting to move the paralyzed fingers, are cognitively demanding and can thus lead to inattention and fatigue, especially in stroke survivors suffering from cognitive impairments and post-stroke fatigue. As a consequence, BCI performance deteriorates over time causing frustration and reduced motivation to engage BCI control on a regular basis. Currently, there is no standardized strategy in the BCI field to anticipate decline in SMR-ERD BCI control performance online and to adapt the control paradigm accordingly. Even though numerous studies have shown that changes in HRV are closely linked to cognitive processes (Thayer et al 2009, Overbeek et al 2014, Stuiver et al 2014), it was unknown whether HRV can predict BCI control performance within a single session.
We found that during the 1st run with normal task difficulty, BCI performance over time remained unchanged (p = .176). However, there was a decline by −0.6%/10 s (p = 0) during the 2nd, more difficult run (task difficulty gradually increased, figure 2). Since only healthy and well-performing participants were selected in a pre-screening process (see section 2.1), a decline in performance during the 1st run, e.g. due to fatigue, was not expected. However, the slight trend (−0.09%/10 s) indicates that prolonged use would most likely lead to a significant decrease, too. The strong decline in the 2nd run confirms sufficient gradual decrease of SMR-ERD detection threshold. Of course, such extreme increase in task difficulty does not reflect a normal BCI training situation, but should simulate a state of increasing exhaustion, which stroke survivors often experience during cognitive tasks due to post-stroke fatigue. The reported performance drop of −24% at the end of the hard run is comparable to studies that investigated critical declines in BCI performance. For instance, Vourvopoulos et al (2019) reported a decrease of up to −37% in a virtual reality-based MI-BCI study with chronic stroke survivors and Käthner et al (2014) presented a study, in which manipulation of task difficulty resulted in an average decrease in BCI performance of up to −30% in healthy subjects. Equal to the results of BCI performance, HRV was unaltered during the normal run (p = .157) but attenuated almost linearly within the 2nd run (p < .001, figure 3). These results demonstrate the specificity of HRV changes relative to BCI performance.
Further, causality analysis revealed that HRV Granger-causes BCI performance (p < .001) for both levels of task difficulty. The results suggest that HRV is a specific biomarker to predict decline in BCI performance. Our results show, for the 1st time, that HRV has predictive value to forecast within-session decline in BCI control performance.
In this context, it should be noted that Granger causality does not proof causality in the more general sense (Bunge 2017); i.e. that a decline in HRV directly causes a decline in BCI performance.
Even though this study cannot proof causality, our findings suggest a relationship in line with the Yerkes–Dodson law (Yerkes and Dodson 1908). Our results suggest that increased cognitive demand due to increased task difficulty result in decreased vagal activity preceding decline in BCI performance. Changes in HRV were likely mediated by top-down control of efferent neurons linked to decreased parasympathetic activation relative to a normal baseline (Shaffer et al 2014). Subsequent performance decline might be explained by bottom-up control via afferent neurons. Involving the locus coeruleus (LC), which is known to be linked with the vagus nerve (Mather et al 2017) and the anterior cingulate cortex (ACC) (Aston-Jones and Cohen 2005). Tervo et al (2014) showed that depending on the LC input to ACC, cognitive control strategies might be switched from a strategic mode based on learned models to a stochastic exploitational mode exploring new models. The potential bottom-up mechanism including a switch in behavioral modes might be an explanation why vagal suppression preceded decline in SMR control performance.
Besides these potential mechanisms, it cannot be excluded that change in HRV had also a direct impact on brain dynamics influencing SMR control as it was shown that HRV biofeedback or training can influence EEG power spectra (Reid et al 2013, Dessy et al 2020). After it was shown that mindfulness meditation can increase BCI performance (Tan et al 2014), it seems likely that interoception plays an important role for SMR control, or potentially any form of self-regulation. To untangle the causal relationship between HRV, interoception and SMR control, further studies are necessary that purposefully modulate afferent input, e.g. using vagus nerve stimulation.
Our findings have substantial implications on novel neuroadaptive control paradigms to individualize and optimize stroke neurorehabilitation protocols. HRV as potential control parameter for adaptation has several advantages. In contrast to EEG-based monitoring, e.g. for workload, heartbeat analysis is very simple to record and to analyze. While EEG measures usually require a time-consuming calibration to account for inter-individual variations in topographical and frequency representations of fatigue, heartbeat and for HRV analysis relevant R-peaks detection equals among all humans. To utilize this measure for individual adaptions, a baseline in HRV can easily be determined by expressing the measure as ratio score relative to task onset and define a critical linear threshold, e.g. −5% to task onset. Hence, no time-intensive calibration is necessary. A shortcoming of this study was that ECG was recorded according to the standard lead I representation of Einthoven and is, thus, not optimal for daily home use. However, since heartbeat is one of the strongest biosignals in the human body, it is very easy to record this measure with wearables at well accessible positions, e.g. at the wrist or even at the head, e.g. by using EEG headsets with integrated ECG recording channels (Ahn et al 2019, Rosenberg et al 2016, von Rosenberg et al 2017).
Closed-loop neuroadaptive technology was shown to improve user performance in demanding human–computer interaction tasks. Faller et al (2019) showed that flight duration in a boundary-avoidance task was prolonged when dynamically adjusted EEG-based auditory neurofeedback reduced individual's arousal state. They argued that a reduction in arousal improves performance according to the right side of the Yerkes and Dodson law (Yerkes and Dodson 1908). Importantly, the study showed that HRV increased again when arousal was downregulated by the user based on individual neurofeedback. While in our open-loop study, the opposite effect on the right side of the Yerkes and Dodson law was investigated, i.e. decrease in performance and HRV, Faller's study indicates that HRV is suitable for closed-loop applications as HRV recovered instantaneously when arousal was reduced (Lehrer and Gevirtz 2014, Faller et al 2019).
Further studies are needed to investigate how to use and process predictive HRV information. One possibility is an open-loop system to simply interrupt or stop the BCI training as soon as the user exceeds a predefined critical HRV attenuation threshold. This would avoid frustrating and enhance rewarding experiences, e.g. to increase motivation for further training sessions. Another possibility is a closed-loop system where the BCI control paradigm is dynamically adapted. Several approaches for adaption are conceivable: adjusting classification thresholds, recalibrating the BCI system on the fly, or applying external stimuli. It was shown, for example, that vibro-tactile feedback time-locked to heartbeat has a calming effect and might help to stabilize BCI performance (Azevedo et al 2017). Nevertheless, both methods, open-loop or closed-loop, are promising to individualize BCI stroke training.
It should be noted that only the right side of the Yerkes and Dodson law was investigated. This means the behavior of HRV was only evaluated when BCI performance decreased. This was achieved by the pre-screening procedure ensuring to have a homogenous group of relatively good performers who decline in control performance over time. Contrary to this, it would be very interesting to look at the left side of the inverted u-shape, expecting that low arousal, e.g. boredom or no engagement during the task at all, also reduces performance output. Thus, a slight reduction in HRV, which was often associated with mental effort (Aasman et al 1987), could be interpreted as task motivation and linked with a positive rewarding feedback to the user. Another possible limitation of an HRV-adaptive closed-loop system could relate to be the altered autonomic nervous system after stroke (Dorrance and Fink 2011). It is unclear whether or to what extend our results can be generalized to patient populations. Stroke survivors, e.g. show cardiac abnormalities and have in general reduced HRV (Gujjar et al 2004). To account for such low HRV, high ECG sampling rate is suggested (Berntson et al 1997). Further studies are needed to evaluate the implication of such pathophysiological effects and to validate our results in various patient populations. Moreover, also neuroethical dimensions of such integrated brain/neural interfaces should be considered (Clausen et al 2017), particularly, when advancing such systems towards hybrid minds that increasingly merge biological and artificial cognitive systems (Soekadar et al 2021).
5. Conclusion
The here presented study shows that HRV can predict decline in SMR-based BCI performance. The predictive characteristics of HRV is an important prerequisite for the development of neuro-adaptive BCI control paradigms, e.g. in stroke neurorehabilitation. Optimized BCI training based on individual changes in HRV can account for patient-dependent cognitive capabilities to potentially enhance rehabilitation efficacy. Moreover, it can contribute to sustain high levels of motivation during assistive BCI applications. Implementation and validation of such neuro-adaptive technology in an online BCI control paradigm is on the way.
Acknowledgments
This research was supported by the European Research Council (ERC-2017-STG-759370), the Einstein Foundation Berlin and the BMBF (NEO, 13GW0483C). The authors declare that the research was conducted in the absence of any commercial or financial relationships that could be construed as a potential conflict of interest.
Data availability statement
The data that support the findings of this study are available upon reasonable request from the authors.
Ethical statement
All able-bodied participants gave written informed consent before entering the study. The study protocol was in line with the Declaration of Helsinki and was approved by the local ethics committee at the University of Tübingen (registration code of ethical approval: 201/2018BO1).