

Abstract
Shifting cultivation has traditionally been practiced in the Democratic Republic of Congo by carving agricultural fields out of primary and secondary forest, resulting in the rural complex: a characteristic land cover mosaic of roads, villages, active and fallow fields and secondary forest. Forest clearing has varying impacts depending on where it occurs relative to this area: whether inside it, along its primary forest interface, or in more isolated primary forest areas. The spatial contextualization of forest cover loss is therefore necessary to understand its impacts and plan its management. We characterized forest clearing using spatial models in a Geographical Information System, applying morphological image processing to the Forets d'Afrique Central Evaluee par Teledetection product. This process allowed us to create forest fragmentation maps for 2000, 2005 and 2010, classifying previously homogenous primary forest into separate patch, edge, perforated, fragmented and core forest subtypes. Subsequently we used spatial rules to map the established rural complex separately from isolated forest perforations, tracking the growth of these areas in time. Results confirm that the expansion of the rural complex and forest perforations has high variance throughout the country, with consequent differences in local impacts on forest ecology and habitat fragmentation. Between 2000 and 2010 the rural complex grew by 10.2% (46 182 ha), increasing from 11.9% to 13.1% of the total land area (1.2% change) while perforated forest grew by 74.4% (23 856 ha), from 0.8% to 1.5%. Core forest decreased by 3.8% (54 852 ha), from 38% to 36.6% of the 2010 land area. Of particular concern is the nearly doubling of perforated forest, a land dynamic that represents greater spatial intrusion of forest clearing within core forest areas and a move away from the established rural complex.
Export citation and abstract BibTeX RIS

Content from this work may be used under the terms of the Creative Commons Attribution 3.0 licence. Any further distribution of this work must maintain attribution to the author(s) and the title of the work, journal citation and DOI.
1. Introduction
The Democratic Republic of Congo (DRC) contains roughly half of the Congo Basin's forest: the second largest tropical humid forest in the world (Mayaux et al 2004, DeWasseige et al 2012). Mapping forest cover change in the DRC is essential as the forest provides livelihoods for local populations, biodiversity and both regional and global ecosystem services while experiencing at the same time the highest annual rate of forest cover loss among Central African countries (Justice et al 2001, Duveiller et al 2008, Hansen et al 2008, Maniatis 2008, DeWasseige et al 2012, Potapov et al 2012, Mayaux et al 2013). Despite abundant natural resources, the majority of the population in the DRC lives in poverty, and will grow to account for 16% of the world's poor in 2025 (Kharas and Rogerson 2012). Regional conflict, lack of governance and dilapidated infrastructure have exacerbated poverty and stifled development, protecting natural resources from large-scale exploitation but also hindering sustainable land use planning and aggravating conservation threats such as wildlife poaching (DeWasseige et al 2012, 2014). As a result there has been less commercial resource extraction than Brazil or Indonesia, presenting a unique land use planning opportunity to prevent unplanned and unsustainable exploitation of natural resources while balancing development goals and conservation objectives.
In the DRC the vast majority of forest cover loss is attributed to shifting cultivation (Mayaux et al 2004, Defourny et al 2011, DeWasseige et al 2012, Potapov et al 2012), a traditional agricultural practice of tropical environments in which clearings are carved out of the forest to create new fields. Clearing size is generally small, ranging from 0.25 ha in the Ituri forest (Wilkie and Finn 1990) to 1.4 ha nationally (Potapov et al 2012) and 1 ha average globally (Aweto 2013). Weathered soils in tropical environments typically retain little or no nutrients, leading farmers to clear regenerated fallows and secondary or primary forest areas to prepare fertile land for new crops (Nye and Greenland 1960, 1964, Miracle 1967). This process has created the rural complex: a characteristic mosaic of active and fallow fields and secondary forest regrowth, found along the network of roads and rivers (Lebrun and Gilbert 1954, Vandenput 1981, Mayaux et al 1999) and traditionally with low population densities (Conklin 1961, Ruthenberg et al 1971).
A number of proximate causes other than shifting cultivation and underlying socio-economic drivers create a mosaic of land cover and land uses that can be hard to separate (Rudel and Roper 1996, Mather et al 1998, Geist and Lambin 2002). Proximate causes include the harvest of woody biomass and production of charcoal for energy, agricultural plantations and both artisanal and large-scale logging and mining (Geist and Lambin 2002, DeWasseige et al 2012). Some land uses are difficult to distinguish from shifting cultivation using remote sensing alone, for example the extraction of wood fuel and charcoal production, which are thought to contribute significantly to forest degradation especially in peri-urban areas (DeWasseige et al 2012). Hunting and gathering of non-timber forest products (NTFP) have a small forest clearing footprint, mostly associated with overnight camps, but have a larger impact on the ecological integrity of the forest by increasing human access to the interior forest (Nagendra et al 2004). The observed rural complex and isolated forest perforations inevitably include some of these activities within them.
Socio-economic drivers of change include changing economic opportunities, infrastructure development, changing population dynamics, conflict, and political, religious and cultural traditions (Lambin et al 2001, 2003, Geist and Lambin 2002, DeWasseige et al 2014). Some of these, like the development of road infrastructure, may offer economic development but also increase the viability of unplanned forest exploitation in previously inaccessible intact forest areas (Walker 1987, Wilkie et al 2000, Geist and Lambin 2002). Migration is particularly important (Lambin et al 2003), as seen in the eastern DRC, where decades of conflict have displaced people internally (IDPs) and across borders, increasing population densities and exacerbating forest fragmentation. Conflict has driven people away from established roads and villages and into the interior forest in an attempt to avoid militias, resulting in core forest fragmentation (Nackoney et al 2014). The result is an unplanned and often increasing land use pressure on local environments.
1.1. The cycle of shifting cultivation
The cycle of shifting cultivation varies depending on multiple socio-economic and environmental variables (Miracle 1967, Ickowitz 2006) with consequently variable impacts on the forest ecosystem (Ickowitz 2006, 2011, van Vliet et al 2012). Some of the conditions that determine the farming practices occurring in a given area are land-tenure, tribal and informal economies, access to markets, culture, politics and environmental variables (Conklin 1961, Miracle 1967, Lambin et al 2001, Rudel et al 2005, Ickowitz 2006, Pfaff and Robalino 2012). These factors are essential in characterizing shifting cultivation in a given area, but cannot easily be compared nationally. In this study local qualitative knowledge is traded for wall-to-wall remote sensing observations, which afford us the ability to compare physical observations throughout the country. Coarser spatial resolution satellite data had previously characterized the rural complex as a single category, precluding the study of its constituent land cover (Mayaux et al 2000, Hansen et al 2008). The use of the improved detail of medium spatial resolution data, such as the 30 m data from the jointly operated NASA/USGS Landsat sensors, allows the wall-to-wall characterization of land cover associated with the cycle of shifting cultivation (Bwangoy et al 2010, Ernst et al 2013, Potapov et al 2012) (figure 1).
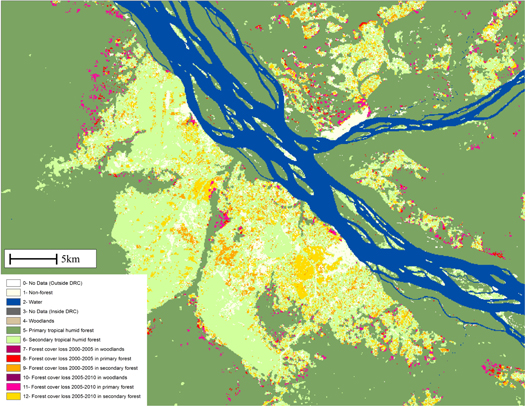
Figure 1. The FACET footprint of the rural complex (reproduced from Potapov et al 2012), visible as a patterned mosaic made of several land cover classes, separate from primary forest.
Download figure:
Standard image High-resolution imageA generalized cycle of shifting cultivation starts when a primary forest stand is cleared to make an agricultural field and larger trees are either left standing, felled and used as timber or left on the ground to decay (figure 2). The resulting woody residue is left to dry, with some portion collected for fuelwood (Miracle 1967). After a period ranging from weeks to months, the slashed area is burned to clear remaining vegetation and release the nutrients which subsequently fertilize the soil (Miracle 1967). Farmers generally prefer clearing mature secondary forest as the trees in these areas are easier to fell and have less weed seed than younger fallows. Primary forest is usually cleared when secondary forest is not available, or as a way to claim new land rights (Wilkie et al 1998). After burning, fields are prepared and sown. The main crop cultivated is cassava (Manihot esculenta) and other crops include corn, sorghum and upland rice. Fruit tree orchards and cash crops such as peanuts, coffee and palm are also common (Miracle 1967, Russell et al 2011). In sparsely populated areas subsequent fallows are long enough for the natural system to recover and a second clearing of a fallow field results in a similar level of productivity as the first one. Increasing the number of harvests for the same field instead leads to dwindling crop productivity and soil fertility (Nye and Greenland 1964). Increased demand for food production therefore leads to either higher reuse rates of fallows and secondary forest, increased expansion into primary forest, or more rarely in agricultural intensification (Angelsen and Kaimowitz 2001).

Figure 2. A model of the spatio-temporal cycle of shifting cultivation in the DRC.
Download figure:
Standard image High-resolution image1.2. The effects of shifting cultivation on the forest
Definitions are the same as the Forets d'Afrique Central Evaluee par Teledetection (FACET) product, where forest is defined as land with ≥ 30% canopy cover for trees ≥ 5 m tall, woodlands have between 30% and 60% tree cover and primary and secondary forest have more than 60% canopy cover (Potapov et al 2012). Primary forest displays characteristics of older, mature forest and secondary forest of younger, regrowing forest. Forest cover loss is defined as stand replacement as a result of disturbance, including shifting cultivation, as well as other anthropogenic and natural disturbances (Potapov et al 2012). However, there is ambiguity over the relationship between shifting cultivation and 'deforestation'. Deforestation is defined by the United Nations Framework Convention on Climate Change (UNFCCC) as the direct human-induced conversion of forest to non-forest, which does not include short-term modifications, whereas the UN Food and Agriculture Organization (FAO) defines it as either the conversion of forest to another land use, or the 'long-term reduction of tree canopy cover', explicitly including shifting cultivation (FAO et al 2007). Stand replacement disturbance is usually understood as a land cover modification: a short-term change in the structure of the existent forest land cover (Lambin et al 2001), while 'agricultural expansion' is seen as a long term or permanent land use conversion (Lambin et al 2003). However we show that expanding rural complex areas can persist in time and have a large spatial impact in eroding and fragmenting forest, keeping a given area not forested in the long-term. By the same token forest perforations should not always be considered isolated phenomena as sometimes they fragment forest and create new rural complex areas, challenging a univocal classification as a short-term disturbance. A crucial element missing in the investigation of forest cover loss in the DRC is the quantification of the spatio-temporal context in which it occurs; whether it occurs sustainably within the established agricultural areas, or if it grows rural complexes or isolated forest perforations through the appropriation of natural, undisturbed, primary forest.
2. Data
We employed input data from FACET for 2000, 2005 and 2010. FACET uses optical satellite remote sensing in a per-pixel time-series approach, leveraging the automated processing of over 8000 Landsat ETM+ images in order to overcome persistent cloud cover (Potapov et al 2012). FACET is a methodological precursor to the Global Forest Cover product (GFC): a global, yearly, 30 m resolution forest cover, loss and regrowth product for 2000–2012 (Hansen et al 2013). GFC is at the core of the World Resource Institute's (WRI) Global Forest Watch initiative (GFW 2.0). Unlike GFC, FACET classifies separately primary and secondary forest, a key characteristic necessary for mapping shifting cultivation areas. FACET's classification of secondary forests has been discussed by Tyukavina et al (2013) and can probably be improved by future research using higher spatial and temporal resolution loss and regrowth observations. Throughout the study we used FACET-observed disturbance as an indicator of shifting cultivation dynamics, since disturbance is the characteristic feature of anthropogenic activity that persists through the fields, fallows and forests. FACET has good detection of primary forest cover loss, but omits some clearing in secondary forests. However, these omissions are co-located with other loss observations, minimizing their impact on our model (Potapov et al 2012, Tyukavina et al 2013). Comparisons of forest cover loss estimates in the DRC are tabulated by (Tyukavina et al 2013) and (Ickowitz et al 2015).
3. Methods
We developed a spatial model to create forest fragmentation maps for 2000, 2005 and 2010. Our approach applied morphological image processing to FACET, contextualizing loss based on its effect on primary forest fragmentation. Subsequently we reclassified this output map into the rural complex footprint map, regrouping individual land cover patches by applying spatial rules that separate the rural complex from isolated forest perforations (table 1). We then intersected GFC yearly forest cover loss with these modeled classes to illustrate the more granular spatial and temporal classification it can afford.
Table 1. Summary of inputs, methods and outputs.
| In | Methods | Out |
|---|---|---|
| 1. Model of FACET into LFT input mask | ||
| 2. Separation of large water bodies | ||
| FACET (2000, 2005, 2010) | 3. Model to create AOI | Forest Fragmentation Map (2000, 2005, 2010) |
| 4. Model primary forest in 4 fragmentation classes | ||
| 5. Tiling and processing. | ||
| Forest Fragmentation Map (2000, 2005, 2010) | 6. Model assigning LFT output classes to either rural complex or isolated perforations. | Rural Complex Map (2000, 2005, 2010) |
| 7. Separation of the two based on spatial rules. |
Geographical Information System (GIS) modeling and morphological image processing allow us to quantify and map landscape spatial pattern, which is useful for three main reasons: because there are strong links between ecological pattern and ecological function (Gustafson 1998), because patterns of change often have characteristic signatures (Forman 1995) and because the spatio-temporal analysis of patterns allows us to make inferences about how they relate to underlying driving processes (Turner et al 1989, Gustafson 1998). We measured in our study landscape composition and spatial configuration of land cover patches. Landscape composition quantifies the number of land cover classes in a landscape and their relative proportions; spatial configuration measures individual patches in their spatial neighborhoods to identify homogenous patches that have relatively abrupt transitions with adjacent areas (Gustafson 1998). The choice of metrics to use depends on many factors, keeping in mind that some are best suited to characterize specific ecological processes within unique landscapes (Li and Reynolds 1995, McGarigal and Marks 1995, Gustafson 1998), many are functionally equivalent (Riitters et al 1995, O'Neill et al 1988) and some developed for specific applications might not be portable to other ecological contexts (Gustafson 1998).
3.1. Scale and area of interest (AOI)
The maps developed provide locally relevant information that is comparable nationally. The 60 m resolution used is the same as FACET. The AOI is the region of largely contiguous primary and secondary humid tropical forest within the DRC. In this area, the rural complex is easily observable because of its separation from primary forest, as the abundant primary forest can be freely exploited in expanding smallholder agriculture. In many areas the primary forest resource is exhausted and most farming is done only within a sparse secondary forest mosaic, particularly in regions typically found along the forest/savanna interface in a belt of high population densities from 3 to 5 degrees latitude south. The study is focused on the spatial dynamics of primary forest appropriation into the rural complex and not of those areas having already exhausted their primary forest resource. As a consequence, we developed spatial rules to treat areas inside the primary forest block AOI differently from areas outside it. We buffered by 10 km all primary forest patches larger than 1000 ha, automatically filling holes, connecting land islands and manually simplifying the area to obtain a contiguous polygon bounding the core humid tropical forest zone.
3.2. Forest fragmentation map
We created a forest fragmentation map using a GIS model and the Landscape Fragmentation Tool (LFT) (Parent et al 2007) based on research by (Vogt et al 2007) (figure 5). For the purposes of this discussion the term forest represents primary forest cover and not secondary forest or woodland cover. The LFT applies a series of raster processing operations in a GIS environment to classify primary forest into separate fragmentation classes (table 3). An edge distance parameter is applied to the input dataset and used to perform separation and inclusion operations between patches of forest and non-forest, resulting in a nuanced forest fragmentation-specific classification. Literature review, visual inspection and expert knowledge led us to choose a 240 m edge distance as it best represented our understanding of the spatial separation between established rural complex areas and isolated forest perforations while being in line with edge distance parameters reviewed (Broadbent et al 2008).
The expansion of the rural complex and isolated forest perforations can degrade the forest through forest fragmentation, resulting in formerly intact forest ecosystems being impacted by edge effects created by clearings. Edge effects are pervasive processes in tropical forests that can lead to changes in forest ecology and habitat fragmentation as well as increasing access to interior forest (Skole and Tucker 1993, Murcia 1995, Gascon et al 2000, Broadbent et al 2008). The width of edges and the specific characteristics of edge effects depend on the ecology of the forest, local environmental variables, the abruptness of the edge and its temporal permanence (Harper et al 2005). Most effects occur close to the forest/non-forest boundary (Murcia 1995) and decrease in frequency and severity with distance (Broadbent et al 2008).
However, edges can also be a consequence of natural features, such as rivers, or the interaction with grasslands and woodlands at the perimeter of the primary forest block. We strived to account only for the active anthropogenic edges occurring inside the primary forest block. Edges at the forest perimeter can be maintained by active or historical anthropogenic disturbance, climatic differences, substrate and fire. Remotely sensed fire observations which have been used to indicate anthropogenic activity linked to agriculture and pasture management have not been used extensively in the DRC (Justice et al 2002, Giglio et al 2003, Morisette et al 2005, Amraoui et al 2010, Molinario et al 2014). We differentiated natural disturbances from anthropogenic ones by modeling their proximity to other forest disturbances, assuming that anthropogenic disturbances did not occur in isolation. The rules in our process therefore allowed for natural non-forest areas to exist within primary forest, e.g. savannah. While these areas are absent of active forest disturbance, they are used for transportation between inhabited areas.
The LFT requires a ternary input mask of forest, non-forest and no-data. This input is developed from FACET classes, where primary forest becomes fragmented, and other classes can either fragment primary forest or have no anthropogenic fragmentation effect on it (figure 3). Previously the absence of wall-to-wall input data with these classes had prevented the automated analysis of forest fragmentation in the DRC.
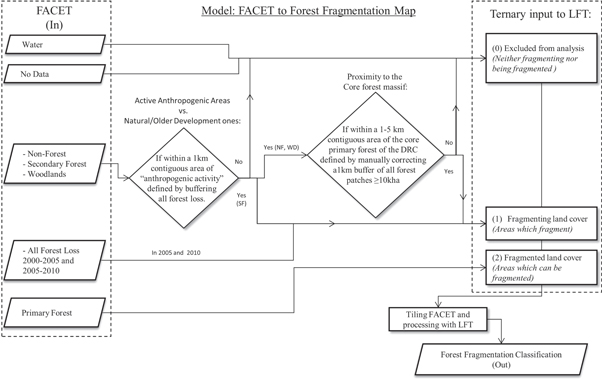
Figure 3. Spatial model from FACET->LFT input.
Download figure:
Standard image High-resolution imageWe pre-processed and tiled the LFT input (figure 3, table 2), processed with the LFT and then mosaicked the output tiles (table 3). Fragmented and core forest classes (4–7) were modeled following two additional spatial rules: retaining patch connectivity if they had a minimum viable corridor width of 480 m (2 × 240 m) and if rivers between patches were < 60 m wide. This allowed for land patches separated by small streams or fragmented river banks to stay connected to each other, whereas large bodies of water were allowed to separate them and fragment forest under the assumption that they could be natural barriers to the dispersal of many terrestrial forest species. We then used spatial rules to add back in individual FACET classes that the LFT output had classified as 'no-data' (table 4): water and no-data were added in as they were, while non-forest, secondary forest and forest loss were separated by the presence of active anthropogenic areas, becoming either class 2 or 3 in the forest fragmentation maps.
Table 2. LFT input classes.
| Class code | Class name | FACET data |
|---|---|---|
| 0 | No-data | Classes which have no fragmentation effect on primary forest (no anthropogenic activity). |
| 1 | Fragmenting land cover | Classes that fragment primary forest: secondary forest, non-forest and woodlands, if within 5 pixels (300 m) of forest loss. Non-forest and woodlands if they are (a) within the AOI, (b) within 5 pixels of the secondary forest that is within 5 pixels of forest loss. |
| 2 | Forest being fragmented | Primary forest, which can be fragmented by clearing |
Table 3. LFT output classification.
| Class code | Class name | Description |
|---|---|---|
| 0 | No-data | Everything that is not primary forest. |
| 1 | Patch forest | Primary forest completely enclosed within the input fragmenting class (mostly within the core rural complex). |
| 2 | Edge forest | Primary forest within 240 m of the edge of large contiguous patches of the fragmenting class (edge of the rural complex). |
| 3 | Perforated forest | Primary forest within 240 m of isolated forest perforations (primary forest surrounding isolated forest perforations). |
| 4 | Small fragmented forest | Primary forest patch < 1000 ha |
| 5 | Medium fragmented forest | 1000 ha > Primary forest patch < 10 000 ha |
| 6 | Large fragmented forest | 10 000 ha > Primary forest patch < 50 000 ha |
| 7 | Core forest | Primary forest patch > 50 000 ha |
Table 4. Forest Fragmentation classification for 2000, 2005 and 2010.
| Class code | Class name |
|---|---|
| 0 | No-data |
| 1 | Water |
| 2 | Natural and older derived NF, SF and WD |
| 3 | Core interior of rural complex and forest perforations |
| 4 | Patch forest |
| 5 | Edge forest |
| 6 | Perforated forest |
| 7 | Small fragmented forest < 1000 ha |
| 8 | Medium fragmented forest > 1000 ha and < 10 000 ha |
| 9 | Large fragmented forest > 10 000 and < 50 000 ha |
| 11 | Core forest > 50 000 ha |
Table 5. Rural complex footprint map classification.
| Class code | Class name |
|---|---|
| 0 | No-data |
| 1 | Water |
| 2, 3, 4 | Rural complex 2000; 2005; 2010 |
| 5, 6, 7 | Perforated forest 2000; 2005, 2010 |
| 8 | Natural and older derived NF, SF and WD |
| 9 | Small fragmented forest < 1000 ha |
| 10 | Medium fragmented forest > 1000 ha and < 10 000 ha |
| 11 | Large fragmented forest > 10 000 and < 50 000 ha |
| 12 | Core forest > 50 000 ha |
The map developed is the first automated forest fragmentation map for the DRC, with a classification granularity that can be useful for local and country level investigations on the impact of disturbance on forest intactness. This is complimentary to the Intact Forest Landscape map (Potapov et al 2008) which identifies areas of intact core forest at larger scales and internationally.
3.3. The Rural complex footprint map
The rural complex footprint maps for 2000, 2005 and 2010 were obtained by reclassifying the forest fragmentation maps (figure 4). The rural complex footprint map group individual patches and classes in order to separate homogenous macro-areas of rural complex from those of more isolated forest perforations (figure 6). The rural complex is a combination of several land cover classes previously identified in our model: some directly from FACET (some NF, SF, WD and loss) and some primary forest classes obtained from the output of the LFT (patch forest, edge forest, and some perforated forest). Using spatial rules of contiguity and minimum area threshold, contiguous areas of perforated primary forest that are proximate to the rural complex are aggregated with the rural complex, whereas smaller, more isolated perforations are kept separate. The assumption is that contiguous areas of forest perforation should not be considered as strictly isolated phenomena, as they previously have. Of the thresholds tested, a 625 pixel (3.75 ha) area was used to separate groups of contiguous perforated forest. Isolated forest perforations areas are obtained by adding those classes that pertain to the actual perforation (some FACET NF, SF, WD and loss) to some of the LFT-identified 'perforated forest' (figure 4). The final classification is presented in table 5.
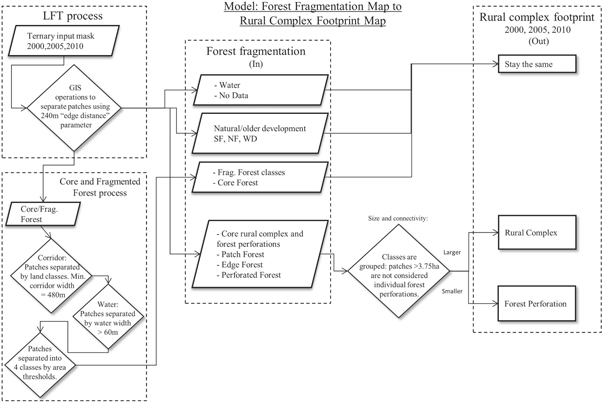
Figure 4. Spatial model from LFT->forest fragmentation map->rural complex footprint map.
Download figure:
Standard image High-resolution image3.4. Yearly forest cover loss
The forest fragmentation and rural complex footprint maps were used to stratify yearly 2000–2012 GFC forest cover loss a posteriori to our analysis (figure 7). GFC observations increase the spatial resolution from 60 m to 30 m, the temporal resolution from 3 to 12 time steps and also include vegetation regrowth observations. Regrowth could prove to be useful in characterizing the secondary succession cycle of fallows and secondary forest. However, GFC does not have a primary and secondary forest separation, which would need to be developed. We plotted GFC loss observations within our modeled classes: GFC 2000–2004 in classes from year 2000, 2005–2009 in those from 2005, and 2010–2011 on those from 2010.
4. Results
Results give us changes in area of edge, perforated, patch, fragmented and core forest and as well as the baseline and growth of the existing rural complex and isolated forest perforations. Mapped typologies of forest cover dynamics are presented and discussed in the next section. The results presented here are disaggregated by second level administrative units, Congo Basin Forest Partnership (CBFP) landscapes and protected areas (PAs). Results are viewable at full resolution at http://congo.iluci.org/shiftingcultivation/.
4.1. Forest fragmentation results
In 2000 core forest accounted for 1,447,816 ha (38%) of DRC land area. In 2010, of that core forest, 54 852 ha (3.8%) became patch, edge, perforated and fragmented forest. Patch forest increased by 12.4%, edge forest by 2% and perforated forest by 53%. Of the 11 s-level administrative units, in 2010 Equateur had the most core forest, followed by Province Orientale, Nord-Kivu and Maniema. Maniema also had the most fragmented forest, followed by Province Orientale and Kasai-Occidental. The largest losses of core forest in the study period were in Nord-Kivu (−3.1%), Equateur (−2.5%) and Sud-Kivu (−2.4%).
In 2000 the six CBFP landscapes accounted for 545 911 ha (36.6%) of core forest. Of that core forest 15 194 ha (2.9%) had been lost by 2010, 0.7% less than the country average. The landscape with the highest percentage of core forest is Salonga–Lukenie–Sankuru (93%) followed by Ituri–Epulu–Aru (87%). Virunga had the highest percentage of core forest loss, while the lowest was in Salonga–Lukenie–Sankuru. Fragmented forest increased in all but one landscape, caused by the loss of viable forest corridors, eroded by expanding edge forest as well as increased forest perforation areas. Virunga and Ituri–Epulu–Aru had the highest rates of growth of perforated forest area, showing a higher-than-average move away from established rural complexes. Patch forest grew in all landscapes and by almost 50% in Ituri–Epulu–Aru, an important dynamic which highlights isolated forest patches that are completely enclosed by the rural complex but not reported separately from primary core forest in products such as FACET. These isolated forest patches can have fundamentally different ecological functions and habitat characteristics than core primary forest.
Of the PAs, 15 have no core or fragmented forest. Of the remaining 21 with core forest, all of them lost some during the study period, 10 of them losing more than 2%. PAs contained 220,675 ha of core forest in 2000 and lost 2,910 ha (1.3%) to fragmented classes by 2010. Perforated forest increased by over 10% in 10 PAs. Patch forest increased in 28 PAs, more than 50% in 6 of these, and doubling in 2 of them.
4.2. Rural complex footprint results
The rural complex grew by 10.2% between 2000 and 2010, a yearly average rate of 1%, from 11.9% to 13.1% of the DRC total land area (a 1.2% change in area). This change added 46 182 ha of rural complex to the country. The area of established agriculture is growing, although with high variability throughout the country. Nord-Kivu and Sud-Kivu had the highest rural complex growth, probably because of the growth in population densities, and seven other provinces had over 10% rural complex growth. Kinshasa, Bandundu and Bas-Congo, as expected, saw much lower rural complex expansion rates due to the nearly exhausted primary forest resources there. In Katanga the isolated forest perforation area grew greatly in proportion to the low baseline rural complex and isolated perforation areas in 2000. Sud-Kivu, Province Orientale, Nord-Kivu, Maniema and Equateur all had perforated forest growth between 83% and 110%.
The rural complex grew in all the CBFP landscapes. Lac Tele-Lac Tumba had the largest 2010 rural complex footprint area (17.8%), followed by Maiko–Tayna–Kahuzi-Biega and Maringa–Lopori–Wamba. The highest relative rural complex footprint growth occurred in Ituri–Epulu–Aru (34.5%). Lac Tele-Lac Tumba had the highest forest perforation area, covering 2.24% of the landscape in 2010 while the highest forest perforation area growth occurred in Ituri–Epulu–Aru.
Among PAs, the highest rural complex expansion occurred in the Bombolumene Hunting Reserve (45.4% of its areas in 2000) followed by Lomako-Yokala Natural Reserve, Kahuzi-Biega National Park and Tumba-Lediima Nature Reserve all in the 22–25% range. If normalized by the amount of standing core and fragmented forest, the rural complex footprint growth seen in parks with a higher ratio of rural complex area to core forest area, such as Virunga National Park, is higher than it would seem otherwise, indicating larger impacts in those areas where rural complex expansion has more likelihood of eroding and fragmenting core and fragmented forest. Perforated forest more than doubled in at least 12 PAs.
4.3. Yearly forest cover loss from GFC 2000–2012
The higher spatial resolution of GFC confirms that most loss occurs within the mosaic of secondary succession in the agricultural rural complex (86.4%), as previously reported (Potapov et al 2012). This clearing occurs by either reusing secondary forest and fallows or clearing patch and edge forest. Of the remaining forest loss 7% occurred within previous isolated forest perforations, either as the disturbance itself or within the perforated primary forest around the disturbance, only 1.6% in fragmented forest and about 5% in core forest.
5. Discussion
Mapping the extent of the rural complex and separating it from isolated forest perforations is not possible using only a per-pixel approach. Identifying these areas requires spatial models that incorporate spatial context and are driven by the current understanding of land use dynamics in the specific area of study. The result is a classification that is useful in characterizing the historical change that has occurred and understanding the disaggregated and contextualized impacts that forest cover loss has on forest fragmentation.
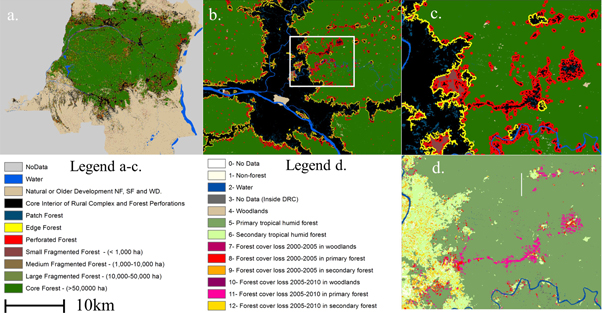
Figure 5. (a) DRC Forest fragmentation map for 2010, (b) forest fragmentation map of the area of Kisangani, (c) detail northeast of Kisangani, (d) FACET map of the same area as (c).
Download figure:
Standard image High-resolution imageResults confirm that most loss occurs in the rural complex; an area which is growing with great variability throughout the country. They also indicate that there is a proportionally faster growth of isolated forest perforations than that of the rural complex. This is concerning as more core forest is fragmented as a result of clearing occurring deeper in the forest. During the last decade there has been a growing number of shifting cultivators moving away from established areas. In the east of the country the rural complex and isolated forest perforation are both growing and moving westward driven by the need for land, food and fuel for growing populations. Growing isolated forest perforations throughout the country are either caused by shifting cultivators driven to go further from their established villages, or clearing to provide food, fuel and materials for local populations involved in commercial or artisanal natural resource extraction.

Figure 6. (a). Growth of forest fragmentation through time: (a) 2000, (b) 2005, (c) 2010, (d) growth is then modeled, reclassified and summarized in the rural complex footprint map for 2000–2005–2010.
Download figure:
Standard image High-resolution imageCore forest in the DRC shrunk by 3.8% and 12.4% of primary forest became patch forest: completely enclosed by anthropogenic activity. This illustrates how the actual impact of clearing on forest ecology and habitat is higher and with greater variability than previously understood. The context of where the clearing occurs is as important as the per-pixel detection itself in correctly quantifying the impact that clearing has, as relatively small areas of clearing can have large impacts on the environment by eroding wildlife corridors or isolating forest patches. At the landscape level, those with the highest ratios of existing rural complex or forest perforations to standing core forest and fragmented forest are not surprisingly the most impacted by change. Virunga, Ituri–Epulu–Aru and Maringa–Lopori–Wamba had the largest losses in core forest and expansion of the rural complex and isolated forest perforation areas. Likewise, parks in peri-urban areas were the most impacted by forest cover loss as they donot have much core forest to begin with and have large existing markets nearby. These areas present a different dynamic than remote areas, feeding and fueling urban areas as well as local populations.
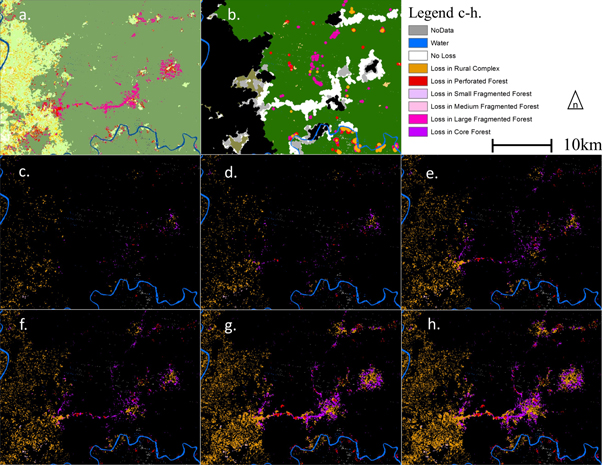
Figure 7. (a) FACET, (b) rural complex footprint 2000, 2005, 2010, (c)–(h) 2 year increments (for illustration only) of GFC loss in the rural complex footprint classes 2000–2012.
Download figure:
Standard image High-resolution imageDifferent typologies of contextualized forest cover loss indicate what is likely to be the impact and temporal persistence that clearing has on the forest (figures 8, 9). Whether or not a clearing is part of a more spatially pervasive phenomenon is a good indicator of how long it will take for those areas to return to a primary-like forest state if the disturbance were to cease.
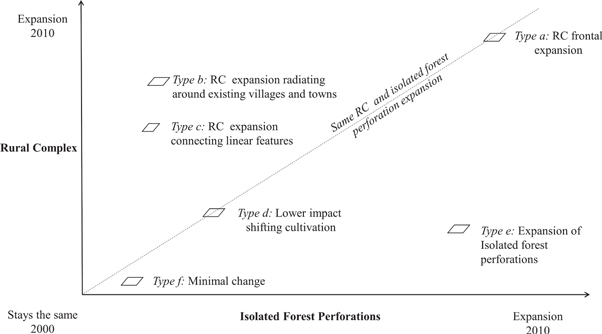
Figure 8. Different types of forest cover loss plotted by their contribution to the growth of the rural complex or isolated forest perforations.
Download figure:
Standard image High-resolution image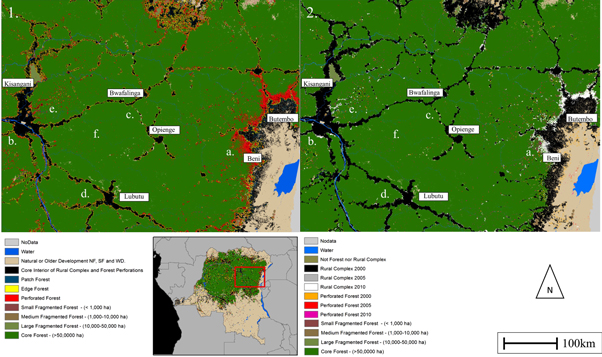
Figure 9. Different typologies of forest cover loss in the central-eastern part of the DRC. (1) Forest fragmentation map for 2010 and (2) Rural complex footprint map for 2000–2005–2010.
Download figure:
Standard image High-resolution image
5.1. Type a: frontal rural complex expansion
Frontal rural complex expansions modify land cover for longer periods of time than if the disturbance occurred only within established or isolated areas. In certain areas, such as west of Beni, the density of forest perforations is such that clearings are part of the expansion and development of new rural complex landscapes and not isolated phenomena. Nord-Kivu and Sud-Kivu have the highest rural complex growth, in part due to the large influx of refugees escaping the Rwandan genocide as well as many IDPs forced from their villages during the Congo war (DeWasseige et al 2012, Nackoney et al 2014). The increase in population density without the intensification of food production, together with the disruption of local livelihoods and collapse of infrastructure and socio-economic structures has led to the increase of shifting cultivation moving westwards towards intact primary forest (Geist and Lambin 2002, Forced Migration Review 2010, Defourny et al 2011, Potapov et al 2012, Hansen et al 2013, DeWasseige et al 2014).
5.2. Type b: rural complex expansion radiating from existing villages and towns
Throughout the DRC, such as in the area south of Kisangani, there are areas of relatively low forest perforation, where most clearing activity is within the rural complex or at its edge. These areas are less pervasive than frontal rural complex growth and distinct from sparser isolated forest perforation.
5.3. Type c: rural complex expansion connecting existing linear features
In many areas existing roads are expanded and connected to improve the transit of goods for livelihood and towards accessible markets (Wilkie et al 2000, Kibambe Lubamba et al 2012). The road between Bwafalinga and Opienge is an example of a transit route expanded during the study period. The expansion of shifting cultivation and villages along roads and rivers increases the access of people into the forest (Angelsen and Kaimowitz 1999, Lambin et al 2003).
5.4. Type d: lower impact shifting cultivation
Many areas have shifting cultivation mostly within the established rural complex or in the primary forest at its interface, such as the western side of Lubutu. In these areas livelihood farming continues traditionally with relatively low environmental impact, not driven to expansion by socio-economic drivers at play in other areas (Mather 1992, Angelsen 1995, Ickowitz 2006, Defourny et al 2011).
5.5. Type e: expansion of isolated forest perforations
These areas donot have large established areas of forest disturbance and represent land frontiers that are opened up to resource extraction, sometimes in association with logging or mining operations. In many cases, observable forest cover loss remains associated with the forest clearing necessary for the shifting cultivation that feeds worker populations involved in the natural resource extraction. Sometimes agricultural clearing follows the development of new transportation and logging roads which are used to access the interior forest and sometimes connect trade routes and villages (Wilkie et al 2000, Russell et al 2011, Kibambe Lubamba et al 2012). These areas can become connected in new rural complex areas.
5.6. Type f: minimal change
Some areas have undisturbed core forest, such as the area between Kisangani and Opienge. Limited anthropogenic pressure allows traditional shifting cultivation to occur with an ecologically healthy period of regeneration of fallows and secondary forest and low rates of loss of primary forest (Defourny et al 2011, DeWasseige et al 2014). Primary forest fragmentation and habitat loss might not be a concern in these areas, however poaching, hunting and collection of NTFP products can still threaten biodiversity locally. In some of these areas we can also see the abandonment of previously inhabited rural complex areas, such as the area north of the road connecting Lubutu and Kisangani.
6. Conclusion
This study focuses on the secondary succession cycle of shifting cultivation in the DRC, filling a gap in the study of forest cover loss in the country. Results illustrate a changing forest disturbance dynamic at the landscape scale within the country. Specifically, more forest loss is occurring as isolated forest perforations that are cleared predominantly by shifting cultivation associated with a number of changing land uses and socio-economic factors such as growing population density and the lack of planning and economic alternatives. Densely occurring forest perforations cannot be considered simply isolated phenomena and should instead be contextualized as part of an expanding rural complex footprint. This type of contextualization is key to understanding the actual impacts of forest cover loss in the DRC. Mapping the contextualized spatial footprint of forest disturbances required additional steps beyond the acquisition of remote sensing observations and resulted in the creation of a modeled product which can aid researchers, land managers and decision makers in linking forest cover loss to its proximate causes, drivers and impacts (Fortin and Drapeau 1995, Mertens and Lambin 1997).
Some areas of shifting cultivation fragment habitats and impact biodiversity and forest ecology much more than other areas and this occurs in specific observable patterns. We have identified six different types occurring at the national scale. Particularly, shifting cultivation in some areas can have a lower impact and a smaller footprint that might be more sustainable, or have a larger impact and footprint when associated with the expansion of the existing rural complex, the creation or connection of transportation routes between villages, the fragmentation of forest through dense perforations, or the growth of pervasive disturbance fronts such as in the eastern DRC. Previously, the extent and implications of forest cover loss from shifting cultivation in the DRC had been debated (Ickowitz 2011, Russell et al 2011), partially because of the lack of quantitative and explicit maps that illustrated the differences in its appropriation of primary forest. Other authors have also highlighted the need for additional research linking subsistence agriculture with land cover change in the country (Justice et al 2001, Zhang et al 2006, Defourny et al 2011).
The accurate mapping of baseline agricultural areas and their rates of expansion is essential to calculate realistic future land-use scenarios that incorporate the agricultural area necessary for the growth of populations. This is necessary for the success of schemes such as the UNFCCC's Reduced Emissions from Deforestation and Degradation (REDD). Future research should focus on the existing and historical connections between population density, migration and conflict and its effects on forest fragmentation. The investigation of the fate of abandoned rural complex areas, some of which are clearly visible in our maps as patterned non-forest areas with no disturbance activity is also important. In some instances these areas might be linked to the displacement of populations during conflict. Future research should also incorporate the use of forest regrowth observations increasing the accuracy of the primary/secondary forest separation. How peri-urban agricultural areas feed and fuel nearby markets is also an important dynamic that needs to be investigated.
War, poverty and collapsed government and infrastructure have crippled the country and created a fundamental deficit of institutional and human capacity for natural resource management. Low rates of deforestation mask the real threats to forests in the DRC, with much higher rates than the national average in heavily populated regions with a strong agricultural sectors and subsistence farming (DeWasseige et al 2012). Landscapes in the DRC remain relatively inaccessible compared to other tropical regions, providing a unique opportunity to avoid future forest deforestation by also employing models to predict future forest loss and degradation, its drivers and impacts (Potapov et al 2008, Bwangoy et al 2010, Defourny et al 2011, Kibambe Lubamba et al 2012). As the country hopefully regains stability in the coming decades, well-informed strategic land use planning will continue to be crucial for sustainable development. A critical part of that will be the contextualization of forest cover loss in terms of its contribution to the expansion of the human footprint and degradation of forest.
Acknowledgments
Support for this study was provided by U.S. Agency for International Development through its Central Africa Regional Program for the Environment (CARPE) and NASA grants: NNX14AR46G and NNX12AI75G. Thanks to the Observatoire Satellital des Forets D'Afrique Central (OSFAC) and African Wildlife Foundation for logistical support and valuable insight during fieldwork. Thanks to Michael Humber, Chris Justice, John Flynn, Jim Tucker, Diane Russell, Alice Altstatt, Janet Nackoney, Patrick Lola Amani and Joe Sexton for their irreplaceable expert knowledge and support.