

Abstract
The Millennium Ecosystem Assessment identified habitat loss due to the extensive growth of agriculture as the primary driver of biodiversity loss. One implication of this is that agricultural intensification has the potential to reduce threats to wild species. In this paper we consider the evidence for differences in the threat to biodiversity posed by the intensive and extensive growth of agriculture in Sub-Saharan Africa. Using data on numbers of endemic species weighted by overall threat status, we analyze the impact of agricultural productivity growth and agricultural land conversion in 27 countries on threats to mammal, bird and plant species over two time scales: one covering the period since agricultural and environmental records began, the other covering the last decade. We find that the extensive growth of agriculture is associated with increasing threats to biodiversity at all time scales. While intensification is associated with a significant reduction in the threat to all species on long time scales, however, we find that it has no significant effect on shorter time scales.
Export citation and abstract BibTeX RIS

Content from this work may be used under the terms of the Creative Commons Attribution 3.0 licence. Any further distribution of this work must maintain attribution to the author(s) and the title of the work, journal citation and DOI.
1. Introduction
What is the relationship between the growth of agriculture and biodiversity change? The Millennium Ecosystem Assessment (MA) concluded that as the extensive growth of agriculture is the primary driver of habitat loss in all human-dominated landscapes, it is also the primary threat to biodiversity worldwide (Millennium Ecosystem Assessment 2005). By the close of the last century, more than two thirds of Mediterranean forests and temperate forest steppes, and more than half of all temperate broadleaf forests, tropical dry forests, grasslands, shrublands and savannas had already been converted to agriculture. While the proportion of tropical habitats converted to agriculture is lower, the rate of land conversion in tropical regions is much greater. This has two effects. On the one hand, it directly leads to the loss of the habitats displaced by crop and pasture lands (Tilman et al 1994, Tilman 1999, Deininger & Minten 2002). On the other, patchy conversion patterns lead to the fragmentation of existing forest, and hence to a reduction in the number and abundance of species that can be supported on unconverted land (Lewis et al 2009, Laurance et al 2011).
If the extensive growth of agriculture is the proximate driver of habitat loss, then the underlying drivers are the causes of that growth. One of the most commonly cited causes of agricultural growth in low-income countries in the last few decades is the increasing demand for foods, fuels and fibres induced by growth in the size of the human population (De Janvry & Garcia 1988, Lopez 1992, Cleaver & Schreiber 1994). While growth in the demand for food in high-income countries has generally stimulated the intensification of agriculture, in low-income countries it has frequently led to extensive growth. More mouths to feed has meant more people farming more land. Specifically, where traditional land tenure and resource access regimes prevail, and where credit markets are poorly developed, increasing demand for food can only be met by land clearance (Pearce & Warford 1993, Bulte & Horan 2003, International Assessment of Agricultural Knowledge Science and Technology for Development 2008). Agricultural expansion at the expense of habitat for wild living species has been an essential human survival strategy (Barrett 2013). Moreover, since poor rural households with low expectations of secure future income have been argued to respond by increasing fertility rates (Dasgupta 1993, Dasgupta 2001), the same process has at least the potential to generate a positive feedback between the demand for agricultural land and population growth.
A majority of the people in the least developed countries still live in rural areas, and still make a living from the exploitation of natural resources—mostly in agricultural systems. On average, 68 per cent of the population in low-income countries live and work in rural areas, relative to 43 per cent in middle-income countries and 21 per cent in high-income countries. In the poorest countries, more than 75 per cent of the population earn a living from agriculture3 . In many of these countries rural population growth rates are still positive and, in some Sub-Saharan African countries (specifically in Benin, Burkina Faso, Burundi, Eritrea, Guinea-Bissau, Mauritania and Uganda) are still increasing (World Bank 2013).
The question, in these countries, is whether intensification reduces the rate of habitat loss from that which might be expected due to population growth alone—whether intensification is 'land sparing'. The evidence at the moment is unclear. One study of the relationship between the change in the energy yield of 23 food crops and the change in per capita cropland area for 124 countries over the period 1979–1999 found that while the per capita area under these food crops decreased in developing countries where large yield increases occurred, the area used to grow other crops increased (Ewers et al 2009). A second study of the relationship between agricultural intensification and the area under cultivation between 1990 and 2005 found intensification to be land sparing only in very limited circumstances (Rudel et al 2009). Focusing on ten major crop types4 , the study found that while cropland did grow more slowly than population during the period, yields and the area under crops were generally positively—not negatively—correlated. Intensification was associated with declining cropland only in countries with significant grain imports and conservation set-aside programs.
To illustrate the ambiguity, we note that both the yield of cereals in Africa, and the area harvested, increased between 1990 and 2012. By the measure due to Rudel et al (2009), intensification in these cases would not be considered land sparing since the ratio between yield growth and the growth in area harvested in that interval is positive. However, if we use forecast values for yield and area harvested, given yield growth data during the 1990s (i.e. ignoring yield growth from 2000) and given the 2012 rural population size, the results are potentially quite different (table 1). The ratio of between the forecast and actual growth in yields and area harvested may be negative. This implies that actual yield growth between 2000 and 2012 has been land sparing relative to the growth that would have occurred had the trajectory of the 1990s been maintained.
Table 1. Land sparing intensification of cereals production in Africa 1990-2012.
| Area harvested | Yield | Rural Population '000 | Yield growth/area growth | |
|---|---|---|---|---|
| 1990 | 79117585 | 11810 | 428034 | |
| 2012 (actual) | 107507437a | 16171a | 651430a | 1.03a |
| 2012 (forecast) | 112893931b | 14318b | 651430a | −2.29c |
aDenotes actual 2012 values for area harvested, yield, rural population, and the ratio of yield growth to harvested area growth. bDenotes forecast 2012 values for area harvested and yield using rural population, area harvested, and yield data for the period 1990–1999. cDenotes the ratio of the proportional difference in yields and area harvested between forecast and actual 2012 values. This is calculated as the ratio of (i) actual minus forecast yield over actual yield to (ii) actual minus forecast area harvested over actual area harvested. Source: Data derive from (Food and Agriculture Organization, 2014)
While the extensive growth of agriculture is generally recognized to be the proximate cause of biodiversity loss, there is less agreement on the solution. Arguments have been made both for the reduction in biodiversity impacts of extensive agricultural growth (land sharing) and the intensification of agriculture (land sparing). Proponents of land sharing make much of the fact that small-scale, labor-intensive farming is critical to food security in the developing world, and claim that there is scope for reducing stress on vulnerable taxa by developing more wildlife-friendly small-scale farming practices (Jackson et al 2007). In addition, they claim that there is scope for realizing more of the value of on-farm functional diversity (Tscharntke et al 2012). This follows from the fact that farming systems have the potential to deliver multiple ecosystem services, such as pollination or biological control, both through sampling effects and through the complementarity between species. Maintaining diversity within functional groups of species is argued to contribute to the resilience of the wider system by building in the heterogeneity needed to respond constructively to environmental shocks of one kind or another (Tscharntke et al 2005, Jackson et al 2007).
Proponents of land sparing development argue that highly intensive agriculture offers little scope for maintaining a diverse on-farm flora and fauna. Agricultural intensification has led to the loss of non-crop habitats, to the simplification of plant and animal communities in fields, and to the selection for common pest species (Stoate et al 2001). However, if it is associated with a reduced rate of land conversion, then intensification has at least the potential to offer conservation benefits (Foley 2005, Bruinsma 2009, Sachs et al 2009, Godfray et al 2010, Foley et al 2011). In this argument, the drivers of intensification in Sub-Saharan Africa—the range of national and international initiatives designed to promote crop improvements and integrated pest management within existing agriculture (Pretty et al 2011), and large-scale land acquisitions by external governments and corporations that followed the food and fuel price increases of 2006–2008 (Fenske 2011, Wouterse et al 2011, Liu et al 2013)—offer potentially positive conservation externalities.
There are few studies of the biodiversity effects of land sharing versus land sparing strategies, and those that do exist focus on the impact of each strategy on a common set of species. Phalan et al (2011) compared crop yields with the density of bird and tree species across gradients of agricultural intensity in Ghana and India. They found that most species were negatively impacted by agriculture, and that species with small global ranges were the most negatively impacted. They concluded that land sparing was therefore the more effective conservation strategy. Others have argued that whether conservation goals are better met by land sharing or land sparing depends on the taxonomic groups being considered (Tscharntke et al 2005, Tscharntke et al 2012). The arguments for separation (land sparing) appear to be strongest for mammals and birds. The arguments for the integration of production and conservation on the same land (land sharing) appear to be strongest for plants. A country-level study of the relation between projected habitat loss and endemic plant species, for example, found threats to endemic plant species to be uncorrelated with land use-induced habitat loss (Giam et al 2010). While many of the primary threats to plant diversity—harvesting, habitat loss, and invasive species—are driven by the demand for foods, fuels, and fibers, plants may be less impacted by habitat fragmentation than other species at least in the short run. This may response of plants to habitat fragmentation has also been found to be slow (Henle et al 2004). A study of the response of vascular plant species richness to long-term habitat loss and fragmentation in Estonian grasslands, for example, found the number species to be explained not by the current area of grasslands, but by the area as it was seven decades in the past (Helm et al 2006).
In this paper we reconsider the relation between the growth of agriculture and biodiversity change in Sub-Saharan Africa, distinguishing between intensive and extensive growth. We ask how threats to biodiversity are related to each type of growth, while controlling for other factors argued to be correlated with biodiversity change. Using two measures of the threats to three broad taxa—mammals, birds, and plants—we consider how each has changed with the growth of agriculture since the middle of the 20th century. We further consider whether our measures of threats to biodiversity offer evidence for the effects of the recent acceleration in agricultural intensification in the region.
2. Data and methods
To evaluate the biodiversity effects of agricultural growth we formulated and estimated a model of biodiversity change that assumes people have preferences over agricultural and other goods and services, as well as the biodiversity that supports those services, and that they implicitly weigh the net benefits to be had from agricultural growth against the costs of biodiversity loss. That is, the simplification of agro-ecosystems to reduce the abundance of weeds, pests and pathogens and to increase the abundance of beneficial species is deliberate. The very substantial literature on the value of biodiversity and the components of biodiversity shows that willingness to pay to increase the abundance of particular species or to reduce the abundance of others reflects a wide range of direct and indirect, consumptive and non-consumptive, current and future benefits (Pearce et al 1999, Christie et al 2006, Barbier 2007, Barbier et al 2009, Barbier 2011). In this letter we abstract from the complexity of the problem, and assume that the benefits of the components of biodiversity can be grouped into those that contribute directly to income, and those that do not. The latter comprise, for example, many of the cultural services identified by (Millennium Ecosystem Assessment 2005): reflecting the totemic, religious or cultural value attaching to individual species, landscapes or ecosystems.
Of course there are many reasons why actual resource use may differ from socially optimal resource use, including ignorance or fundamental uncertainty about the consequences of particular actions, the displacement of the costs of actions in space or time, the structure of property rights, the ineffectiveness of mechanisms for the governance of resources in the public domain, externalities, and the public good nature of many ecosystem services (Perrings 2014). Nevertheless, as a first approximation, the assumption that decision-makers have some awareness of the factors to be balanced in growing the agricultural sector is reasonable.
To capture this we posited a social utility function,  for the ith country of the general form
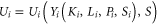
in which  denotes the goods and services supporting consumption and investment,
  denotes non-agricultural assets (capital),
  denotes agricultural assets (land),
  denotes human resources (population), and
  denotes the set of species in all countries that affects social utility (biodiversity). That is, we supposed that people derive both direct,
  and indirect,
  benefits from biodiversity. A necessary condition for social utility to be maximized is that:
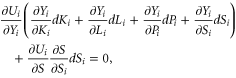
from which we obtain
This says that if resources are being used optimally in country  the change in biodiversity associated with a change in other assets should balance the marginal utility of the goods and services generated by those assets when evaluated in terms of the marginal direct and indirect utility of biodiversity. In other words, if a consequence of the growth of agricultural assets and other forms of capital is a decline in biodiversity, then the value of the goods and services created in the process should be at least as great as the value of the lost biodiversity.
There are no perfect measures of biodiversity change,  The most commonly used measure is number of species designated as threatened in the IUCN Red List (IUCN 2014). However, there are a number of potential difficulties with the Red List as a measure of biodiversity change. Since it is still under construction, it does not yet yield usable data on rates of change in the number of threatened species. Revisions in the basis on which estimates are made mean that estimates for different years are still not comparable. In addition, different levels of reporting effort mean that the series is likely to suffer from measurement error due to selection bias (although this is likely to affect the estimated model coefficients less than their standard errors) (Possingham et al 2002, Rodrigues et al 2006, Butchart et al 2007, Hilton-Taylor et al 2009, Boakes et al 2010).
We accordingly chose to use two different proxies for  each comprising the natural log of the number of endemic species in each taxonomic group identified in a country weighted by an index of threat. For the weights, we chose two measures designed to capture the threat posed by land use change, but with more or less account taken of the global conservation value of threatened species. The first derives from the Global Environment Facility's (GEF) biodiversity benefits index, GBI (Global Environment Facility 2013b). The GBI is designed to provide a relative ranking of the value of local conservation in meeting the GEF's biodiversity objectives. In principle, these objectives aim to serve the global public good through local species conservation. The GBI is a weighted sum of terrestrial (0.8) and marine (0.2) biodiversity scores that measure both the conservation value of ecoregions, and the threat to species within ecoregions. Scores at the country level are obtained by aggregating scores for 'country-ecoregion components' obtained from the World Wildlife Fund's global map of ecoregions. The score is built up from subnational data available for specific taxonomic groups, and is constructed in four steps: identification of ecoregions within a country; weighting ecoregions components by species and ecoregion representativeness and threat; generating a weighted average for the ecoregion; aggregating ecoregion scores for the country (Global Environment Facility 2013a). While the GBI has considerable appeal as a global index of threat, however, it suffers from the drawback that terrestrial biodiversity does not currently include plants.
The second weight addresses this problem, but does not include the broader conservation value of threatened species. We follow the general method used by (Giam et al 2010). Our index of threat is taken to be the residuals in an estimated power-law endemic species-non-agricultural area relationship. This differs from the measure in (Giam et al 2010) only in that we used non-agricultural land rather than all land as the area in the species-area relation. The change is motivated by the fact that loss of habitat due to agricultural conversion is argued to be the main driver of biodiversity loss. The results turn out to be qualitatively similar to those obtained when agricultural land is included, but the fit of all models improves, and the significance of all agricultural growth variables increases, if agricultural land is excluded.
While neither weight is an ideal measure of threat, and while the GBI includes plants only through measures of ecosystem health, both reflect widely accepted principles of conservation biology and yield mutually consistent results. We compiled a data set covering 27 Sub-Saharan countries5 for which information was available on the number of endemic species in our three taxonomic groups—animals, birds and plants. Country-level data on the number of endemic plant species derived from Pitman and Jørgensen (2002). Country-level data on the number of endemic mammal and bird species derived from the IUCN Red List (IUCN 2014). The difference in time stamp on the data for plants and other taxa means that the model results are not strictly comparable, but all yield the same basic insights into the difference between short and long run effects.
Table 2 presents the descriptive statistics for the endemic species data. It is apparent that there are large differences between the mean and the median values for each taxonomic group. There are also significant differences in standard deviations, skewness and kurtosis. In all cases we have high values for both skewness and kurtosis. These, together with the high differences between the mean and the median values, imply a highly asymmetric distribution. Indeed, the Jarque-Bera test for normality rejects the null hypothesis that the data have a normal distribution.
Table 2. Descriptive statistics of threatened endemic mammals and birds (2014), and threatened endemic plants (2002), in Sub-Saharan countries.
| Mammals | Birds | Plants | |
|---|---|---|---|
| Mean | 5.15 | 3.04 | 943.92 |
| Median | 2 | 0 | 62 |
| Maximum | 32 | 23 | 16500 |
| Minimum | 0 | 0 | 0 |
| Standard deviation | 9.01 | 5.99 | 3274.43 |
| Skewness | 2.16 | 2.10 | 4.54 |
| Kurtosis | 6.42 | 6.38 | 22.11 |
| Sum | 139 | 82 | 23598 |
| Sum Sq. Dev. | 2109.41 | 932.96 | 2.57E+08 |
| Observations | 27 | 27 | 25 |
Sources: Data on endemic mammals and birds derive from (IUCN 2014). Data on endemic plants derive from supplementary online material in Pitman and Jørgensen (2002).
In the absence of an effective measure of changes in non-agricultural wealth for all countries in the sample, we proxied  by Gross National Income (GNI) per capita evaluated at purchasing power parity in constant 2011 international dollars. GNI is the sum of value added by all resident producers in a country, plus income from abroad. It was converted to international dollars using purchasing power parity rates (the number of units of a country's currency required to buy the same goods and services in that country that a U.S. dollar would buy in the United States). If resources were evaluated at their true social opportunity cost this would be equal to the annual return on all capital stocks in a country. The discounted stream of GNI would then approximate the value of those capital stocks. Since the market prices used to calculate GNI are not good approximations of social opportunity cost GNI is not a perfect measure. However, although there exist several efforts to build capital accounts (World Bank 2006, Ferreira et al 2008, World Bank 2011, UNU-IHDP and UNEP 2014), these do not yet offer adequate measures of the net benefit stream associated with changes in capital stocks over time. That is, they do not correct for the externalities that bias GNI. Nevertheless, GNI at purchasing power parity provides the most consistent international measure of the added value generated by capital stocks in different countries.
For the return on agricultural assets,  we distinguished between two measures. One is the extent of land under cultivation or pasture. The other is the productivity of agriculture on that land. The extensive growth of agriculture is measured by change in the proportion of total land area under temporary or permanent crops or pasture by Food and Agriculture Organization (FAO) definitions. Temporary crops, pasture, or fallow generally implies annual use, and excludes land not in current use in a shifting cultivation system. Permanent crops or pasture implies multi-year crops or use (World Bank 2014a). The intensive growth of agriculture is measured by change in agricultural value added per employee in constant 2005 dollars. Agricultural value added reflects agricultural output (ISIC divisions 1-5) less the value of intermediate inputs. This comprises value added from forestry, hunting, and fishing as well as cultivation of crops and livestock production (World Bank 2014b). Tests using Variance Inflation Factors (VIF) revealed no evidence of colinearity between this measure and Gross National Income per capita.
Finally, we used population for our proxy for the contribution of human capital to social utility,  The data are mid year estimates derived from the UN Statistical Division and reported by the World Bank (World Bank 2014c). To reduce the potential for bias occurring due to the potential endogeneity between the explanatory variables and species we use lagged values of the explanatory variables.
Our estimated models were of the form

in which  is the natural log of the number of endemic species in each taxonomic group identified in a country weighted by an index of threat in the
  country,
  is the change in Gross National Income per capita, our proxy for the return on all capital stocks,
  is the change in proportion of the land area of the country committed to temporary or permanent agriculture, our proxy for land conversion,
  is the change in value added per worker in the agricultural sector in constant 2005 dollars, our proxy for agricultural productivity,
 is population growth, and
  is an error term assumed to be independently and normally distributed with zero means. Since we were interested in differences in the effect of agricultural growth on different taxa, we estimated separate models for mammals, birds and plants.
To understand the different impacts of the extensive and intensive growth of agriculture we considered what is effectively the cumulative impact of agricultural growth on two time scales. The longer time scale is the period over which data on agricultural land area, agricultural productivity, the income generated by capital stocks, and population, have been reported in Sub-Saharan Africa. That is 


 Since we expect intensification to offer benefits only with a lag, this is the time scale over which we expect to observe the effects of both extensive and intensive growth to operate. However, we also considered a shorter time scale,


 a period over which the intensification of agriculture might be expected to have little positive impact on threats to endemic species. The first time scale covers all changes up to 2012 (2002 for plants). The second covers changes in the decade before 2012 (2002 for plants).
3. Results
First consider the longest time interval over which we assessed the relation between the conservation status of species and agricultural development. Our results for both threat proxies and for all three taxa, along with diagnostic tests, are reported in table 3. In the case of both mammals and birds the dependent variable is the natural log of the threat- weighted number of endemic species reported in (IUCN 2014). In the case of plants, it is the natural log of the threat-weighted number of endemic species reported in (Pitman and Jørgensen 2002). In all cases we found a positive and generally significant correlation between the number of threatened species and both population and per capita gross national income. These findings are as expected. Population and income growth are both expected to increase the pressure on endemic species. One qualification to this is that the correlation between population and threats to endemic plants was not significant. We return to the interpretation of our findings on population and income in the discussion.
Table 3. Endemic species OLS model results and diagnostics. Long-term specification.
| Description | Mammals1 | Mammals2 | Birds1 | Birds2 | Plants1 | Plants2 | |
|---|---|---|---|---|---|---|---|
| Constant | −23.344 | −17.805 | −28.126 | −23.085 | −9.389 | 0.136 | |
| [0.0270] | [0.063] | [0.011] | [0.019] | [0.632] | [0.994] | ||
| Population | Δ∞Pi | 4.62E-08 | 3.81E-08 | 7.41E-08 | 6.36E-08 | 4.76E-08 | 5.03E-08 |
| [0.004] | [0.010] | [0.011] | [0.019] | [0.371] | [0.278] | ||
| GΝΙ/c | Δ∞Yi | 0.001 | 0.0009 | 0.0007 | 0.0006 | 0.001 | 0.001 |
| [0.000] | [0.000] | [0.057] | [0.081] | [0.022] | [0.020] | ||
| Log (Land conversion) | Δ∞Li | 3.667 | 3.124 | 3.687 | 3.426 | 3.486 | 2.166 |
| [0.000] | [0.000] | [0.000] | [0.000] | [0.002] | [0.023] | ||
| Log (Ag productivity) | Δ∞Vi | −4.260 | −3.698 | −3.925 | −3.376 | −5.340 | −4.852 |
| [0.001] | [0.002] | [0.014] | [0.022] | [0.060] | [0.047] | ||
| R2-adj | 0.58 | 0.54 | 0.61 | 0.60 | 0.48 | 0.39 | |
| White | 1.043 | 1.409 | 0.787 | 0.689 | 0.754 | 0.654 | |
| [0.476] | [0.279] | [0.669] | [0.750] | [0.692] | [0.764] | ||
| Jarque-Bera | 0.565 | 0.542 | 1.458 | 1.646 | 3.610 | 3.490 | |
| [0.754] | [0.762] | [0.482] | [0.440] | [0.164] | [0.175] | ||
| RESET (quadratic) | 0.038 | 0.040 | 3.561 | 4.506 | 1.430 | 2.612 | |
| [0.848] | [0.843] | [0.073] | [0.046] | [0.249] | [0.126] | ||
| RESET (cubic) | 0.100 | 0.181 | 2.342 | 2.837 | 1.775 | 2.304 | |
| [0.905] | [0.836] | [0.122] | [0.082] | [0.203] | [0.134] |
Notes: 1. Endemic species weighted by GEF Biodiversity index.2. Endemic species weighted by the residuals of a fitted power-law species-area relationship.3. P-Values in brackets. Standard errors used are Newey-West Heteroskedasticity consistent.Source: Authors' calculations.
The variables that are the primary focus of this paper are land conversion (the extensive growth of agriculture) and productivity (the intensive growth of agriculture). From the literature we expected to find a strong positive correlation between the extensive growth of agriculture and threats to species, and a strong negative correlation between the intensive growth of agriculture and threats to species. Over the longest period that is exactly what we found. The extensive growth of agriculture in Sub Saharan Africa is strongly and positively correlated with the threat to endemic species in all three taxonomic groups, and the relation is significant at the 0, 01 level in all specifications other than species-area-weighted endemic plants, where it is significant at the 0, 02 level. Intensification is strongly and negatively correlated with threats to endemic species, and the relation is similarly significant at the 0, 01 level for mammals and birds, and at the 0, 06 level for plants.
In all models estimated the fit was reasonable, and the diagnostics suggested no major biases. Heteroskedasticity in some specifications (revealed by the White test) was addressed via the presentation of robust standard errors. RESET tests revealed no evidence of specification error for significance levels of 0,01. Finally, application of the Jarque-Bera test revealed no evidence against normality of the estimated error terms at all levels of significance.
Now consider the much shorter time interval tested. Our results, along with diagnostic tests, are reported in table 4. In this set of models we are particularly interested in the direction and strength of the biodiversity impact of recent changes in variables, recalling that the period of change is different in the case of mammals and birds, on the one hand, and plants, on the other. We found population growth between 2002 and 2012 to be uncorrelated with threats to endemic mammals and birds, but population change between 1992 and 2002 to be positively correlated with threats to plants. We found income growth between 1992 and 2002 to be positively correlated with threats to endemic mammals and birds, but income growth between 1992 and 2002 to be negatively correlated with threats to plants, and in all cases to be significant at the 0,05 level.
Table 4. Endemic species OLS model results and diagnostics. Short-term specification.
| Description | Mammals1 | Mammals2 | Birds1 | Birds2 | Plants1 | Plants2 | |
|---|---|---|---|---|---|---|---|
| Constant | −6.755 | −4.071 | −11.000 | −5.895 | −1.085 | −2.795 | |
| [0.006] | [0.048] | [0.000] | [0.000] | [0.675] | [0.199] | ||
| Population | Δ10 Pi | −5.74E-08 | −6.46E-08 | 2.51E-07 | 2.19E-07 | 7.81E-07 | 5.15E-07 |
| [0.816] | [0.753] | [0.480] | [0.488] | [0.036] | [0.068] | ||
| GΝΙ per capita | Δ10 Yi | 0.003 | 0.002 | 0.004 | 0.004 | −0.004 | −0.003 |
| [0.003] | [0.004] | [0.000] | [0.000] | [0.030] | [0.046] | ||
| Log(Land conversion) | Δ10 Li | 0.000 26 | 0.000 24 | 0.000 17 | 0.000 18 | 0.000 21 | 0.000 13 |
| [0.027] | [0.017] | [0.271] | [0.211] | [0.019] | [0.070] | ||
| Log(Ag productivity) | Δ10 Vi | 0.0026 | 0.0022 | −0.0023 | −0.0024 | −0.0018 | −0.0014 |
| [0.492] | [0.486] | [0.725] | [0.671] | [0.768] | [0.774] | ||
| R2-adj | 0.20 | 0.19 | 0.40 | 0.43 | 0.08 | 0.01 | |
| White | 0.901 | 0.946 | 2.181 | 2.331 | 1.395 | 1.435 | |
| [0.580] | [0.547] | [0.010] | [0.082] | [0.340] | [0.325] | ||
| Breusch-Godfrey | 0.065 | 0.000 | 0.951 | 0.733 | 0.617 | 0.506 | |
| [0.938] | [1.000] | [0.404] | [0.494] | [0.553] | [0.613] |
Notes: 1. Endemic species weighted by GEF Biodiversity index.2. Endemic species weighted by the residuals of a fitted power-law species-area relationship.3. P-Values in brackets. Standard errors used are Newey-West Heteroskedasticity consistent.
Of the variables of special interest here—land conversion and agricultural productivity—land conversion had the expected sign for all taxa, but was significant (at the 0,01 level) only in the case of mammals and plants. That is, land conversion was associated with a statistically significant increase in the number of threatened endemic mammal and plant species within the same decade. The most interesting finding, however, concerns the effect of productivity growth. Agricultural productivity growth was uncorrelated with the number of threatened endemic mammal species for all taxa. Increasing agricultural productivity in Sub Saharan Africa within the most recent decade for which we have data had no statistically significant association with threats to mammal, bird or plant species within that decade.
Given the functional form of the estimated models, the coefficients on the agricultural growth variables are direct measures of the elasticity of the threat response of changes in the extensive and intensive agricultural growth. That is, they measure the change in threats to a species from a change in land conversion or agricultural productivity. In the case of mammals, we found a 1% increase in agricultural land conversion to be associated with a 3.7% (GBI specification) and 3.1% (species-area specification) increase in the number of threatened endemic species. By comparison, a 1% increase in agricultural productivity was associated with a 4.3% (GBI specification) and 3.7% (species-area specification) reduction in the number of threatened species. In the case of endemic birds, the extensive growth elasticities were 3.7 (GBI specification) and 3.4 (species-area specification), while the intensive growth elasticities were −3.9 (GBI specification) and −3.4 (species-area specification). In the case of endemic plants, the extensive growth elasticities were 3.4 and 2.1, while the intensive growth elasticities were −5.3 and −4.9 (see figure 1 for a visual check). In the long run, increasing the intensification of agriculture does more to reduce threats to endemic mammals, birds and plants than reducing the extensive growth of agriculture.

Figure 1. The endemic species threat elasticities of the extensive and intensive growth of agriculture. The threat response of extensive agricultural growth is positive and similar for all taxa in the GBI-weighted models. In the species-area weighted models it is highest for birds and lowest for plants. The threat elasticity of intensification is negative for all taxa and all models. It is also greater in absolute value than the threat elasticity of the extensive growth of agriculture except in the case of birds (GBI specification). Source: table 3.
Download figure:
Standard image High-resolution image
4. Discussion
So what can be inferred about the relative conservation impact of the extensive and intensive growth of agriculture in Africa? A first point to make is that since Africa has the least intensive agricultural sector of all the world's regions, we would expect the correlation between extensive growth and threats to species to be stronger than the correlation between intensive growth and threats to species. In the long-term models we found that threats to birds, mammals and plants were all positively correlated with the extensive growth of agriculture and negatively correlated with intensive growth, as expected. This is consistent with the arguments of the Millennium Assessment, and the wider literature on the primary drivers of biodiversity change. The conversion of land to agriculture increases habitat loss and hence the threat to affected species. But we also found that intensification had the stronger effect. More particularly, the threat elasticity of productivity growth was higher than the threat elasticity of extensive growth for all models except for the species-area specification for endemic birds.
These findings are at least consistent with those of Phalan et al (2011). Across Sub Saharan Africa, the promotion of agricultural intensification to offset the negative effects of land conversion may be an effective long-term strategy for the conservation of endemic species. At the same time, however, the threat elasticity of the extensive growth of agriculture is still extremely high. This is arguably the way in which population growth most directly impacts endemic species. Measures to limit the extensive growth of agriculture would be expected to be associated with reduced threats to all endemic species. More importantly, this is the only option that is associated with a significant effect on short time scales. On short time scales we found land conversion to be positively correlated with threats to endemic mammal and plant species, but agricultural productivity growth to be uncorrelated with threats to all taxonomic groups. While intensification of agriculture offers potentially significant conservation benefits, these may not be realized over short time scales.
The negative effects of land conversion on short time scales is consistent with what is known about the environmental impacts of development in low income countries. In previous studies involving a wider group of countries we found the relation between per capita income and species under threat to be quadratic for all taxa (Perrings and Halkos 2012, Perrings 2014). That is, threats to species were first increasing and then decreasing in income per capita. We found the turning points to differ between taxonomic groups, but if countries were ranked by per capita income, they occurred at around the 74th percentile of countries in the sample for mammals, at around the 52nd percentile for birds, and at around the 67th percentile for plants. The direct implication of this is that among low-income countries, income growth was expected to have a negative impact on biodiversity, and that this effect was more persistent for mammals and plants than for birds. In the present study we found threats to biodiversity to be monotonically increasing in per capita income. However, at some point we know this effect reverses.
We found no evidence for positive short run effects of intensification. This should not be surprising, however, since the wider literature suggests that the first round effects of intensification of agriculture include negative on-and off-site impacts on wild species, and that these are greater for plants than for other species. Specifically, nutrient runoff, insecticides and fungicides have direct negative impacts on wild plants (Firbank et al 2008, Geiger et al 2010), as well as indirect impacts via effects on pollinators (Kremen et al 2002, Potts et al 2010), and pest predators (Zhao et al 2015). In the long run, however, intensification offers benefits by reducing the incentive for poorer farmers to convert forests, savannas, and grasslands to crop production. Much current habitat loss stems from the expansion of croplands into existing wildlife refugia where land is often cropped in unsustainable ways—soil nutrients not being replenished (Hazell 2001, Perrings et al 2014). In many cases this is because farmers have no secure tenure, and so no incentive to invest in soil maintenance. In such cases farmland rapidly degrades and is frequently abandoned, encouraging yet deeper inroads into the same wildlife refugia (Barbier and Burgess 2001, Barrett 2013).
Our findings suggest that agricultural intensification has the potential to reduce the threats to endemic species but not necessarily on short time scales. Intensification may reduce future rates of habitat conversion, but may also increase current negative on- and off-site effects on wild species. Land sharing arguments are largely about mitigating the on-farm extinction risks associated with current land use. Land sparing arguments are more about mitigating the off-farm extinction risks associated with future land use. Both matter.
5. Conclusions
Over longer time scales we conclude that agricultural intensification has offered conservation benefits in Sub-Saharan Africa. However, we find little evidence that intensification reduces threats to biodiversity on shorter time scales. This is almost certainly because intensification works by slowing the rate of future land conversion. The main threat to all species in natural habitats remains the conversion of forests and grasslands to agriculture. It follows that the policies with the greatest potential to deliver conservation benefits are those that reduce the rate of future land conversion, while enhancing the habitat potential of existing agricultural land. In countries where the scope for agricultural transformation is limited, and where the growth of the rural population continues to spur land conversion, the most effective policies are likely to be those that give farmers stronger incentives to invest in conservation agriculture. Classically, these include policies that enhance security of land tenure, that improve access to credit, that build infrastructure and the effectiveness of markets. But they also include policies that give farmers an incentive to invest in the conservation of species that offer both direct and indirect benefits. Agri-environment schemes have a long history in Europe and North America, and are beginning to be applied in Sub-Saharan Africa under the name of payments for ecosystem services. These certainly have considerable potential to enhance the habitat value of farmland.
Footnotes
- 3
This group of countries includes Afghanistan, Bhutan, Burkina Faso, Burundi, Cambodia, Eritrea, Ethiopia, Kenya, Lao People's Dem Rep, Lesotho, Malawi, Micronesia, Fed States, Nepal, Niger, Papua New Guinea, Rwanda, Samoa, Solomon Islands, Sri Lanka, Tajikistan, Trinidad and Tobago, and Uganda.
- 4
Corn, rice, soybeans, wheat, bananas, cocoa, coffee, sugar cane, potatoes, cotton.
- 5
Angola, Benin, Burkina Faso, Burundi, Chad, Congo Rep., Cote d'Ivoire, Ethiopia, Gabon, Gambia, Guinea, Kenya, Lesotho, Malawi, Mali, Mozambique, Namibia, Nigeria, Rwanda, Senegal, Sierra Leone, South Africa, Sudan, Tanzania United Rep., Togo, Uganda, Zambia.