

Abstract
World energy demand is projected to increase by more than a third by 2035 and with it the use of water to extract and process fuels and generate electricity. Management of this energy-water nexus requires a clear understanding of the inter-related demands of these resources as well as their regional distribution. Toward this need the fresh water consumed for energy production was mapped for almost 12 000 watersheds distributed across the 21-economies comprising the Asia-Pacific Economic Cooperation. Fresh water consumption was estimated for ten different sectors including thermoelectric and hydroelectric power; energy extraction including coal, oil, natural gas, uranium and unconventional oil/gas; energy processing including oil and biofuels; and biofuel feedstock irrigation. These measures of water consumption were put in context by drawing comparison with published measures of water risk. In total 791 watersheds (32%) of the 2511 watersheds where energy related water consumption occurred were also characterized by high to extreme water risk, these watersheds were designated as being at energy-water risk. For six economies watersheds at energy-water risk represented half or more of all basins where energy related water consumption occurred, while four additional economies exceeded 30%.
Export citation and abstract BibTeX RIS

Original content from this work may be used under the terms of the Creative Commons Attribution 3.0 licence. Any further distribution of this work must maintain attribution to the author(s) and the title of the work, journal citation and DOI.
1. Introduction
Energy production requires water, while providing water services requires energy. This important interplay, or nexus, has been gaining considerable interest in an international context. A few examples include energy and water as the theme of the 2014 World Water Day (United Nations 2014), with the corresponding World Water Development Report (WWAP (United Nations World Water Assessment Programme) 2014) devoted to exploring how water-related issues and choices impact energy and vice versa. The water for Energy Framework was launched during the 6th World Water Forum in 2012 to provide a common language for defining the impacts of energy on water (EIP 2015). The World Economic Forum issued a report in 2014 to inform energy policy-makers on nexus issues (WEF (World Economic Forum) 2014), while the World Bank initiated their Thirsty Energy program to support countries efforts to proactively manage energy and water together (WB (The World Bank) 2013). And, for the first time the International Energy Agency (IEA) included analyzes and projections of energy impacts on water in the World Energy Outlook (IEA (International Energy Agency) 2012). Such interest is driven by the fact that both energy and water are at the top of the global development agenda (Malone 2014), yet significant policy gaps exist in managing this nexus.
The importance of the energy-water nexus is signaled by the intensity of the interaction. Specifically, in 2010 global water withdrawals for energy production were estimated to be 583 billion cubic meters (Bm3) representing 15% of the world's total withdrawals, of which 66 Bm3 were consumed (IEA (International Energy Agency) 2012). World energy demand is projected to increase by more than a third by 2035 and with it the use of water to extract and process fuels and generate electricity; specifically, water withdrawals could increase by 20% and consumption by 85%, driven by a shift towards higher efficiency power plants with more advanced cooling systems (that reduce water withdrawals but increase consumption) and increased production of biofuel (IEA (International Energy Agency) 2012). Given that 1.2 billion people currently live in areas with physical scarcity of water (UNDP 2007), there is an increasing risk of conflict between energy production, other water users and environmental considerations.
Management of the nexus requires a clear understanding of the water used for energy production. Estimates at a global level have been developed by the IEA (International Energy Agency) (2012) as noted above. However, the world is anything but uniform, characterized by strong regional differences in population, resource demand, resource endowment, type and extent of water and energy infrastructure, economics, and industrialization to name a few. These differences lead to variability in energy production and accompanying water use at the regional level. Recognizing this regionalization the World Water Development Report (WWAP (United Nations World Water Assessment Programme) 2014) explored the energy-water nexus across five different continental and sub-continental regions. A series of regional case studies appeared in a special issue of Ecology and Society (Hussey and Pittock 2012). Spang et al (2014) utilized existing national energy portfolio data to estimate the water consumption of energy production for over 150 countries. Additionally, there are a number of studies that focus on the energy-water nexus of an individual country (e.g., Cai et al 2014, DOE (US Department of Energy) 2014, Mielke et al 2010) or a specific aspect of the energy-water nexus in a particular country (Averyt et al 2011, Tidwell et al 2013, Tidwell et al 2014).
In efforts to better inform the energy-water nexus dialog, this paper builds on and extends the previously noted work in two important ways. First, fresh water consumed in energy production is mapped across multiple economies and multiple use cases (e.g., thermoelectric power, fuel processing) at a subnational level to distinguish variability within economies. Second, the fresh water consumed in energy production is put in context by drawing comparison with published measures of water risk (WRI (World Resources Institute) 2015). The analysis addresses the 21-member economies of the Asia-Pacific Economic Cooperation (APEC) which are linked by shared geography and economy. The objective of the mapping is to quantify fresh water consumption by energy production at a subnational level, pinpoint potential vulnerabilities, and identify opportunities for international collaboration.
2. Methods
Mapping fresh water consumption for energy production in 11 653 watersheds across the 21-member economies of APEC relied on publically available data. Given the breadth of analysis, many different data sources were required. In general production or capacity data at the plant-level were taken as the entry point for analysis. These production data were combined with average water intensity values to estimate plant-level water consumption. To the extent possible the analysis endeavored to distinguish fresh from non-fresh water consumption, reporting only fresh water consumption here. Given limited availability of data no effort was made to distinguish between fresh water sources, i.e., stream, reservoir, groundwater or municipal utility. Plant-level estimates were aggregated by watershed and overlain on Aqueduct estimates of total water risk (WRI (World Resources Institute) 2015) to identify potential pinch-points between energy production and available water resources. Below a detailed description of the calculations and assumptions associated with each energy use sector is given.
2.1. Water for energy
2.1.1. Thermoelectric power
For thermoelectric power plants operating in the United States, water consumption estimates were available directly from Diehl et al (2013) along with information on water source (fresh versus non-fresh). Estimates were based on the unique characteristics of each plant, including fuel type, prime mover and cooling type. Power plant water consumption data was lacking from the open literature for all other APEC economics. Outside the United States, fresh water consumption, PPQi, was estimated by multiplying power plant production Pi (mega-Watt-hour), by the water intensity, WI, of the power plant (cubic meters per mega-Watt-hour [m3 MWh−1]):

where subscripts designate plant, i, fuel, f, and prime mover, p. Also lacking in the open literature were electricity production values for individual plants, which was estimated by multiplying plant capacity, C (mega-Watt [MW]), capacity factor, CF (%), and hours in a year, H (equation (1)). Data on power plant characteristics were available through the IHS International Exploration and Production Database (IHS 2014); specifically, plant name, location (latitude and longitude), primary fuel, prime mover, and capacity. Capacity factors, which are the ratio of a plant's actual generation to its potential generation, were not available for individual plants. To fill this gap, capacity factors were set equal to averages for the United States power plant fleet (EIA (Energy Information Administration) 2015a) distinguished by fuel type and prime mover. These plant level production values were then adjusted (by adjusting the capacity factor data) such that the total calculated electric power production (by fuel type and prime mover) equaled the reported production by APEC member economy (EIA (Energy Information Administration) 2015b).
Water intensity factors were taken from Macknick et al (2012), which were compiled from reported data in the open literature distinguished by fuel, prime mover and cooling type (reproduced in table 1). Power plant level information on cooling technology was not available so factors for the most common cooling type, recirculating cooling, were adopted. This resulted in inflated water consumption estimates for nuclear, gas and coal facilities using open-loop cooling (2 to 3 times overestimation); however, open-loop cooling with freshwater accounts for a small part of generation capacity (e.g., 14% Russia, 12% Canada, 4% China and 0% Japan, see IEA (International Energy Agency) 2012). Overestimation of water consumption also applied to dry cooled systems; however, utilization of this technology was very limited. One important exception were coal-fired plants in the Northern provinces of China where 127 GW of new generation was reported to operate with dry-cooling technology (Yang et al 2015), which were accounted for in this analysis.
Table 1. Water consumption factors.
| Energy process | Energy source | Water consumption factor | Unit |
|---|---|---|---|
| Thermoelectric power generation3 | Coal | 2.60 | m3 MWh−1 |
| Natural gas steam | 3.13 | m3 MWh−1 | |
| Natural gas combined cycle | 0.77 | m3 MWh−1 | |
| Nuclear | 2.55 | m3 MWh−1 | |
| Biopower | 2.09 | m3 MWh−1 | |
| Geothermal | 1.91 | m3 MWh−1 | |
| Hydropower | 17.0 | m3 MWh−1 | |
| Extraction4 | Coal | 0.043 | m3 GJ−1 |
| Conventional oil | 0.081 | m3 GJ−1 | |
| Conventional gas | 0.004 | m3 GJ−1 | |
| Uranium | 0.033 | m3 GJ−1 | |
| Unconventional oil/gas | 0.017 | m3 GJ−1 | |
| Processing4 | Oil | 0.04 | m3 GJ−1 |
| Bioethanol | 0.145 | m3 GJ−1 | |
| Biodiesel | 0.031 | m3 GJ−1 |
3Data reproduced from Macknick et al (2012), median values. 4Data reproduced from Spang et al (2014), median values.
As the primary concern is freshwater use, power plants located within 1.3 km of the coast were excluded from the analysis as they were assumed to be cooled with seawater. Finally, water consumption for thermoelectric power generation estimated at the power plant level was aggregated to the watershed and APEC member economy levels.
2.1.2. Hydropower
Water consumption associated with hydropower production was estimated using equation (1). Consistent with thermoelectric estimates, water intensity factors were taken from Macknick et al (2012). Estimates of United States based hydropower production utilized capacity factors taken from EIA (Energy Information Administration) (2015a), while all other APEC economies utilized the average capacity factor for the United States hydropower fleet.
It is recognized that estimating water consumed by hydropower production is problematic (Bakken et al 2013), as the majority of associated reservoirs are operated for multiple purposes. That is, the evaporation (i.e., water consumed) off of a reservoir should be equivalently accounted to all uses of the stored water (e.g., irrigation, flood control, instream flow) and not singularly related to hydropower. Unfortunately, data is lacking to defensibly distribute consumption among competing uses. To avoid inflating results, water consumption estimates for hydropower were not included in aggregate consumptive use values at the watershed and APEC member economy levels. Rather, these estimates provide a consistent basis for mapping where water is consumed for energy production as well as a measure of the relative intensity of consumption (among reservoirs).
2.1.3. Fuel extraction
Water consumption estimates, FEQi, for individual energy plays/mines were calculated as:

where P is the production (mega-Joules per year [MJ yr−1]) and WI is the water intensity of the extraction process (m3 MJ−1). Again, subscripts designate the play/mine, i, and fuel, f. Water intensity values were taken from Spang et al (2014) which were compiled from operational data in the open literature (reproduced in table 1). Consumptive water use was estimated for conventional and unconventional oil and gas, coal, and uranium. Similar to water consumption for thermoelectric power, the play/mine level estimates were aggregated to the watershed and APEC member economy levels.
Information on individual conventional oil and gas plays was available through the IHS International Exploration and Production Database (IHS 2014), providing data on the name, location, and cumulative production since initiation of operations. Annual production of the play, Pi, was calculated as:

where CPi is the cumulative production of the play, CPc is the cumulative production of the APEC member economy, and Pi is the annual production of the APEC member economy in 2012 (EIA (Energy Information Administration) 2015b). Offshore production was excluded from the analysis as utilization of sea water was assumed. A similar exercise was accomplished individually for conventional oil and conventional gas production.
Data on annual production of oil and gas from unconventional (shale) plays was available for the United States from EIA (Energy Information Administration) (2015c, 2015d). Canada and China are the only other APEC economies to produce unconventional oil and/or gas. Production data for these economies were taken from EIA (Energy Information Administration) (2015e).
Coal production data was available through the US Geological Survey (2015); specifically, information concerning the name of the mine, its location, capacity and status. Annual production was estimated according to equation (3) using international production data from EIA (Energy Information Administration) (2015b).
Uranium production data was limited to that available through the World Nuclear Association (2015). Production data by mine for 2014 was available for the world's top producers, including the APEC member economies, Canada, Australia, Russia, United States and China.
2.1.4. Fuel refining
Water consumption associated with the refining of oil, bioethanol and biodiesel was estimated at the plant-level and subsequently aggregated to the watershed and APEC member economy levels. Estimates were derived using equation (2) with water intensity values taken from Spang et al (2014). For oil refineries in the United States, plant location and production data were taken from EIA (Energy Information Administration) (2015f). Plant level information for all other refineries was available through the IHS International Exploration and Production Database (IHS 2014), including the name, location, status and capacity of the plant. Annual production was estimated according to equation (3) with international production data at the APEC member economy level coming from EIA (Energy Information Administration) (2015b). The IHS database also provided information on bioethanol and biodiesel plant name and location, but lacked capacity information. For this case, bioethanol and biodiesel production at the APEC member economy level (EIA (Energy Information Administration) 2015b) was uniformly distributed over all active plants in that economy. Location and production data for United States biofuel refineries came from EIA (Energy Information Administration) (2015f).
2.1.5. Biofuel feedstock
Water consumed by the irrigation of bioethanol and biodiesel feedstocks, FSQi, was estimated by multiplying biofuel production, Pi, by the water intensity of the feedstock, WIf,i

where the subscript i refers to the refinery and f to the feedstock. Water intensity factors were taken from the green, blue and gray water footprint of crops and derived crop products (Mekonnen and Hoekstra 2010). Footprint values characterize the volume of water required to yield a liter of biofuel based on the unique characteristics of both the feedstock and the location where it is grown. Where more than one feedstock supplies a refinery the average water footprint of the crops was used. The database distinguishes between green water, the consumptive demand of the crop met through natural rainfall, blue water, the portion of consumptive demand not met by rainfall (i.e., that requiring irrigation), and gray water, the volume of water fouled by pollution caused by cultivation. Blue water values were used here to remain consistent with water consumption measures used for the other energy sectors.
The water footprint database included unique values for 10 bioethanol and 7 biodiesel feedstocks estimated at a subnational level (state/province). For refineries in the United States feedstock mix associated with each plant was available from EIA (Energy Information Administration) (2015f), while for all other APEC member economies feedstock mix was available at the economy level (APEC (Asia-Pacific Economic Cooperation) 2008). In the absence of plant specific information, feedstock production was assumed to be cultivated in the watershed in which the refinery was located.
2.2. Water risk
A dependable supply of water is critical to human development and the environment. As such efforts have been made to quantitatively characterize water resources vulnerability, variously termed water scarcity, water stress or water risk. The difficulty of characterizing water risk is that there are many equally important dimensions to its evaluation (e.g., overuse, fouling by pollution, habitat loss, treaty deliveries), thus selecting the criteria by which water risk is assessed can be as much a policy decision as a scientific decision. While, numerous measures have been introduced to express water risk (e.g., Brown and Matlock 2011) no agreed upon international standard has been set. For purposes of this study a metric that broadly addresses the physical, institutional and environmental aspects of water resource vulnerability was desired and one that considered both surface water and groundwater supplies. Additionally, such data needed to be available at a subnational resolution for all APEC economies.
Water risk values associated with the Aqueduct Water Risk Atlas (WRI (World Resources Institute) 2015) fully met these criteria. Water risk values were based on a framework that included 12 global indicators grouped into three categories of risk to yield one aggregate value (used here). The first risk category was the water quantity risk that considered baseline water stress (ratio of withdrawals to available flow), inter-annual variability, seasonal variability, flood occurrence, drought severity, upstream storage and groundwater stress. The second category scored the physical water quality risk, measuring the return flow ratio and upstream protected land. The final category addressed regulatory and reputational risk, treating media coverage, access to water and threaten amphibians. Together these measures provided a consistent and comprehensive measure of water risk at a subnational level throughout the APEC region (see map in supplemental material file). A complete description of the data collection, calculation, and mapping techniques is described in the Aqueduct Water Risk Framework documents (Reig et al 2013).
3. Results
Water consumed by energy production was mapped for 11 653 watersheds comprising the 21-APEC member economies. Estimates were limited to fresh water consumption with no effort to distinguish source (surface water, groundwater, municipal) due to a lack of data. The analysis begins with a review of results mapped at the watershed scale that then progresses to the APEC member economy level. Water consumption was then put in context of water resource vulnerability by comparing it to an expression of water risk (WRI (World Resources Institute) 2015).
3.1. Water for energy
3.1.1. Watershed
Maps indicating the water consumed in energy production for each of the APEC economies were developed for ten different energy sectors. These sectors were organized into four groups, electric power generation (thermoelectric and hydroelectric), energy extraction (oil, natural gas, coal, uranium and unconventional oil/gas), energy processing (oil, biofuels), and biofuel feedstock irrigation. Figure 1 shows a map of the water consumed for thermoelectric power generation while figure 2 shows that for natural gas extraction. Maps for the other eight sectors are provided in the supplemental file for this paper.
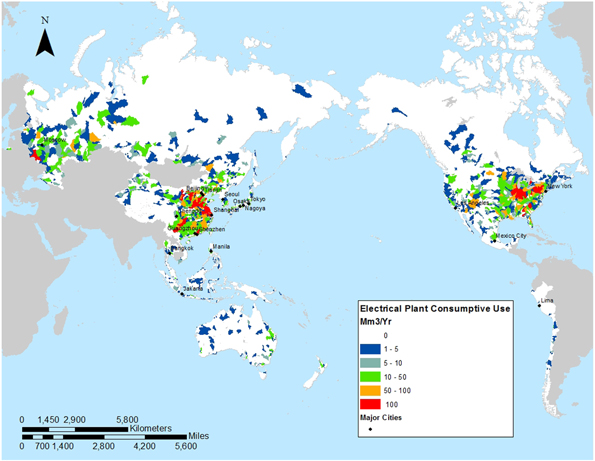
Figure 1. Water consumed for thermoelectric power generation in the 21-member economies of APEC. Data are mapped for almost 12 000 watersheds across this region.
Download figure:
Standard image High-resolution image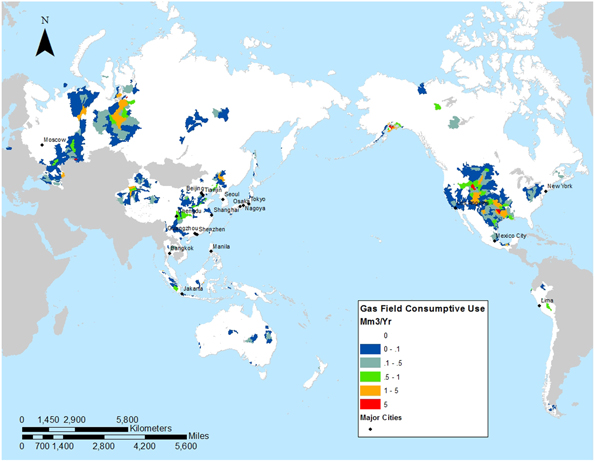
Figure 2. Water consumed for natural gas extraction in the 21-member economies of APEC.
Download figure:
Standard image High-resolution imageComparison of these maps reveals significant differences in water consumption patterns. The number of watersheds where energy related water consumption occurred differed by almost two orders of magnitude across the ten sectors. Thermoelectric power generation consumed water in 1211 watersheds in the APEC region, while natural gas extraction impacted 934, oil extraction 901, biofuel refining and feedstock production 383, unconventional oil/gas 320, oil refining 279, coal extraction 169, and uranium 20 watersheds. There were 776 watersheds with some hydropower production. In total, energy related water consumption occurred in 2511 watersheds (21%) in the APEC region (including hydropower).The spatial pattern of water consumption also differed across sectors. For example, heavy consumption of water by thermoelectric power occurred in the eastern United States, China, Australia and western Russia, while in contrast, unconventional oil/gas extraction was limited largely to the United States and Canada.
In total 38.9 Bm3 yr−1 of water was consumed by the energy sector across the APEC economies (excluding hydropower). Thermoelectric power generation was by far the largest consumer of water at 19.0 Bm3 yr−1 or 49% of consumption (figure 3). Coal extraction was the next largest consumer of water at 6.1 Bm3 yr−1 or 16%. Other notable sectors included unconventional oil/gas at 5.3 Bm3 yr−1 (14%), oil refining at 3.9 Bm3 yr−1 (10%) and oil extraction at 3.7 Bm3 yr−1 (9%).
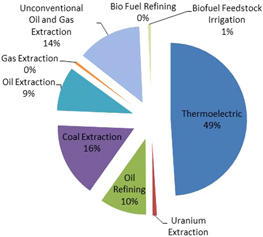
Figure 3. Percent water consumption by energy sector in the APEC region.
Download figure:
Standard image High-resolution imageCalculations of water consumption by hydropower production yielded an estimate of 27.4 Bm3 yr−1 for the APEC region with individual watersheds values exceeding 1.0 Bm3 yr−1 These values are unrealistically high as all reservoir evaporation (water consumption) was accounted to hydropower although the reservoirs were operated for purposes beyond hydropower. For this reason we did not include hydropower in the aggregate measures of water consumption for energy production (at the watershed or APEC levels).
3.1.2. APEC member economy
Fresh water consumption estimated at the watershed level was aggregated by APEC member economy for nine energy sectors, excluding hydropower. The relative contribution of each energy sector to total energy related water consumption was graphed by APEC economy in figure 4. Considerable variability in energy mix and related water consumption is evident across the APEC economies. This variability is consistent with differences in the geographic pattern of water consumption seen in the watershed maps (e.g., figures 1, 2). For most economies, thermoelectric power generation was responsible for the greatest share of energy related water consumption, accounting for ≥40% of consumption in 15 economies and 60% in 10 APEC member economies. Refining of oil accounted for ≥25% of 7 economies' energy sector water consumption, while oil extraction accounted for ≥35% of 3 APEC member economies' water consumption.
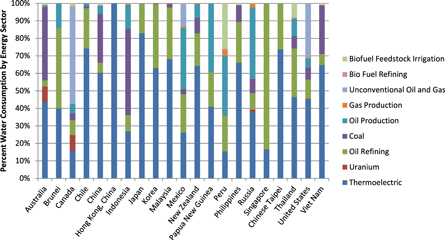
Figure 4. Relative contribution of each energy sector to total energy related water consumption by APEC member economy. Note that the consumption of sea water by thermoelectric generation and off-shore oil/natural gas extraction are not included.
Download figure:
Standard image High-resolution imageA four order of magnitude difference in total energy related water consumption was noted across the APEC economies (figure 5). The United States registered the largest water consumption at 13.8 Bm3 yr−1 followed by China at 13.7 Bm3 yr−1, Russia at 4.5 Bm3 yr−1, Canada at 1.8 Bm3 yr−1 and Australia at 1.0 Bm3 yr−1 In contrast, Brunei consumed only 2.0 Mm3 yr−1 and Papua New Guinea 12 Mm3 yr−1. On a per capita basis, Canada led with 51 m3/person, followed by Australia with 45 m3/person and the United States with 43 m3/person. In contrast, twelve other APEC member economies had rates less than 6 m3/person. Finally, when scaled by gross domestic product (GDP) 17 of the economies yielded values between 0.1 and 1 million m3 of energy related water consumption per billion dollars of GDP (Mm3/B$USD) (figure 5). Two countries had lower values, Hong Kong China (0.04 Mm3/B$USD) and Brunei (0.09 Mm3/B$USD), while two countries had higher values, Canada (1.01 Mm3/B$USD) and Russia (2.41 Mm3/B$USD). These results suggest no distinct relation between GDP and energy related water consumption. Data are provided in the supplemental material file.
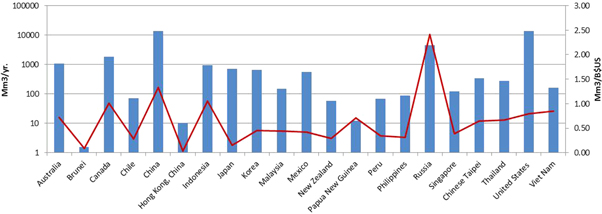
Figure 5. Energy related water consumption for each of the 21 APEC member economies (blue bars) and water consumption scaled by GDP (red line).
Download figure:
Standard image High-resolution imageThe opportunity was taken to compare these national level estimates of energy related water consumption with similar measures estimated by Spang et al (2014). Comparison was drawn for 18 of the 21 APEC economies considered by Spang, which he organized according to four energy sectors, fossil (that mapped to our conventional oil and gas extraction and processing; coal extraction; and unconventional oil and gas extraction), nuclear (mapped to our uranium extraction), biofuel (including production and processing), and thermoelectric. Comparison of results indicates some strong differences across economies and energy sectors, each for different reasons. Fossil fuel related water consumption estimates were higher than Spang's in the United States (34%) and Canada (35%) likely due to rapid growth in unconventional oil/gas in the 5 year gap between these publications. Higher estimates for China (27%) were also noted reflecting rapid growth in fuel demand for the electric sector over this period of time. In contrast several economies yielded estimates on the order of 15%–30% lower than Spang, likely reflecting the fact that we assumed offshore oil and gas extraction used saline water. Biofuel production and processing estimates oscillated between higher and lower than Spang's estimates (up to a few hundred percent in either direction) likely due to use of watershed specific water intensity factors for feedstock irrigation (Mekonnen and Hoekstra 2010) while also accounting for feedstocks that did not require irrigation (cheese whey, tallow, waste cooking oil). Estimates of water consumption related to the nuclear sector also underestimated Spang's values by 40% to a few hundred percent as our estimates did not consider conversion, enrichment, and fabrication due to lack of plant specific location data.
Thermoelectric water consumption values were found to consistently overestimate Spang's by 60%–80%. Some fraction of this difference is due to sector growth over the gap in time between the two publications as well as the fact we did not account for the lower water use by open-loop and dry cooling (see Methods section). However, most of this difference appears related to the use of different databases and how that data was interpreted. Critical to estimating water consumption was knowledge of the fuel type and prime mover. However, many plants have multiple units that involve different fuels or a different prime mover. The manner in which these nuances are registered at the power plant level could differ between databases. Different databases might be fraught with different gaps in information or may employ different categories for classifying the fuel type and/or prime mover. The analyst is then faced with decisions about how to interpret the data classification scheme as well as how to handle gaps in the data. For example, in the IHS database (IHS 2014) used here there were 446 fossil fuel plants that lacked information on prime mover (out of 6322 thermoelectric plants), while the prime mover classification for biomass plants (165) did not distinguish between steam and combustion. Without additional information we randomly assigned the prime mover classification based on the percentage mix in that economy, while all biomass plants were assumed to use a steam cycle. Taking different approaches to dealing with this ambiguity can easily explain the disparities between our results and Spang's. This important result underscores the need for better data.
3.2. Water risk
3.2.1. Watershed
In figure 6 the Aqueduct Water Risk metric was overlain on the total energy related water consumption data. Stippled areas designate watersheds with high to extreme water risk. Figures 7 and 8, respectively, provide views of the same map but expanded around China and the United States (expanded views of other APEC regions are provided in the supplemental file for this paper). 'Energy-Water Risk' was inferred where these maps intersect; that is, watersheds where water risk was high to extreme and where energy related water consumption occurred. These watersheds at energy-water risk are locations where existing operations deserve extra attention and are also locations where expanding energy production could be problematic due to physical/institutional limitations of water supply.
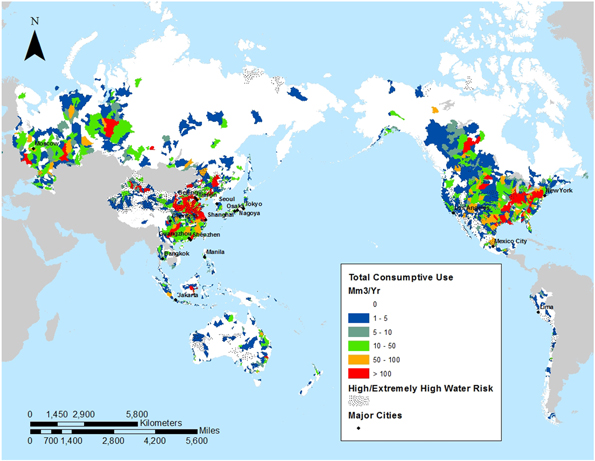
Figure 6. Total water consumption for energy production mapped over regional water risk (WRI (World Resources Institute) 2015). Data are mapped for the 21-member economies of APEC for almost 12 000 watersheds across this region.
Download figure:
Standard image High-resolution image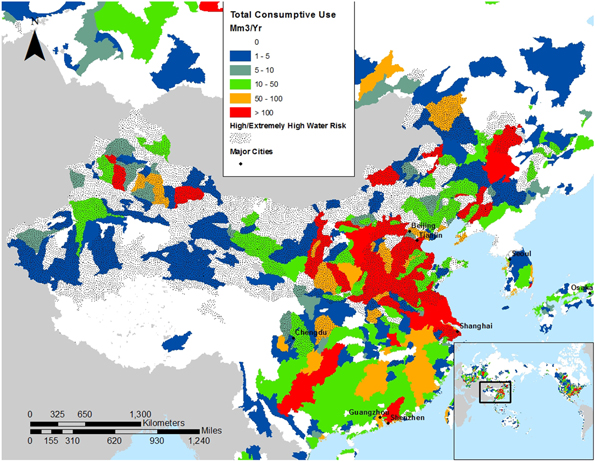
Figure 7. Total energy related water consumption mapped over regional water risk (WRI (World Resources Institute) 2015) with a focus on the China region.
Download figure:
Standard image High-resolution image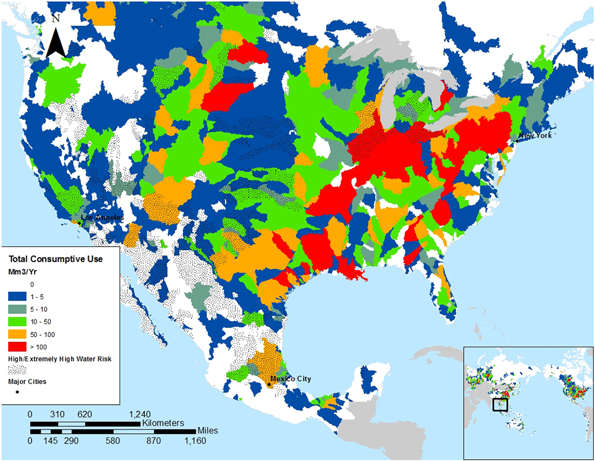
Figure 8. Total energy related water consumption mapped over regional water risk (WRI (World Resources Institute) 2015) with a focus on the United States region.
Download figure:
Standard image High-resolution image
In total 2329 watersheds in the APEC region (20%) were designated at high to extreme water risk, while 791 of these watersheds also had some energy related water use—thus defined as being at energy-water risk. The highest concentration of watersheds at energy-water risk was in northeastern China and the western United States. Thermoelectric power production contributed to energy-water risk in 437 watersheds, gas production in 337, oil extraction in 331, hydropower in 190, biofuel feedstock production and refining in 154 watersheds, oil refining in 114 watersheds, and unconventional oil and gas in 102 watersheds.
3.2.2. APEC member economy
There was significant disparity in water risk across the 21 APEC economies (table 2). Nine economies had over 20% of their watersheds at high to extreme water risk, with Korea at 61% being the highest. In contrast, nine of the remaining 12 economies had less than 10% of their watersheds at high to extreme water risk. These water vulnerable watersheds were found to be co-located with 791 watersheds where energy related water consumption occurred, designated as being at energy-water risk. This is particularly concerning for several economics where watersheds at energy-water risk represent 50% or more of all basins where water is used in energy production; specifically, Hong Kong China and Singapore (100% but which only occupy a single watershed each), Korea (59%), China (54%), Peru (51%) and Chinese Taipei (50%). Four other economies exceed 30%, Philippines (45%), United States (37%), Chile (37%) and Mexico (31%).
Table 2. Watersheds at water risk and energy-water risk by APEC member economies.
| APEC member economies | Total watersheds | Water risk | Energy related water consumption | Energy-water risk | Percent basins at energy-water risk (%)5 |
|---|---|---|---|---|---|
| Australia | 1362 | 207 | 156 | 41 | 26 |
| Brunei | 17 | 0 | 3 | 0 | 0 |
| Canada | 1486 | 46 | 188 | 35 | 19 |
| Chile | 268 | 103 | 38 | 14 | 37 |
| China | 1630 | 764 | 440 | 237 | 54 |
| Hong Kong, China | 1 | 1 | 1 | 1 | 100 |
| Indonesia | 865 | 80 | 127 | 27 | 21 |
| Japan | 240 | 55 | 108 | 19 | 17 |
| Korea | 63 | 39 | 22 | 13 | 59 |
| Malaysia | 237 | 9 | 35 | 3 | 9 |
| Mexico | 623 | 303 | 90 | 28 | 31 |
| New Zealand | 159 | 2 | 25 | 1 | 4 |
| Papua New Guinea | 152 | 7 | 10 | 2 | 20 |
| Peru | 216 | 95 | 35 | 18 | 51 |
| Philippines | 69 | 23 | 20 | 9 | 45 |
| Russia | 2294 | 106 | 314 | 31 | 10 |
| Singapore | 1 | 1 | 1 | 1 | 100 |
| Chinese Taipei | 35 | 13 | 19 | 10 | 50 |
| Thailand | 184 | 8 | 38 | 2 | 5 |
| United States of America | 1611 | 456 | 805 | 298 | 37 |
| Viet Nam | 135 | 11 | 36 | 1 | 3 |
5Percentage of basins at energy-water risk relative to the total number of basins where energy related water consumption occurred.
3.2.3. Megacities
Eighteen cities were identified with a population of ≥10 M people in the APEC region (see cities listed in each of the figures). These are locations of focused growth and thus significant demand for water and energy resources. Notable is the fact that eleven of these cities are located in watersheds with high to extreme water risk. Also, all of the cities have some energy related water consumption, in most cases resulting from two to more energy sectors.
4. Discussion
The water consumed in energy production has been mapped for 11 653 watersheds distributed across the 21 APEC economies. Water consumption for energy production was explored for ten different sectors including thermoelectric and hydroelectric power; energy extraction including coal, oil, natural gas, uranium and unconventional oil/gas; energy processing including oil and biofuels; and biofuel feedstock production. In turn these values have been overlain on measures of water risk (WRI (World Resources Institute) 2015) to identify regions of potential concern.
A significant challenge to this work was the availability of data. To accomplish this analysis multiple datasets were collected from a variety of sources. Consistent across the data record was information concerning the location (latitude and longitude) and type of energy asset (e.g., coal-fired power plant, ethanol refinery). Given the relative completeness of information on the locational characteristics of energy assets a high level of confidence is placed in the geospatial aspects of the analysis; specifically, results related to the spatial distribution of energy related water consumption and by extension watersheds at energy-water risk. Although our treatment of power plants with missing prime mover data influenced the spatial pattern of water consumption, this applied only to a small percentage of plants many of which were co-located in watersheds with other energy assets.
More problematic was calculating the amount of water consumed by each asset. This difficulty was largely the result of missing asset specific information, particularly asset level energy production and detailed accounting of asset characteristics (thermoelectric power lacked information on cooling system and some gaps in prime mover; hydropower lacked data to distribute evaporation from mulipurposed reservoirs; biofuel refining assets lacked capacity information; biofuel feedstock production lacked subnational specificity of feedstock type). The fidelity of water consumption calculations was further limited by the necessity of using water intensity factors that represent broad industry averages (table 1) while recognizing that individual plant operations often deviate significantly. Finally, asset level water source data were lacking which precluded surface water consumption being distinguished from groundwater, while saline water consumption could only be inferred based on the distance to the coast (thermoelectric and offshore oil and gas). These data challenges call into question the absolute measures of water consumption presented here as does the poor agreement with the results of Spang et al (2014). Nevertheless some confidence can be placed in the relative measures of water consumption, e.g., the spatial texture or location-to-location differences, as a consistent methodology was used to frame the analysis and local energy production estimates were scaled according to available production data at the APEC member economy level (EIA (Energy Information Administration) 2015b). Ultimately, these challenges point to the need for significant improvement in energy-water data.
A critical insight from this analysis is the importance of place in understanding the energy-water nexus. A review of the various maps of energy related water consumption (figures 1–2 and supplemental material) reveals significant granularity within each county; that is, a rich geospatial pattern of water consumption. Also important is the fact that the pattern and density of consumption varies considerably across the various energy sectors. For example, the pattern of water consumption for coal extraction is very different from that for thermoelectric power generation. There are a variety of factors at work that influence the noted patterns. The water consumption patterns associated with hydropower production, biofuel production/processing and the extraction of coal, oil, natural gas and uranium are largely related to resource endowment. Beyond endowment, unconventional oil and gas extraction patterns also reflect the diffusion of knowledge and expertise of this relatively new technology (largely limited to the United States and Canada). The pattern of water consumption for thermoelectric power production is strongly influenced by population density, while the pattern for conventional oil and gas processing suggests the role of infrastructure such as pipelines and ports that connect endowed regions with use centers. Finally, the influence of such factors as energy policy and economic development are evident when comparing APEC economics; for example, differences in the intensity of biofuel production and processing reflect differences in energy policy, while the intensity of thermoelectric related water consumption reflects both the demand for electricity (economy) and the mix of fuels used in generation (energy policy).
Place is also important when considering water risk as evidenced by a spatial pattern very different than that seen across any of the energy sectors. In total 2329 watersheds in the APEC region (20%) were designated at high to extreme water risk, with at least one at risk watershed in every APEC economy except Brunei (table 2). Most often these at risk basins are located in the mid-latitudes in arid regions. However, there is much more texture to the spatial pattern of water risk than just aridity—a few of the other factors at play include, limited groundwater supply, instream flow requirements, high water use and drought vulnerability (WRI (World Resources Institute) 2015). It is recognized that other water vulnerability metrics (Brown and Matlock 2011) would give slightly different patterns of vulnerable water conditions. Regardless, the Aqueduct Water Risk metric used here is particularly well suited for this analysis as it considers a very broad list of factors affecting water vulnerability and it has been quantified with a high level of granularity (subnational level).
Of particular interest to this study is the intersection between energy related water consumption and water risk. Energy related water consumption occurred in 2511 watersheds having the benefit of broadly distributed water demand; however, it also meant more opportunity to intersect with the 2329 watersheds designated at water risk. In total there were 791 watersheds where energy related water consumption overlapped water risk, which were designated as being at energy-water risk. Every APEC economy except Brunei had at least one watershed at energy-water risk, and every energy sector had multiple instances of watersheds at energy-water risk (uranium has the lowest number at 8). For six economies these watersheds represented half or more of all basins where energy related water consumption occurred. Four additional economies were at 30% or more. The fact that this many economies have this much energy related water consumption at risk to water supply is significant and underscores the importance of understanding and addressing the energy-water nexus.
Distinctive geospatial patterns have been noted for energy related water consumption as well as water risk, which in turn have resulted in a unique pattern of energy-water risk. As previously noted these patterns each derive from a range of physical and social factors (e.g., population, endowment, energy policy). This implies that different regions are faced with different energy-water challenges. Energy related water consumption could derive from one or more energy sectors each subject to different technologies and different water use profiles, while water vulnerabilities could result from limited physical water supply, over use, or poor water governance. Thus, steps taken to manage the energy-water nexus in one watershed may need to be very different than in a neighboring watershed. This local imperative becomes even more acute when considering how the energy-water nexus might evolve in the future. That is regions are characterized by differing future competition over water, evolving energy development, technology adoption, as well as, differences in the options available to mitigate risks (e.g., prior infrastructure investments and policy decisions limit future options).
While recognizing the importance of the local nature of energy-water challenges, there is still value in collaborating at higher levels. Although not equal, all APEC economies have some incentive as each have multiple watersheds subject to energy related water consumption and all but one, Brunei, have one or more watersheds identified at energy-water risk. For most energy sectors there are hundreds of watersheds each identified at energy-water risk, thus giving many opportunities for APEC economies to share lessons learned and or jointly test adaptive measures. Opportunities also exist to jointly consider energy-water management strategies on shared transboundary rivers (e.g., Columbia, Mekong) and aquifers. Collaboration on research, development and demonstration of next generation technology is another option.
Ultimately this work provides insight into the regional variability of the energy-water nexus. This is useful for a number of reasons. First, the analysis helps identify 'hot-spots'; in particular, regions that have overlapping energy and water risks. While such distinction does not necessarily mean the region is at danger, but rather attention to the co-management of energy and water is warranted. Second, the analysis provides insight for future development, providing quantitative data to inform new development concerning regions at energy-water risk. Finally, the analysis can help connect regions facing similar challenges and thus the opportunity for collaboration.
Acknowledgments
The authors acknowledge the very helpful comments of two anonymous reviewers. The work described in this article was funded by the United States Department of Energy's Office of International Affairs under a project for the Asia-Pacific Economic Cooperation's Energy Working Group (project number: EWG 03 2014S, APEC publication #: 216-RE-01.7, February 2016). The authors wish to recognize the support of Professors Huibin Du, Zhu Li, Jamie Pittock and Karen Hussey. Sandia National Laboratories is a multi-program laboratory managed and operated by Sandia Corporation, a wholly owned subsidiary of Lockheed Martin Corporation, for the United States Department of Energy's National Nuclear Security Administration under contract DE-AC04-94AL85000.