

Abstract
The Northern Sub-Saharan African (NSSA) region, which accounts for 20%–25% of the global carbon emissions from biomass burning, also suffers from frequent drought episodes and other disruptions to the hydrological cycle whose adverse societal impacts have been widely reported during the last several decades. This paper presents a conceptual framework of the NSSA regional climate system components that may be linked to biomass burning, as well as detailed analyses of a variety of satellite data for 2001–2014 in conjunction with relevant model-assimilated variables. Satellite fire detections in NSSA show that the vast majority (>75%) occurs in the savanna and woody savanna land-cover types. Starting in the 2006–2007 burning season through the end of the analyzed data in 2014, peak burning activity showed a net decrease of 2–7%/yr in different parts of NSSA, especially in the savanna regions. However, fire distribution shows appreciable coincidence with land-cover change. Although there is variable mutual exchange of different land cover types, during 2003–2013, cropland increased at an estimated rate of 0.28%/yr of the total NSSA land area, with most of it (0.18%/yr) coming from savanna. During the last decade, conversion to croplands increased in some areas classified as forests and wetlands, posing a threat to these vital and vulnerable ecosystems. Seasonal peak burning is anti-correlated with annual water-cycle indicators such as precipitation, soil moisture, vegetation greenness, and evapotranspiration, except in humid West Africa (5°–10° latitude), where this anti-correlation occurs exclusively in the dry season and burning virtually stops when monthly mean precipitation reaches 4 mm d−1. These results provide observational evidence of changes in land-cover and hydrological variables that are consistent with feedbacks from biomass burning in NSSA, and encourage more synergistic modeling and observational studies that can elaborate this feedback mechanism.
Export citation and abstract BibTeX RIS

Original content from this work may be used under the terms of the Creative Commons Attribution 3.0 licence. Any further distribution of this work must maintain attribution to the author(s) and the title of the work, journal citation and DOI.
1. Introduction
The Northern Sub-Saharan African (NSSA) region is the trans-African latitude zone bounded to the north and south by the Sahara and the Equator, respectively. This region is subjected to intense biomass burning during the dry season each year (e.g. figure 1), contributing 20%–25% of the global total annual carbon emissions from fires (e.g. van der Werf et al 2006, 2010, Roberts and Wooster 2008, Schultz et al 2008). Over the last several decades, NSSA has suffered from a number of severe drought episodes and associated acute food shortages that have resulted in overwhelming deaths of both people and livestock, particularly in the Sahel zone (i.e. northern NSSA). Among the most severe drought episodes are those that occurred during 1972–1975 and 1984–1985 (e.g. Grove 1986), as well as the more recent 2010–2011 episode in the Horn of Africa (Dutra et al 2013, Nicholson 2014). Following the first two episodes, by the 1990s, Lake Chad had shrunk to 5%–10% of its 1963 size of 25 000 km2 and has still not recovered beyond this limited coverage (e.g. Gao et al 2011, Lauwaet et al 2012, Lemoalle et al 2012).
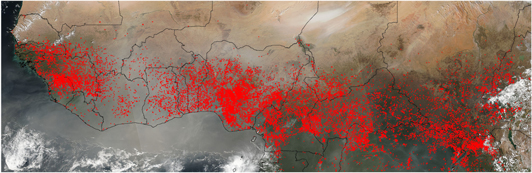
Figure 1. Satellite true color composite image from the Visible Imaging Radiometer Suite (VIIRS) on the Suomi National Polar Partnership (NPP) satellite acquired during three adjoining overpasses across NSSA on 30 January 2016, showing the locations of several thousands of fires (i.e. fire pixels) detected by VIIRS at 750 m spatial resolution marked in red across most of the Northern Sub-Saharan Africa (NSSA). Lake Chad can be seen near the image center, at the Nigeria/Chad boundary, whereas the bright area to its northeast is the Bodélé depression, which is considered to be the largest dust source in the world. Thick gray haze due to the mixing of dust and smoke can be seen across the region especially on the lower left quarter of the image, where it is flowing over the ocean, and appears to interact with the prominent white clouds. (Image courtesy of NASA Earth Observatory—http://earthobservatory.nasa.gov/IOTD/view.php?id=87475).
Download figure:
Standard image High-resolution imagePrevious studies on the possible causes of drought in the Sahel have either focused on sea surface temperature (SST) forcing or land–atmosphere interactions. Several results inferred that regional weather patterns forced by the North Atlantic SST have more influence on the Sahel regional climate than land–atmosphere interactions (Folland et al 1986, Giannini et al 2003, 2008, Lu and Delworth 2005, Hoerling et al 2006, Dai 2011, Nicholson and Dezfuli 2013). There have also been several studies that examined the teleconnection between rainfall variability in the Sahel and variation in SST over the tropical Pacific (Giannini et al 2003, 2008, Caminade and Terray 2010). A recent study further suggests that SST fluctuations that result in NSSA drought are strongly influenced by volcanic eruptions in the northern Hemisphere (Haywood et al 2013). Simulations of the hydrological impact of land use include those of Charney (1975), Garratt (1993), Xue and Shukla (1993), Xue 1997, Clark et al (2001), Taylor et al (2002), Li et al (2007), and Lebel and Ali (2009), all of which attribute reduced rainfall at least in part to land surface degradation. Specific influences inferred include, for instance: surface albedo (Charney 1975), deforestation (Zheng and Eltahir 1997), vegetation feedback (Claussen et al 1999), and soil moisture, with dry soil weakening mature convective systems (Gantner and Kalthoff 2010) and wet soil enhancing the system (Taylor et al 2010). In particular, through a number of general circulation model experiments, Taylor et al (2002) showed that changes in vegetation in the Sahel can cause substantial reductions in rainfall. Furthermore, Nicholson (2000) and Giannini et al (2003, 2008) found that land–atmosphere feedback amplifies variability in the Sahel rainfall resulting from oceanic forcing on the African monsoon. Therefore, improved modeling of the observed variability in precipitation requires knowledge of both SST and land–atmosphere interactions (Wang et al 2004).
The role of biomass burning in this phenomenon is not obvious, especially because the dry biomass-burning season (November–April) is out of phase with the rainy season, which occurs mainly from May to October (e.g. Knippertz and Fink 2008). However, a mixture of desert dust and smoke from biomass burning is known to contribute to high aerosol loads in the NSSA atmosphere (e.g. Yang et al 2013). Since both the dust and the black carbon from smoke are absorbing aerosols, they can strongly modify the energy balance in the atmosphere and the surface compared with clean conditions (e.g. Chung et al 2002, Ramanathan et al 2005, Magi et al 2008, Lau et al 2009, Bollasina et al 2011). Details of the aerosol impact on tropospheric and surface energy budgets over land, and hence precipitation and circulation, are related to surface conditions, including land cover, albedo, and soil moisture. For instance, a modeling study involving about a dozen global models coordinated under the Global Land–Atmosphere Coupling Experiment initiative identified regions of strong coupling between soil moisture and precipitation, of which NSSA is the most extensive (Koster et al 2004). However, the energy release and aerosol emission from the extensive biomass burning in NSSA are a potential source of perturbation to the system that has not been well addressed.
A growing set of literature is documenting the complex variability and properties of NSSA dust and smoke aerosols (e.g. Yang et al 2013, Zhang et al 2014). In particular, a recent study provided an observational evidence of smoke aerosol effects on reduction of cloud fraction in that region (Tosca et al 2014, 2015). However, there has yet to be a comprehensive study of the relationships between biomass burning and various parameters of the NSSA water cycle. Thus, this paper highlights the recent state and variability of biomass burning, land-cover, and hydrological parameters in a synergistic way. This will help provide a framework for future, more in-depth, studies that will integrate observations into an extensive suite of modeling studies in order to establish how strongly perturbations of terrestrial and biospheric moisture dynamics and regional circulation resulting from biomass burning can eventually affect rainfall, compared to the known impacts of perturbed SST patterns. Section 2 outlines the hypothesis, section 3 the methodology, section 4 the results, while section 5 summarizes the study and provides future perspectives.
2. Hypothesis and scope of study
Given the overwhelming occurrence of biomass burning in NSSA (e.g. van der Werf et al 2006, 2010, Ichoku et al 2008) and its inherent potential to affect aerosol emissions, surface albedo, vegetation changes, land degradation, deforestation, and surface evapotranspiration, it is reasonable to hypothesize that biomass burning exerts significant impact on the NSSA water cycle directly or indirectly across different spatial and temporal scales. A better understanding of the linkages can only be achieved through a holistic view of the regional land–atmosphere system rather than just individual components.
Figure 2 shows a conceptual schema of the NSSA regional chain of conditions and processes that could be directly or indirectly associated with biomass burning, categorized in terms of how closely they are related to the energy and water cycles, with societal impacts as the focal point. Conceptually, it all starts with human ignition of fires (e.g. Bird and Cali 1998, Dami et al 2012), which destroy the vegetation shielding the soil from the intense solar irradiance that characterizes the NSSA region, and modifies the surface albedo (Gatebe et al 2014). At the same time, the fire-generated smoke can affect the air quality and can, in conjunction with surface-albedo anomalies, contribute a radiative forcing of the regional climate (e.g. Yang et al 2013, Zhang et al 2014). Heat fluxes from the fire can affect the atmospheric circulation, which can transport not only dust, but also moisture that can eventually increase or reduce precipitation. The resulting precipitation change has a direct impact on runoff, soil-moisture, infiltration, and groundwater dynamics, whereas the lack of vegetation over the burned areas can lead to an increase in soil erosion and changes in surface water retention properties (e.g. de Wit and Stankiewicz 2006).
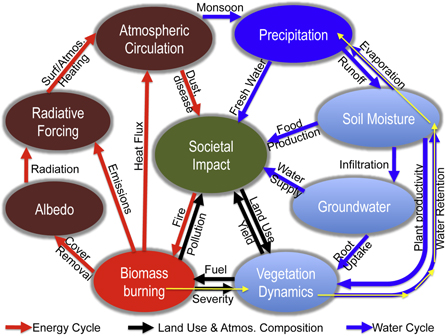
Figure 2. Conceptual schema of the possible links between various environmental phenomena and processes in the Northern Sub-Saharan African (NSSA) region, their repartition into carbon, energy and water cycles, and their relationships to the human society. This reflects the complex nature of the system. Biomass burning and precipitation can be conceived as being diametrically opposite each other, both in character and in season, as their peaks occur approximately six months apart in the NSSA region. The climate component can be perceived as the long-term evolution of this situation. Thin yellow arrows are used to indicate the approximate pathway explored in this study from biomass burning to precipitation, through land-cover changes, vegetation indices, soil moisture, and evapotranspiration.
Download figure:
Standard image High-resolution imageSpatially, a phenomenon or process in one part of the NSSA region can generate impacts and feedbacks in other parts. Temporally, figure 2 may be visualized as a pseudo annual cycle, with biomass burning and precipitation diametrically across from each other. Over several years or decades, the consequence of the relative interactions and feedbacks of the system components could characterize the nature of the regional climate variability and change, which may influence regional adaptation strategies. Therefore, since biomass burning is an extremely widespread environmental phenomenon in the NSSA region (e.g. figure 1), it is possible that its long-term impacts may include reduction in rainfall, leading to drought.
This study employs data analysis techniques to show some relationships in biomass burning, land-cover change, and other surface and atmospheric parameters associated with the variability of synoptic atmospheric dynamics and hydrological cycle. This pathway is roughly identified using thin yellow arrows in figure 2. It is expected that the results of the analysis performed here will complement other pathways investigated in recent studies (e.g. Yang et al 2013, Gatebe et al 2014, Tosca et al 2014, 2015), and feed into future numerical modeling studies that will unravel the dynamic linkages between these conditions and phenomena at different spatial and temporal scales. Such systems approach will ultimately clarify the indirect pathways from biomass burning to precipitation through the interactions and feedbacks of the related land-use/land-cover, energy-cycle, and water-cycle components, as illustrated in figure 2.
3. Methodology
3.1. Study region characteristics and investigation strategy
The NSSA region (defined in this study as 0°–20°N, 20°W–55°E) features a few prominent land-cover types that go from grasslands in the drier north through a variety of savanna, shrubland, and cropland types as one moves toward the forest in the wetter south (figure 3). There is a relatively equal distribution of the three savanna/grassland land cover types (grasslands, savannas and woody savannas) overall, although the distribution varies significantly between sub-regions. The dominant forest type in the NSSA region is evergreen broadleaf forest (∼98% of the regional forest cover). The rainy season in NSSA is clearly distinct from the dry (wildfire) season, with a steep rainfall gradient that goes from >1000 mm yr−1 at latitude 10°N (savanna dominated) down to <100 mm yr−1 at 15°N (grassland dominated), decreasing to trace amounts as the landscape transitions from savanna/grassland (Sahel) land cover type to the arid Sahara Desert.
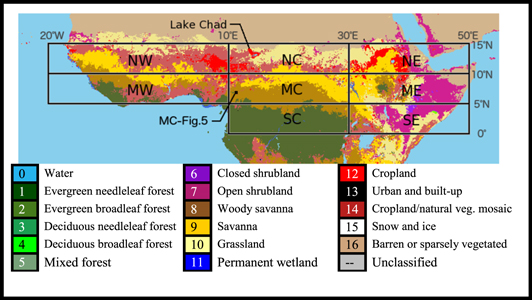
Figure 3. MODIS land cover map of the Northern Sub-Saharan Africa (NSSA) study region based on the international Geosphere–Biosphere Program (IGBP) land cover classification for 2004. Sub-regional blocks artificially delimited for further analysis are identified (horizontally: West, Central, East, and vertically: North, Middle, South), such that labels are composed from the first letters of the vertical and horizontal block coordinates (e.g. NW = north–west and MC = mid-central). The location of lake Chad is shown, whereas that of a small area used to illustrate the detailed dynamics of fire-induced land-cover changes in figure 5 is identified as 'MC-figure 5'.
Download figure:
Standard image High-resolution imageTo facilitate the analysis of conditions and processes that may reflect the unique sub-regional peculiarities of the NSSA region, a large portion of the region (0°–15°N, 20°W–50°E) was divided into nine blocks, of which eight represent land and one represents ocean (figure 3). Regionalization is a typical practice in studying large regions that have spatial heterogeneity, as it facilitates in-depth comparative examination of the sub-regions to characterize the differences in their behaviors with regard to phenomena of interest (e.g. Dezfuli and Nicholson 2013). In figure 3, the meridional (vertical) boundaries are roughly based on traditional geographical classifications of West, Central, and East Africa, whereas the zonal (horizontal) boundaries are simply located every 5° latitude from 0° to 15°N, to reflect the climatological rainfall gradient. The subdivision could not be based on land-cover types, which change over time, because quantifying their pattern of change due to biomass burning is an objective of this study, and therefore must be conducted within sub-regions with fixed boundaries. The sub-regional blocks used for this study (figure 3) are horizontally identified as: West, Central, East, and vertically identified as: North, Middle, South. The western blocks are each 5° × 30° whereas the rest are 5° × 20°. The block labels are composed from the first letters of the vertical and horizontal block designations (e.g. NW = northern West Africa, MC = middle Central Africa, etc).
3.2. Data resources
There are abundant satellite observations and model-assimilated datasets available for this study. The variables used include: land cover, normalized difference vegetation index (NDVI), fire detection and fire radiative power (FRP), precipitation, soil moisture, and evapotranspiration (ET). The land-cover data are from the MODIS Collection 5 yearly tiled (MCD12Q1) and gridded (MCD12C1) data at 500 m and 0.05° spatial resolutions, respectively (Friedl et al 2010). We used the layers based on the International Geosphere–Biosphere Program (IGBP) global vegetation classification scheme. NDVI at 1° resolution (Huete et al 2002) were extracted from Collection 5 Terra (MODVI) and Aqua (MYDVI) monthly datasets. Fire detection and FRP data at 1 km spatial resolution were extracted directly from the MODIS Collections 5 and 6 thermal anomalies products (MOD14/MYD14) (Giglio 2013, 2016). Precipitation data at 0.25° × 0.25° spatial resolution and 3-hourly (3B42) and monthly (3B43) temporal resolutions were obtained from the TRMM Multi-satellite Precipitation Analysis version 7 (TMPA v7) products (Huffman et al 2007, 2010). Soil moisture data were taken from the European Space Agency's Climate Change Initiative version 2.0 dataset (ESA CCI; Liu et al 2012), which combines retrievals from eight different active and passive sensors. Surface evapotranspiration data were obtained from the Global Land Data Assimilation System Version 1 (GLDAS-1) Noah Land Surface Model monthly dataset at 0.25° × 0.25° spatial resolution (Rodell et al 2004).
3.3. Data analyses
Analyses of the satellite and model datasets were performed both independently and jointly over each of the eight land blocks (figure 3) for the 14 year (2001–2014) study period, or slightly shorter time periods depending on data availability. The land cover dataset has an overall accuracy of 75% with substantial variability between classes (Friedl et al 2010). Based on the recommendation of the data producers, to minimize uncertainty and avoid unnecessary complexity in the analyses that would follow, some of the similar land cover types from the IGBP classification (figure 3) were aggregated to create 10 main land cover categories: water, forest, shrubland, savanna, grassland, wetland, cropland, urban, snow/ice and barren/sparse. Duplicate fire detections that occur at MODIS view angles larger than ±30° were carefully filtered out, so as to mitigate uncertainty in later land-cover change analyses. Since the FRP data are pixel based, in order to generate representative monthly FRP values compatible with the other gridded datasets for a given area, the summation of FRP measurements (in MW units) for each overpass within that area were averaged over the complete number of days in a month, then divided by the land area (km2), resulting in values expressed in MW km−2 or W m−2, which are units of fire radiative energy (FRE) flux.
Previous analyses of fire-induced land cover changes in Africa, particularly in areas dominated by savanna and croplands, encountered large uncertainties due to the relatively coarse resolution of typical satellite observations compared to the small size of burning on the ground (e.g. Ehrlich et al 1997). Thus, satellite burned area products were not used in the current study because of their inherent large uncertainties in our study region (e.g. Eva and Lambin 1998, Laris 2005). Instead, to facilitate the analysis of fire-related changes, the individual MODIS fire detections were coupled with the underlying land-cover dataset for the corresponding years. It should be noted that MODIS active fire products are also affected by appreciable uncertainty, especially fire omission due to cloud cover and limited sensitivity to smaller fires (e.g. Schroeder et al 2008a, 2008b), which are most prevalent in NSSA.
To facilitate the analysis of potential fire impacts on the water cycle, the relevant variables (FRP, precipitation, soil moisture, evapotranspiration, and NDVI) were analyzed on the basis of the monthly average intensity of each variable and their respective annual integrals or totals. For this part of the study, to avoid inconsistency in jointly analyzing FRP measurements from both Terra and Aqua with other variables, only the FRP acquired from Aqua (with a 1:30 PM local overpass time) were analyzed, as these were acquired closest to the diurnal time of peak burning in the study region (e.g. Ichoku et al 2008, Roberts et al 2009). The time span for the accumulation of the annual total for each variable was centered on its peak month and extends from one seasonal minimum to the next. Thus, precipitation annual total is accumulated from January to December, soil moisture February–January, evapotranspiration February–January, NDVI February–January, and fires August–July. These parameters were also separately analyzed only for the dry-season period (November to March) that encompasses the core of the burning activity in all of the NSSA sub-regional blocks. For each of these two categories (full-year and dry-season) inter-annual changes were determined for each of the water-cycle indicators (precipitation, soil moisture, evapotranspiration, and NDVI) and used to generate scatterplots against the afternoon FRE flux values for each of the sub-regional blocks in figure 3, and the associated correlation coefficients were derived. Furthermore, the monthly data, and their respective annual and dry-season integrals were used to generate various types of plots and analyses that provided the results discussed in section 4.
4. Results and discussion
4.1. Fire distribution and land-cover change dynamics
Time-series analysis of the fire activity (represented by FRE flux) during the period of study (2001–2014) showed appreciable progressive increase in the annual peak fire activity until 2006 (especially in the MC block of figure 3) and a steady decrease thereafter. Specifically, the average changes in the annual peak FRE flux (i.e. peak month values) from the 2006/07 season to the 2013/14 season were: NW (−4%/yr), NC (−4%/yr), NE (−7%/yr), MW (−7%/yr), MC (−5%/yr), ME (−2%/yr), SC (−7%/yr), and SE (−3%/yr). This is based on linear least squares fitting to peak month FRE-flux values of all the fire seasons during this period.
To explore possible spatial relationships between fire activity and land-cover dynamics, figure 4 shows the distribution of biomass burning activity and land-cover changes in NSSA during 2003–2013, using the MODIS active fire and land cover data products as described in section 3.2. This particular analysis starts in 2003 because it is the first year the MCD12Q1 product includes full-year input data sets from both the Terra and Aqua platforms, and it ends with the 2012-13 fire season since the last available MCD12Q1 product is for 2013. FRE flux analyses reveal high densities in the savanna/grassland/cropland areas (compare figure 4(a) to 3) and an overall decrease in fire activity since the 2006/07 fire season (figure 4(b)). Detailed analysis of the land-cover datasets show mutual exchanges between different types depending on year. For instance, at a given location, savanna may be converted to cropland in a given year, whereas the opposite happens in a different year. Thus, the coincidence between the areas of intense burning (figures 4(a) and (b) and those of overall land-cover change (figures 4(c), (d) is subtle but still somewhat perceptible. To simplify the interpretation of these complex land-cover change vectors, we focus on croplands, whose expansion is one of the major drivers of burning in NSSA (e.g. Andela and van der Werf 2014). Figures 4(e), (g) and (i) show the distribution of land-cover conversions from savanna, forest, and wetland, respectively to cropland, whereas figures 4(f), (h) and (j) show that these conversions have been on the increase during the last decade (comparing 2006 to 2012), in spite of the overall decreasing trend in burning (figure 4(b)). Table 1 shows a summary of the average annual land-cover changes relative to cropland, which constitutes 18.5% of the total NSSA land area on average. Indeed, croplands have been increasing, in agreement with past studies (e.g. Taylor et al 2002, Andela and van der Werf 2014), with an estimated net increase of ∼ 0.28%/yr of the total NSSA land area. The largest net conversions to cropland come from savannas (0.18%/yr ≈ 24 000 km2 yr−1) followed by grasslands (0.06%/yr ≈ 8000 km2 yr−1).
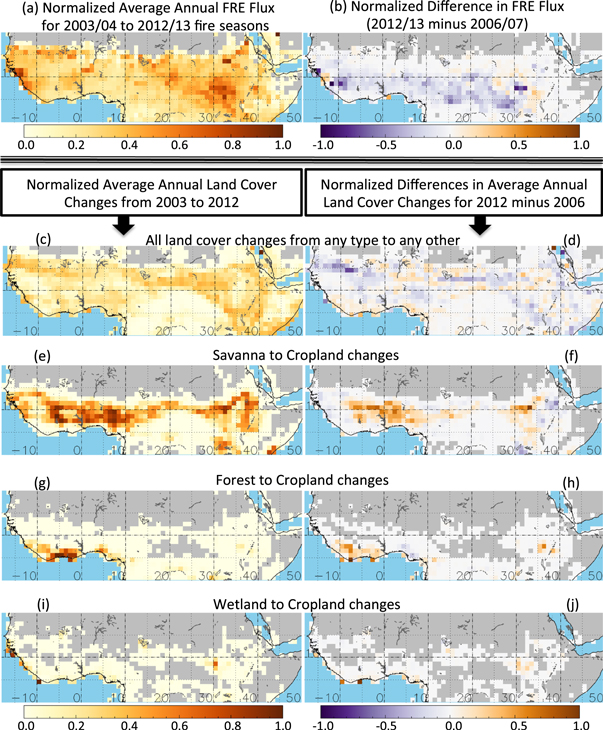
Figure 4. Multi-year (2003–2012) average distributions and changes of fire radiative energy (FRE) flux and land-cover types in the NSSA domain at 1° grid resolution. These analyses are based on MODIS data products: FRE flux from MOD14/MYD14 Collection 6 (fire products at 1 km resolution) and land-cover changes from MCD12Q1 Collection 5 (land cover type classifications at 0.5 km resolution). (a) Average annual FRE flux within each 1° grid, and (b) Difference (2012/13 minus 2006/07) of average annual FRE flux showing a net overall decrease in burning in most parts of NSSA, except in one part of the extreme west coast and some parts of East Africa. For the land-cover changes, the left panels (c), (e), (g) and (i) show the total, savanna-to-cropland, forest-to-cropland, and wetland-to-cropland changes, respectively, whereas the right panels (d), (f), (h) and (j) reflect their respective increase or decrease (2012 minus 2006). All values are linearly scaled from zero to the maximum value on each panel, whereas gray represents the background.
Download figure:
Standard image High-resolution imageTable 1. Summary of the average annual land-cover fraction and conversion rates (%/yr) to and from the cropland type over the period of 2003 to 2013 relative to the total NSSA land area, and the net increase in cropland.
| Land cover types | Fraction of total land | To cropland | From cropland | Net increase in cropland |
|---|---|---|---|---|
| (To—from) | ||||
| Forest | 10.2% | 0.18% | 0.18% | 0.00% |
| Shrubland | 8.2% | 0.29% | 0.28% | 0.02% |
| Savanna | 22.3% | 1.54% | 1.36% | 0.18% |
| Grassland | 12.1% | 1.46% | 1.40% | 0.06% |
| Wetland | 0.6% | 0.014% | 0.016% | 0.00% |
| Cropland | 18.5% | 15.24% | 15.24% | 0.00% |
| Barren | 28.0% | 0.081% | 0.064% | 0.02% |
| Totals | 99.9% | 3.6% | 3.3% | 0.28% |
Although it is not easy to show a one-to-one mapping of the cause-and-effect use of fire for land-cover conversion in a region as extensive as NSSA, this phenomenon is illustrated at a relatively perceptible scale using an annual sequence of land-cover maps interspersed by fire detections in the intervening dry seasons (figure 5) in an area near the center of NSSA (MC-figure 5 in figure 3). In this particular case, cropland increased in exchange for savanna from 2006 to 2009, after which it started decreasing and returning to savanna. Coincidentally, starting in the 2009/10 fire season, fire detection increased dramatically in a small patch of forest, which was practically decimated by 2013 and was slowly replaced by cropland and savanna. Similar change patterns were found in several other sampled areas, although these are not shown here for want of space.
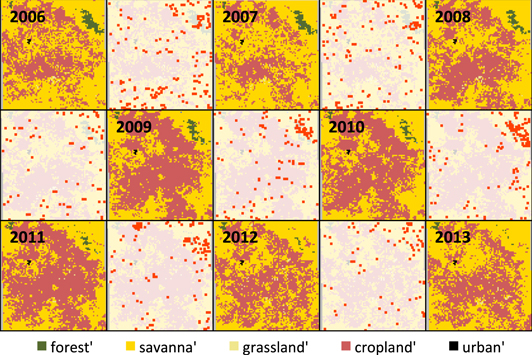
Figure 5. Annual sequence of land-cover distributions from 2006 to 2013 in a small area ('MC-figure 5' in figure 3) bounded by 6.74°–7.09°N, 11.02°–11.36°E. Between consecutive years, Terra- and Aqua-MODIS fire pixels (red dots) detected during the intervening fire seasons are highlighted over the significantly saturated land-cover panel of the leading year, to show the land covers potentially burning. Cropland density seems to increase from 2003 until 2009, after which it started decreasing slowly. A patch of forest can be seen near the top right corner of the panels during those years. However, starting in the 2009/2010 fire season, fire detection increased dramatically in that patch of forest, which was practically decimated by 2013 and slowly replaced by cropland and savanna.
Download figure:
Standard image High-resolution imageAn alarming aspect of these results, with particular relevance to water-cycle dynamics, is that, although the average fire activity across NSSA shows a net overall reduction (figure 4(b)), in some cases, there was an increase in the conversion of the more vulnerable land-cover types to cropland, namely forests (e.g. figure 4(h)) and wetlands (e.g. figure 4(j)). This may well be indicative of the indirect effects that these NSSA fires have on the regional water cycle through land cover change. The increasing conversion of the forest land-cover type (e.g. figure 4(h)) is indeed a concern because evergreen forests (as found in NSSA) perform excellent water conservation functions (e.g. Yang et al 1992), and the time it takes for a destroyed forest to grow back to its original state is much longer than for savanna or grassland. This is probably one of the major factors contributing to the significant forest loss observed in NSSA from Landsat (30 m resolution) data analysis for the 2000–2012 period (Hansen et al 2013). Similarly, wetland is a delicate biome that covers a relatively small percentage of the world's land surface area, and therefore its preservation is important.
In summary, land cover distribution is changing in NSSA, and our analysis support the hypothesis that the heavy and regular burning practices in NSSA can have a significant effect on the land-cover dynamics. While fires are overall decreasing in the major burning land cover types of savanna/grassland and cropland, certain parts show an increased impact on sensitive land cover types like forest or wetland, which might have some serious ecological and hydrological implications.
4.2. Potential relationships between biomass burning and the water cycle
The potential relationships of biomass burning activity to the water cycle has been explored by analyzing how changes in biomass burning relate to those of relevant water-cycle indicators, including soil moisture, NDVI, evapotranspiration, and precipitation. A general linear least squares regression analysis shows appreciable (mostly negative) correlation between inter-annual changes in annual average afternoon FRE flux and inter-annual changes in the annual averages or integrals of a set of water-cycle indicators in NSSA and its sub-regional blocks (figure 6(a)). Inter-annual changes are used as a way to minimize the effects of quantitative biases and uncertainties, which can vary substantially for certain water-cycle parameters depending on data source (e.g. Rodell et al 2011). Similar correlations between FRE flux and the water-cycle parameters were also calculated for the dry-season (set as November–March) when fires occur (figure 6(b)).
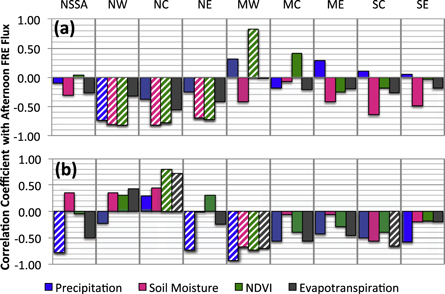
Figure 6. Correlation coefficients (r) between interannual changes in afternoon biomass burning (represented by year-to-year changes in annual average FRE flux derived from Aqua-MODIS FRP measurements at ∼1:30 PM local time overpass for 2001–2014) and those of certain indicators of the water cycle and environmental conditions for NSSA and its sub-regional blocks, both on the basis of: (a) integration or averaging through the full-year cycle and, (b) integration or averaging through only the dry-season (November–March). The striped bars indicate correlation coefficient values that are significant at the 95% confidence level. The data sources are: precipitation (TRMM–TMPA), soil moisture (ESA–CCI), NDVI (MODIS-Terra), and evapotranspiration (GLDAS).
Download figure:
Standard image High-resolution imageFor the full annual correlations (figure 6(a)), the inter-annual change in afternoon FRE flux from one year (August–July) to the next is paired with the inter-annual changes in the different water-cycle parameters between their respective pairs of the next closest annual cycles (January–December for precipitation and February–January for the other parameters). For example, the change of afternoon FRP flux from the August 2002–July 2003 season to the August 2003–July 2004 season is paired with the change of precipitation from the January–December 2003 season to the January–December 2004 season. This was done to ensure that changes in fire activity lead (with some overlap) those of precipitation, soil moisture, NDVI, and evapotranspiration, so as to establish a basis for the attribution of the changes in these water cycle parameters, at least in part, to the biomass burning effects. Most of the significant correlations are negative especially along the northern blocks (NW, NC, NE), suggesting that the more severe the fire season in these northern blocks, the more severe the decrease in these water-cycle indicators, particularly soil moisture and NDVI, in the following rainy season. The main exception is the MW block, where it would seem that the greater the change in seasonal mean afternoon FRE flux, the greater the change in the seasonal mean NDVI during the subsequent rainy season. This might be because much of the burning in this MW block seems to be for the conversion of savanna (and, to a lesser extent, forest) to cropland (figures 4(e)–(h)), thereby producing newer and perhaps overall greener vegetation than savanna.
On the other hand, when only the dry season (in this case, November–March) inter-annual changes in these water-cycle indicators are regressed against the concurrent inter-annual change in afternoon FRE flux, they all result in significant negative correlations in the MW block (figure 6(b)). There is a similar negative precipitation change correlation with afternoon FRE flux in the NE block and the NSSA overall. Worth noting also is the significant positive correlation of some of the water-cycle indicators (NDVI and evapotranspiration) against afternoon FRE flux during the dry season (figure 6(b)) in the NC block that contains Lake Chad (figure 3), suggesting that increase in burning coincides with increase in vegetation greenness and evapotranspiration, which is consistent with burning for irrigated agriculture during the dry season probably within the floodplains of Lake Chad and its tributaries, as indicated by the appreciable and relatively increased conversion of wetlands to croplands (figures 4(i) and (j)).
4.3. Biomass burning and the water cycle during the dry season
The potential link of biomass burning to the water cycle parameters during the dry (fire) season (November–March) is further explored in each NSSA sub-regional block by comparing the time-series of afternoon FRE flux against total precipitation and evapotranspiration for the same time period (figure 7). The MC block obviously shows the highest burn activity, with an apparent decrease over the last decade (figure 4(b)). Overall, it appears that blocks with relatively high burn activity (FRE flux >0.02 W m−2 i.e. MW and MC) show a much higher evapotranspiration over precipitation. However, with the exception of the northern blocks where there is little to no precipitation during the biomass-burning season, afternoon FRE flux appears to show some inverse relationships with the off-season precipitation and evapotranspiration in some blocks, of which the most prominent is the MW block (see also figure 6(b)), where some sharp peaks in burning coincide with sharp dips in dry-season precipitation and vice versa (figure 7).
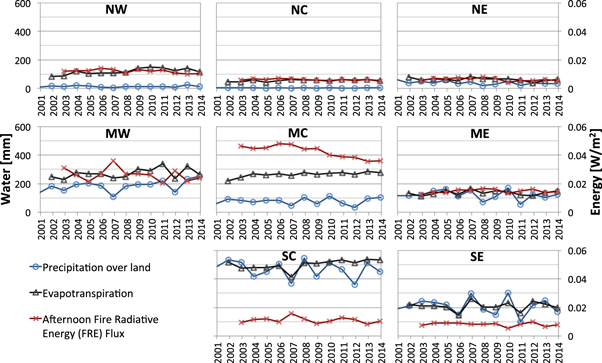
Figure 7. Time series of dry (fire) season (November–March) afternoon FRE flux from MODIS-Aqua, precipitation from TRMM, and evapotranspiration from GLDAS for the NSSA sub-regional blocks. The left Y-axis (Water (mm)) represents precipitation and evapotranspiration, whereas the right Y-axis (Energy (W m−2)) represents the FRE flux.
Download figure:
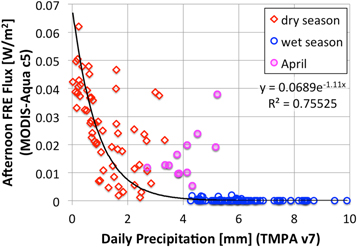
Standard image High-resolution imageTherefore, a concentrated effort focused on the MW block is pursued in an attempt to understand the interactions between the burning and water cycle better. A scatterplot of afternoon FRE flux against precipitation for the MW block shows that burning has indeed an inverse (albeit nonlinear) relationship with precipitation, but stops or becomes insignificant when the average monthly precipitation stays above 4 mm d−1 (figure 8). However, as the seasonal transition month in MW, April stands out with its points portraying a quasi-linear distribution suggestive of a positive correlation (figure 8), which could be indicative of precipitation enhancement due to biomass burning. This interpretation has substantial agreement with Huang et al (2009, figure 3) who found that aerosols (including both dust and smoke) in West Africa may be responsible for precipitation enhancement over land and suppression over ocean. The current study has gone a step further by isolating a possible biomass-burning enhancement of precipitation in humid West Africa (i.e. block MW) during the month of April.
Figure 8. MW block (see figure 3) scatterplot of afternoon FRE flux against precipitation showing the demarcation between the rainy (May–October) and dry (November–March) season to be ∼4 mm d−1, with the transition month of April standing out.
Download figure:
Standard image High-resolution image
These analyses suggest the need for a more detailed study of the mechanisms governing the biomass burning enhancement/suppression/delay of rainfall in NSSA. The potential effects of such mechanisms may include the lengthening of the dry season and increased perturbation of the seasonal precipitation patterns, whose human dimension is important, given the very high population density/growth in most of NSSA (e.g. Ezeh et al 2012). Chauvin et al (2012) reports that although agricultural production has been increasing slightly in SSA overall, it has certainly not kept up with the population increase, and that the per capita food consumption has been decreasing rather steadily since the 1970s with a slight increase during the 2000s. Detailed studies that can unravel these mechanisms will require strategic synergism between data analysis and a variety of modeling experiments.
5. Conclusions and outlook
The intense biomass burning activity across the NSSA region has significant implications for changes in the regional land cover, water cycle, and climate. This study has enabled a description of recent (2001–2014) variability in several important land-cover and water-cycle variables in relation to biomass burning, thereby offering some insights into their potential couplings. Starting in the 2006/2007 burning season through the end of the analyzed data in 2014, peak burn activity steadily decreased by 2–7%/year in different parts of the NSSA region. Incidentally, during the same period, in some cases, fire-related land-cover changes have increased in the more vulnerable land-cover types that were traditionally less burned, such as forests and wetlands. Although changes were also observed in precipitation, soil moisture, NDVI, and surface evapotranspiration in certain parts of the region, it is not easy to clearly establish a generalized cause-and-effect relationship between biomass burning and these hydrological cycle indicators mainly because of the difference in the seasonality between them.
However, based on precipitation data covering the period of 2001–2014, it is established that, during the rainy season, average monthly precipitation in humid West Africa (MW block) always exceeds 4 mm d−1. This value, if used for model parameterization, may have some implications on predicting how precipitation intensity and variability could affect or be affected by biomass burning in the future. Since precipitation itself is affected by atmospheric circulation, surface state, and aerosol loading through nonlinear physical processes (e.g. Pielke et al 2007), such conditions could eventually produce an adverse feedback to agricultural activities. Thus, if future monthly precipitation remains below 4 mm d−1 at the onset of the rainy season, it is possible that regional farmers could continue burning the biomass to prepare their farmland, with potentially severe implications for the regional water cycle and climate.
Although these results are quite appealing, further details of the time-lapse and sensitivity of the seasonal precipitation to fire-induced surface changes, energy release, and emissions in NSSA and its sub-regions are complex to elaborate based only on the data analysis performed here. Such processes need to be explored further using regional climate models and additional data sets, with a view to developing a comprehensive understanding of the phenomena and connections as laid out in the original conceptual framework (figure 2). Future effort should involve an extensive suite of modeling studies that will integrate observations. These should be simulations of 10 year or longer durations where a control simulation is compared with experimental runs with perturbed boundary conditions or perturbed forcing. Experiments should test the sensitivity of the circulation and precipitation patterns to: (i) land-cover-change and surface albedo perturbations due to biomass burning based on observations; (ii) lower tropospheric heating by smoke aerosol absorption; (iii) surface radiative cooling owing to aerosol scattering and absorption; (iv) perturbed cloud cover owing to aerosol modification of cloud amount; and (v) perturbed soil moisture based on observed variability. A key question that can be addressed through these experiments is how strong an impact each of these perturbations has on the circulation and rainfall compared to the established impact of perturbed SST patterns.
Acknowledgments
This research was fully funded by NASA under its Research Opportunities in Space and Earth Sciences (ROSES)—2009 and 2013 Interdisciplinary Studies (IDS) Program (Dr Jack Kaye, Earth Science Research Director) through the Radiation Sciences Program managed by Dr Hal Maring. We also appreciate the efforts of providers of the large diversity of data products used for this study from various satellite sensors and global models.