
Abstract
This study quantifies the effect of precipitation bias corrections on basin water balance calculations for the Yellow River Source region (YRS). We analyse long-term (1959–2001) monthly and yearly data of precipitation, runoff, and ERA-40 water budget variables and define a water balance regime. Basin precipitation, evapotranspiration and runoff are high in summer and low in winter. The basin water storage change is positive in summer and negative in winter. Monthly precipitation bias corrections, ranging from 2 to 16 mm, do not significantly alter the pattern of the seasonal water budget. The annual bias correction of precipitation is about 98 mm (19%); this increase leads to the same amount of evapotranspiration increase, since yearly runoff remains unchanged and the long-term storage change is assumed to be zero. Annual runoff and evapotranspiration coefficients change, due to precipitation bias corrections, from 0.33 and 0.67 to 0.28 and 0.72, respectively. These changes will impact the parameterization and calibration of land surface and hydrological models. The bias corrections of precipitation data also improve the relationship between annual precipitation and runoff.
Export citation and abstract BibTeX RIS
1. Introduction
Conceptually, visualizing a water balance at the watershed scale is a simple task. Realistically, it is quite difficult to produce an accurate numerical estimate from measurement of all the variables in the water balance equation (Kane and Yang 2004). Precipitation is the key variable in water budget calculations. Determination of the spatial and temporal distribution of precipitation has been a challenge for decades and is still a major challenge in our current efforts to quantify the water and energy cycle over the cold regions—the high elevation and high latitude regions (Woo and Steer 1979, Goodison and Yang 1995, Walsh et al 1998). It is well known that large biases exist in gauge precipitation data, and corrections for the biases are necessary in order to generate reliable regional and global precipitation datasets. Consistent bias correction methods have been developed from a World Meteorological Organization (WMO) intercomparison of national gauges (Yang et al 1995, Goodison et al 1998) and applied at regional to global scales (Metcalfe et al 1994, Førland et al 1996, Yang et al 1998, Yang 1999, Yang et al 2005, Adam and Lettenmaier 2003). The corrections result in higher monthly and yearly precipitation than have been previously reported. For instance, Legates and Willmott (1990) and Adam and Lettenmaier (2003) report an increase in mean annual global terrestrial precipitation of 11% due to the corrections.
Recently, Ye et al (2004, 2007) carried out bias corrections of precipitation data over China and reported an approximately 16% increase in mean yearly precipitation during 1951–2004. Ding et al (2007) compared the precipitation changes between the measured and corrected data over China during 1951–98 and found that bias corrections increased monthly precipitation trends in every month by about 7–18%, leading to an 8% overall enhancement of yearly precipitation trends over China (Ding et al 2007). The impact of bias corrections on trends depended on the gauge catch efficiency and changes of wind speed, temperature, snow percentage, and the number of trace and measurable precipitation days. Wind speed is the most important factor. For instance, wind speed decreases in East China led to increases in gauge catch and reduced overestimation of the yearly precipitation trend. Wind speed increases in most of West China caused decreases in gauge catch and a greater underestimation of precipitation trend (Ding et al 2007). Over the Yellow River Source region (YRS) during 1959–2001, the total linear trends are − 15 mm for the measured precipitation, and − 20 mm for the corrected precipitation. The trend difference is mostly due to the wind speed decrease over the YRS.
The bias-corrected precipitation dataset for China (Ye et al 2004, 2007) has been used to assess the correspondence between precipitation products from atmospheric reanalysis (ERA-40, NCEP-1 and NCEP-2), the merged precipitation datasets (CMAP-1 and CMAP-2), and the Global Precipitation Climatology Project Version 2 (GPCP-2) (Ma et al 2009). In general, CMAP-1 and GPCP-2 agree more closely with the bias-corrected precipitation than the reanalysis products do. The ERA-40 precipitation agrees more closely with the corrected precipitation than the NCEP data, although the ERA-40 annual mean precipitation across China is lower by about 12% than the corrected precipitation (Ma et al 2009).
Yang et al (2005) applied the WMO bias correction procedure at more than 4000 stations over the high-latitude regions (north of 45°N) and quantified the measurement biases. These corrections have increased the gauge-measured monthly precipitation significantly, by up to 5–22 mm for summer and winter months. They also found that bias corrections generally enhance monthly precipitation trends by 5–20%. They recommend reviewing the current understanding of the fresh water budget and its change over high latitudes. Tian et al (2007) forced the Community Land Model version 3 with the observed and corrected precipitation data (Yang et al 2005) over the northern regions (north of 45°N) during 1973–2004. Their results show that bias corrections increase model snowfall and snow accumulation, which in turn increase spring runoff and annual streamflow for most major rivers in the northern latitudes.
There are also biases in rainfall observations by gauges. A pit gauge (level with a ground surface) is the reference for rainfall intercomparison by WMO (Sevruk and Hamon 1984). The double-fence intercomparison reference (DFIR), being the standard for snow intercomparison, can also measure the true rainfall. Using the DFIR data, the bias correction methods have been derived for many national precipitation gauges, including the Chinese gauge. Precipitation bias corrections also improve the model simulation of mean annual cycle and temporal variations of streamflow for the major northern rivers. They conclude that it is important to use bias-corrected precipitation in terrestrial water balance analyses and land surface models.
Many studies have addressed the reasons for runoff drop, mostly focussing on climatic changes, especially on the variations of precipitation and surface air temperature in the YRS (e.g. Zhou and Huang 2012, 2006, Yang et al 2011, Li et al 2004, Liu and Chang 2005, Chen et al 2007, Lan et al 2010). More efforts are necessary to examine the impact of precipitation bias corrections for regional hydrological analyses. This paper presents the results of a case study over the YRS in west China. We determine the effect of the precipitation bias correction on water budget calculation and discuss its impact on the energy cycle. Using long-term (1959–2001) measured and corrected precipitation, discharge and evapotranspiration data, we define the basin scale water balance, including basin water storage change over the seasons. We also assess the water budget components from the ERA-40 reanalysis. The methods and results of this study are useful for large-scale water balance analyses, particularly over the cold regions.
2. Basin description, data, and methods
The YRS is located in the region between 95°50'45''E/103°28'9''E and 32°12'11''/35°48'7''N. The Tangnaihai station is the control station in the YRS with about 121 972 km2 of drainage area (15% of the whole Yellow River basin) (figure 1). The basin is in the Northeast Tibet Plateau with a high elevation, between 3480 and 4680 m a.s.l. There are only grazing activities; the catchments can be regarded as unimpaired, with limited human activities. Grassland covers almost 80% of the region, and the total area of lakes and swamps is about 2000 km2 (Zheng et al 2009). Annual average temperature varies between − 4 and 2 °C from northwest to southeast. The annual precipitation is about 502 mm, of which 75–90% falls in the wet season (June–September) due to the southwest monsoon from the Bay of Bengal (Zheng et al 2009). Precipitation decreases from southeast (800 mm) to northwest (300 mm) in the YRS. Snowpack and glaciers are present in the basin. The glacier coverage is about 0.16%, with the discharge contribution being less than 1% of the annual flow (Yang 1991). The annual average runoff is 20 km3 at the Tangnaihai station and contributes over 35% of the total flow of the Yellow River.

Figure 1. A basin map showing the hydrological and meteorological station distribution and elevation information over the region.
Download figure:
Standard imageWe use long-term climatic and hydrological data for this study. The monthly precipitation data have been generated from the daily precipitation data obtained from the China Meteorological Administration. Bias-corrected monthly precipitation data have been produced by Ye et al (2004, 2007) for the 1951–2004 period. The monthly discharge data at the Tangnaihai hydrologic station during 1958–2004 have been obtained from the Yellow River Conservancy Commission. The ERA-40 monthly surface reanalysis, i.e. precipitation, evapotranspiration and runoff data from September 1957 through August 2002, have been obtained from NCAR (http://dss.ucar.edu/datasets/ds119.0/). The reanalysis model's N80 grid has a spatial resolution of about 125 km, which corresponds to approximately 1.125° on the equator (Kallberg et al 2004). ERA-40 precipitation output consists of both rainfall and snowfall (Betts and Beljaars 2003), and the convective and large-scale precipitation are added to produce the total precipitation. Seasonal and annual precipitation data are calculated as for the observational data. Although there are slight time discrepancies between the original six-hourly GMT ERA-40 precipitation output used to calculate monthly data and the local-time measurements in China, these discrepancies can be neglected, since we mainly focus on monthly, seasonal and annual timescales (Ma et al 2009). The evapotranspiration and runoff data from ERA-40 have also been used in this study. ERA-40 data agree more closely with bias-corrected precipitation than NCEP reanalysis precipitation (Ma et al 2009).
The bias corrections for precipitation data over China included wind-induced undercatch, an accounting of trace amounts of precipitation, and wetting loss. Based on the experimental observations in the Urumqi River basin (Yang 1991, 1988), the trace precipitation was corrected on a daily basis in Ye et al (2004); for example, for any given trace day, regardless of the number of the trace observations reported, a value of 0.10 mm was assigned and added to the monthly total. The wetting loss of the Chinese standard precipitation gauge (CSPG) per observation was 0.23 mm for rainfall measurement, and 0.30 and 0.29 mm for snow and mixed precipitation, respectively. The relation of catch ratio as a function of wind speed has been developed for the CSPG (Yang 1991). It was found in the WMO experiment that wind speed was the most important factor determining gauge catch, when precipitation was classified into snow, mixed precipitation, and rain. The results of daily gauge catch ratio (CR; per cent) versus daily mean wind speed (Ws; metres per second) at 10 m height are presented below for snow and rain precipitation:


Gridded data are necessary for basin water budget analyses and calculations. The measured and bias-corrected monthly precipitation data have been interpolated to 1 km × 1 km-grid data using the inverse-distance interpolation. The ERA-40 monthly precipitation (Pe), evapotranspiration (Ee) and runoff (Re) data are generated directly from the N80-grid data. We determine the water budget element for the basin on monthly and annual timescales, i.e.

where R is runoff, P is precipitation, E is evapotranspiration and Wsc is the water storage change over the basin. In this study, Wsc was considered as zero for the long period, i.e.

The annual long-term mean evapotranspiration can be estimated from equation (4).
3. Results
3.1. Annual water budget
To determine the effects of precipitation bias corrections on basin hydrology, we calculate the water balance for the YRS. We use the long-term data to quantify the mean water balance components during 1959–2001 (table 1). The basin mean annual gauge-measured precipitation (Pm) is about 502 mm, and the annual runoff from the discharge data is 167 mm. The long-term mean P–R can be closely considered as the basin mean evapotranspiration (ET), i.e. about 335 mm.
Table 1. The long-term mean annual water balance for the Yellow River Source region, 1958–2001.
| Dataset | Precipitation (mm) | Precipitation difference (%) | Runoff (mm) | Runoff coefficient (R/P) | Evapotranspiration (P–R) (mm) | Evapotranspiration difference (%) | Evapotranspiration coefficient (E/P) |
|---|---|---|---|---|---|---|---|
| Measured | 502.4 | 0 | 167.3 | 0.33 | 335.1 | 0 | 0.67 |
| Corrected | 599.9 | 19 | 0.28 | 432.6 | 29 | 0.72 | |
| ERA-40 | 537.2 | 7 | 171.5 | 0.32 | 365.8 | 9 | 0.68 |
The bias-corrected annual precipitation (Pc) is about 600 mm, which is 98 mm (or 19%) higher (increase) than Pm. The annual runoff remains the same (167 mm). The evapotranspiration, thus, is about 433 mm, which is 29% higher than the ET calculated from precipitation uncorrected data. This means that precipitation corrections of 98 mm lead to the same amount of evapotranspiration change, since runoff is fixed in the water balance calculation. In other words, basin ET is significantly underestimated due to the biases in precipitation observations.
It is important to note that precipitation bias corrections of about 19% result in a relative underestimation of the evapotranspiration of up to 29%. This means the bias corrections of precipitation directly lead to the same amount of basin evapotranspiration increase, but higher relative change in basin ET. Furthermore, underestimation of basin evapotranspiration suggests the surface latent heat flux has been strongly underestimated. This result indicates the evapotranspiration as a local water cycle component and surface latent heat flux has been underestimated over the basin due to biases in the precipitation data used for water budget analyses.
The ERA-40 precipitation is 537 mm for the YRS, 7% higher than the Pm, and 10% lower than Pc. The ERA-40 precipitation validation over land used the gridded observational datasets of gauge measurements (Betts and Beljaars 2003). The ERA-40 mean runoff is 171 mm for the YRS, only 4 mm different from the streamflow observation. This result is very similar to the Mackenzie River basin, where Betts and Ball (2003) found the ERA-40 annual runoff is comparable to the annual streamflow. The annual evapotranspiration from the ERA-40 is 366 mm for the basin, underestimated by 16% compared to the bias correction result and overestimated by 9% relative to the result from the measured precipitation. The discrepancy is mainly from the precipitation difference due to very close runoff between ERA-40 and the discharge measurement. The annual evapotranspiration bias from ERA-40 for the YRS is smaller than the overestimate of 30% in the Mackenzie River basin with bias-corrected precipitation (Betts and Ball 2003).
Bias corrections of precipitation affect the hydrological parameters. For instance, the annual mean runoff coefficient (R/P) changes from 0.33 to 0.28 for the measured and corrected precipitation. This result implies that the hydrological and meteorological parameters related to water balance components should be adjusted when using the corrected precipitation data. The ERA-40 data have a runoff coefficient of 0.32, very close to the result from the Pc data. Because of the dry climate over this region, the runoff ratio is low for the YRS, while the evapotranspiration coefficient (E/P) is high, about 67–72%.
3.2. Monthly water balance
Similar to annual precipitation data, the monthly basin mean precipitation for the YRS was generated from the dataset by Ye et al (2004, 2007) (figure 2). The monthly measured precipitation (Pm) over the basin varies from 2 mm in winter to 102 mm for summer, while the corrected precipitation (Pc) ranges from 4 to 118 mm. The monthly corrections are about 13–16 mm in summer and 2–3 mm in winter, or increases of 15–17% in summer and 57–63% for winter. The ERA-40 monthly precipitation (Pe) varies from 5–13 mm in the winter months (December–February) to 75–88 mm in the summer. The measured, corrected and ERA-40 monthly precipitation has very similar behaviour, with summer high and winter low. The Pc is higher than Pe by 17–32 mm (16–27%) for June–September and lower by about 2–10 mm (2–61%) during October–May. The underestimation of summer precipitation is the main reason for the ERA-40 annual mean precipitation being 10% less than the Pc (table 1). ERA-40 precipitation exhibits a pronounced seasonal cycle, although weaker than the seasonal cycle seen in the observations, for instance, the ERA-40 precipitation peaks in June, while the Pc is highest in July. Ma et al (2009) report that over China the ERA-40 precipitation is more consistent with the corrected precipitation in summer months than in winter. The standard deviation of precipitation difference between ERA-40 and the corrected precipitation ranges from 10% in summer to 23% in winter (Ma et al 2009).

Figure 2. The monthly basin mean measured (Pm), corrected (Pc), ERA-40 (Pe) precipitation and correction factor (CF) during 1958–2001.
Download figure:
Standard imageIn order to determine the effect of precipitation bias corrections on the seasonal water cycle, we use the measured and corrected precipitation for water balance calculations over the basin. Basin mean evapotranspiration usually cannot be directly measured. The long-term mean yearly ET has been determined in the annual water balance calculation according to equation (4) (table 1). Monthly ET values are needed for this analysis. The ERA-40 dataset contains the 6-hourly evapotranspiration information, allowing us to estimate the monthly and annual ET. Comparisons of the yearly ET data show similar results between the ERA-40 and annual water balance approach. To quantify the seasonal ET distribution, we calculate the ratios of monthly versus yearly ERA-40 ET to determine the scaling factors for each month. We then apply the monthly scaling factors to the annual ET from the water balance to estimate the monthly ET over the basin.
Figure 3 shows the monthly result for the measured precipitation data. Monthly runoff is about 4–5 mm for January–March, 8–13 mm from a weak snowmelt in April–May, and 19–29 mm during June–September. The highest runoff occurs in July, due to maximum precipitation. Runoff has twin peaks, with the highest peak (about 29 mm) in July and the second peak (about 26 mm) in September, particularly during the higher flow years (Han et al 2004). The runoff regime is related to the precipitation regime. Our data show only one precipitation peak on the basin scale, however, other studies report two precipitation peaks in the southeast part of the basin, usually occurring in a high precipitation year (Niu and Pei 2009, Tang et al 2008).
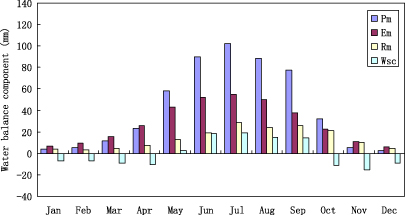
Figure 3. Basin mean monthly precipitation (gauge-measured data, Pm), runoff (R), evapotranspiration (E) and basin water storage change (Wsc) during 1958–2001.
Download figure:
Standard imageThe basin long-term mean monthly precipitation has only one peak. There exists large interannual variation in monthly precipitation, including the amount and timing of the peak precipitation. There is usually one precipitation peak; there are sometimes two peaks in the high precipitation years, with the maximum peak in July and the second peak in September (figure 4).
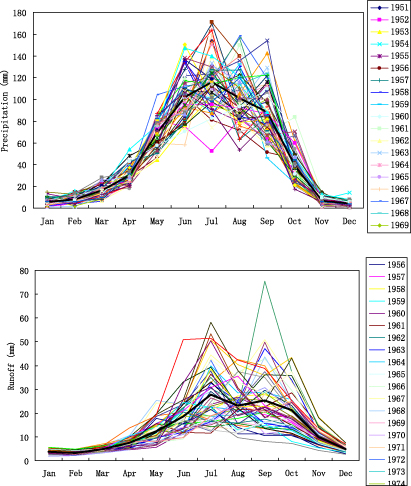
Figure 4. The monthly precipitation and runoff at the YRS during 1959–2001 with long-term mean precipitation and runoff (thick line).
Download figure:
Standard imageThe long-term mean monthly runoff has two peaks, with the maximum peak in June and second peak in September. Similar to precipitation, the twin peaks of runoff often occurred in high flow years (Han et al 2004) (figure 4). The interannual variation in precipitation is the reason for these two flow peaks.
It is important to discuss the relationship between the water balance components. Relative to Pm, runoff is smaller in most months, except for November and December. Monthly ET is greater than Pm for November–April and less than Pm during May–October. ET is almost 100% higher than runoff for every month, indicating dry climatic conditions over this region. Results of the land surface model also show higher evapotranspiration than precipitation in winter, and most summer precipitation going to evapotranspiration for this region (Yang et al 2011), thus leading to a low runoff ratio for the basin (Yang et al 2009).
Since the monthly P, R and ET have been determined, it is possible to estimate the monthly water storage change (Wsc = P − R − ET) over the basin. The results show negative Wsc ( − 7 to − 16 mm) from October to April, and positive Wsc (3–19 mm) during May–September. This indicates that the basin gains water storage from May–September, mainly through precipitation, and loses water storage during October–April, through discharge and evapotranspiration. Winter is dry in this region, with low snow accumulation and a discontinuous snow cover (Che and Li 2005, Che et al 2008), water loss through runoff and evapotranspiration is much higher than winter snowfall. Snowmelt during April and May contributes to about 43% spring runoff (or 6% of annual flow) (Li et al 2009).
Figure 5 shows the water balance result for the corrected precipitation (Pc). Monthly Pc ranges from 4 to 118 mm, with the maximum in July. Monthly runoff, derived from the observed discharge, remains the same as in figure 3. Monthly evapotranspiration has been defined using the scaling factors and the yearly total ET derived from the annual water budget for the corrected precipitation. It varied from 8–12 mm in winter months to 65–70 mm over the summer season. The basin water storage change is negative ( − 7 to − 17 mm) from October to April and positive (3–19 mm) during May–September. Relative to the Pc, runoff is 3–89 mm lower for January–October and 1–3 mm greater during November–December. Monthly ET is 3–6 mm greater than Pc for November–April, this indicates the snowfall in winter months almost sublimated. During May–October, ET is 10–47 mm less than Pc; it is however 100% higher than runoff for every month of the year, i.e. a high annual evapotranspiration ratio, thus leading to low runoff ratio in this dry region.

Figure 5. The long-term mean basin monthly precipitation (bias-corrected, Pc), runoff (R), evapotranspiration (E) and basin water storage change (Wsc), 1958–2001.
Download figure:
Standard imageComparisons of results between figures 3 and 5 quantify the effect of precipitation bias corrections. It is clear that, as a percentage, the differences between Pc and Pm are greater in the cold season due to the low catch ratio for snow. But in an absolute sense these differences are greater in the warm season due to the large amount of precipitation. Runoff stays the same. Monthly ET is enhanced by about 2–15 mm due to precipitation change from the bias corrections. The monthly basin water storage change is very similar (difference about 1 mm) between the corrected and measured precipitation data. In summary, precipitation bias corrections did not change the seasonal pattern of precipitation and evapotranspiration much, thus the basin water storage regime remains more or less the same. Bias corrections of precipitation data enlarge the evapotranspiration ratio and reduce the runoff ratio in summer months. The evapotranspiration ratios during May to October are 0.54–0.78 for the corrected and 0.48–0.73 for the measured precipitation data.
Figure 6 shows the water budget results from ERA-40. Monthly precipitation ranges from 4 to 118 mm, while runoff varies between 18 and 28 mm during June–October and 4–6 mm during January–March, with the maximum in July and the minimum in February. The ERA-40 simulation is smaller by 0.4–3.5 mm (3–35%) from March to July and September, and higher by 0.8–4.5 mm (10–78%) in fall and winter months, than the basin runoff. This overestimate of runoff from October to March may be caused by the higher ERA-40 precipitation (figure 2) and a slow recession of runoff in late fall (October and November). Although ERA-40 correctly simulates the runoff regime—high flow in summer and low in winter—its snowmelt runoff is late by one month and the runoff misses the secondary peak in September when compared with the measured runoff.
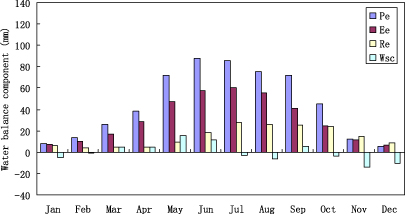
Figure 6. Basin monthly mean precipitation (Pe), runoff (R), evapotranspiration (E) and basin water storage change (Wsc) for the ERA-40 dataset, 1958–2001.
Download figure:
Standard imageThe ERA-40 monthly evapotranspiration changes from 7 to 10 mm in winter months to 55–60 mm in the summer season. It is smaller, relative to the ET from the Pc data, by 7–10 mm for May–September and 1–8 mm from October to April. The monthly ET has a similar regime, since the monthly ET for the corrected precipitation data has been derived from the annual evapotranspiration and the monthly distribution factor from ERA-40 monthly and annual ET. The basin Wsc is negative ( − 4 to − 11 mm) from October to January, and for July and August (about − 3 and − 6 mm respectively); and is positive (4–15 mm) for other months. The maximum Wsc occurs in May, while the maximum precipitation and runoff are in June and July, respectively. The pattern of the ERA-40 Wsc is different from the results in figure 5, where the maximum Wsc occurs in July, coinciding with the highest precipitation. This discrepancy may be caused by the difference in precipitation and runoff regimes between the ERA-40 and Pc.
3.3. Relationship between annual precipitation and runoff
The annual runoff at the YRS varies from 87 to 267 mm, with the average of 167 mm. The measured and corrected annual precipitation ranges are 338–616 mm and 436–732 mm, respectively. Statistical analyses between annual precipitation and discharge generally show a positive relationship, i.e. years with higher precipitation having higher discharge. Bias correction of precipitation data may affect the relationship between runoff and precipitation over watersheds. To quantify this relation, figure 7 displays the scatter plot and regression of annual runoff versus precipitation for the YRS. It is clear that the relationship becomes slightly stronger due to the bias corrections of the precipitation record. The R2 changes from 0.72 to 0.74. This result indirectly supports that the bias corrections generate more reliable precipitation data for this river basin. Because of significant changes in precipitation due to bias corrections, it is necessary to re-examine the runoff–precipitation relationship for other river basins in the cold and dry regions.
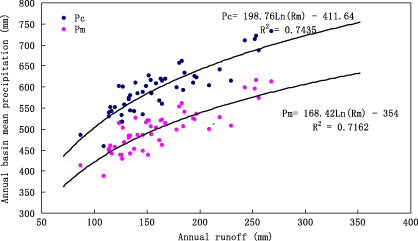
Figure 7. Scatter plot and regression between annual precipitation (Pm and Pc) and runoff (R), 1956–2004.
Download figure:
Standard image4. Discussion
All water balance components have uncertainties. It is therefore difficult to completely close the water budget calculations, particularly for the cold regions (Kane and Yang 2004). It is necessary to document and discuss the accuracy of water balance results for regional and basin studies. According to the hydrological measurement standards (Ministry of Water Resources 2000), the accuracy of discharge measurements in China is about 96% for high discharge and 92% for low discharge, with the annual discharge accuracy being around 94%. This accuracy is adequate for our water balance analysis over the YRS.
In this study, precipitation measurements have been corrected for biases and their accuracy has been significantly improved. However, precipitation has a large spatial variation over the regions, ranging from 311 mm in the west to 750 mm in the east of the YRS. The annual cycle of precipitation has large interannual variations, with the monthly maximum occurring from June to September. Uncertainty also exists in the determination of basin mean precipitation values from the station data. This uncertainty is difficult to quantify, mainly due to the sparsity of stations over the basin.
Climate has warmed over this region and precipitation has decreased slightly. These changes may affect snow cover and snowmelt processes over the basin. Winter is dry in this region, with about 41 mm total precipitation from November to March. Snow accumulation is low, with 45 mm of the maximum mean snow depth between January and February during 1980–2006 (Zhou et al 2012) and a discontinuous snow cover (Che and Li 2005). Snowmelt during April and May contributes to about 43% spring runoff (or 6% of annual flow) (Li et al 2009). Basin water loss through runoff and evapotranspiration is much higher than winter snowfall. Snow cover has slightly increased in the YRS (Qin et al 2006) and this change may not affect much of the basin storage.
The basin evapotranspiration cannot be directly measured and it is often calculated by model (e.g. Oudin et al 2005a, 2005b). There are uncertainties in estimating ET at any observed sites. Similar to basin mean precipitation estimation, basin evapotranspiration determination from station to basin scale has uncertainties. Relative to other approaches, the estimation of long-term mean basin evapotranspiration by the water balance method is more practical. Given the long-term data and weak climate change over this region, the key results from the water balance analysis are reliable and useful for hydro-climate investigations in the cold region. More effects are needed in future to improve the analyses and data quality.
The basin annual precipitation (Pm and Pc) has weakly decreased by about 15 and 19.6 mm (about − 3.1% and − 3.3%) during 1959–2001, respectively, and the annual temperature warmed by 0.9 °C (figure 8). On the other hand, annual runoff slightly decreases by 26.9 mm during the study period (figure 9). We also examined the records of Pm–R and Pc–R, and found an insignificant increase of 26 mm and 11 mm (1.7% and 3.4%), respectively, in study period (figure 8).
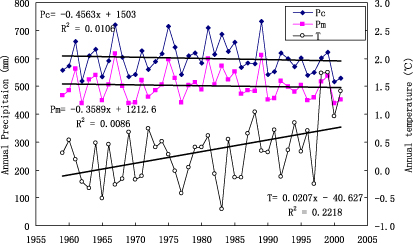
Figure 8. The annual basin Pm, Pc and temperature (t) in the YRS during 1959–2001.
Download figure:
Standard image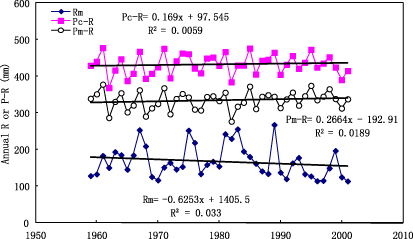
Figure 9. The annual runoff, Pc–R and Pm–R in the YRS during 1959–2001.
Download figure:
Standard imageET information is needed in order to determine the Wsc from the P–R data. An improved land surface model (Yang et al 2009, 2011) produced basin ET time series for the YRS using the measured precipitation data, and trend analysis indicates a significant ET increase by 7.5 mm/decade during 1960–2006 (Zhou and Huang 2012).
It is possible to estimate the Wsc trend based on the trends of P–R and ET. The ET trend was 7.5 mm/decade for the period 1960–2006. Use this rate, we estimate the ET change during 1959–2001 to be 32 mm. Given this, the Wsc trend should be a slight decrease of about 6 mm during 1959–2001, i.e. the 26 mm trend in Pm–R minus the 32 mm trend in ET. This weak decrease in basin Wsc is consistent with a winter runoff drop of 0.5 mm, because winter flow comes mainly from basin storage in the cold regions, such as the YRS (figure 10). Since the Wsc trend is very small, it is reasonable to assume no major water storage change over the study period. Out future efforts will explore other methods to quantify basin storage, such as the GRACE data and land surface modelling.
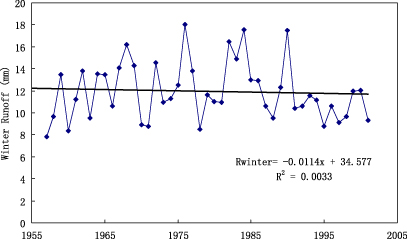
Figure 10. The winter runoff from December to February in the YRS during 1959–2001.
Download figure:
Standard imageTo understand the effect of precipitation bias correction on evapotranspiration estimation, the relative evapotranspiration difference (ΔRE) caused by precipitation changes is derived:
where Ec, Em, Pm, Pc and R have been defined previously,  is the the runoff coefficient.
  is the bias-corrected factor (CF). Equation (5) indicates that the relative difference of evapotranspiration change due to the bias corrections of precipitation depends on the CF and αm, and helps to determine the effect of precipitation bias correction on evapotranspiration estimation. That the relative (i.e., %) increase in P is less than the relative increase in ET simply reflects that ET also depends on R. The difference of the relative (i.e., %) increase in P and ET depends on the runoff ratio. The difference would become small for a small runoff ratio.
Kane and Yang (2004) report high runoff ratios of 0.5–0.8 for the arctic rivers. The CF for the Siberian regions range from 10 to 65%, with total yearly corrections of 30–330 mm (Yang and Ohata 2001). This may suggest that the annual evapotranspiration has been underestimated by 30–330 mm, while the ΔRE should be 20–300% in the arctic regions. This result indicates that the intensity of the water cycle (precipitation and evapotranspiration) has been significantly underestimated for the northern regions. More attention is needed, therefore, to determine the impact of bias corrections to basin evapotranspiration change in other regions with higher αm and CF.
5. Conclusions
Bias corrections of precipitation substantially increase the annual precipitation amount over the cold regions. This study examines and quantifies the effect of precipitation bias corrections on basin water balance calculations for the Yellow River Source region. We analyse long-term (1959–2001) monthly and yearly data of measured and corrected precipitation, runoff and ERA-40 water budget variables (including evapotranspiration and water storage changes) and define the water balance regime and its change.
Basin precipitation, evapotranspiration and runoff are high in summer and low in winter. Monthly precipitation ranges from 4 to 8 mm for winter to 102–118 mm for summer, and runoff varies between 3 and 5 mm for winter to 19–29 mm for summer. Monthly ET ranges from 8 to 12 mm in winter to 65–70 mm over the summer, which has been enhanced by about 2–3 mm for winter months and 14–15 mm for summer months due to the precipitation change from the bias corrections. The ERA-40 monthly ET, 7–10 mm in winter to 55–60 mm in summer, is lower relative to the results of the monthly water budget calculation. The monthly basin water storage change is very similar between the corrected and measured precipitation data, it is negative ( − 7 to − 17 mm) from October to April and positive (3–19 mm) from May to September.
Monthly precipitation corrections, ranging from 13 to 16 mm in summer and from 2 to 3 mm in winter, or increases of 15–17% in summer and 57–63% for winter, do not significantly alter the pattern of the seasonal water budget. The basin water storage change over the season remains more or less the same regardless of the precipitation change. Bias corrections, however, enlarge the evapotranspiration ratio and reduce the runoff ratio in summer months from May to October.
The ERA-40 water budget components are useful for regional hydrologic analyses. The ERA-40 precipitation exhibits a pronounced seasonal cycle; it is weaker than the seasonal cycle seen in observations, with a peak in June, while the Pc is highest in July. The annual evapotranspiration from ERA-40 is underestimated by 16% relative to the result from the basin water budget calculation. The ERA-40 runoff is underestimated from March to July and September, and overestimated in fall and winter months.
Annual mean bias correction of precipitation is about 98 mm (19% yearly total); this increase leads to same amount of basin annual evapotranspiration increase, since yearly runoff remains unchanged and the long-term storage change is assumed to be zero. The underestimation in precipitation and evapotranspiration suggests that the intensity of the water cycle in the YRS region will be underestimated when using uncorrected measured precipitation for water budget analysis. Bias corrections also alter important hydrologic parameters, such as the annual runoff and evapotranspiration coefficients, both change, from 0.33 and 0.67 to 0.28 and 0.72, respectively. These changes may impact the parameterization and calibration of land surface and hydrological models.
Further research is needed to document the annual water storage changes in the region because (a) historically the YRS land cover has varied dramatically (Qian et al 2006) and (b) the ongoing climatic change has already affected the lake levels in or near the YRS (Yi et al 2010).
Acknowledgments
This study was supported by the Global Change Research Program of China (2010CB951404), Hundred-Talent project and USA NSF grants 0230083, 0612334 and 0335941.