
Abstract
Methane emissions from manure management represent an important mitigation opportunity, yet emission quantification methods remain crude and do not contain adequate detail to capture changes in agricultural practices that may influence emissions. Using the Canadian emission inventory methodology as an example, this letter explores three key aspects for improving emission quantification: (i) obtaining emission measurements to improve and validate emission model estimates, (ii) obtaining more useful activity data, and (iii) developing a methane emission model that uses the available farm management activity data. In Canada, national surveys to collect manure management data have been inconsistent and not designed to provide quantitative data. Thus, the inventory has not been able to accurately capture changes in management systems even between manure stored as solid versus liquid. To address this, we re-analyzed four farm management surveys from the past decade and quantified the significant change in manure management which can be linked to the annual agricultural survey to create a continuous time series. In the dairy industry of one province, for example, the percentage of manure stored as liquid increased by 300% between 1991 and 2006, which greatly affects the methane emission estimates. Methane emissions are greatest from liquid manure, but vary by an order of magnitude depending on how the liquid manure is managed. Even if more complete activity data are collected on manure storage systems, default Intergovernmental Panel on Climate Change (IPCC) guidance does not adequately capture the impacts of management decisions to reflect variation among farms and regions in inventory calculations. We propose a model that stays within the IPCC framework but would be more responsive to farm management by generating a matrix of methane conversion factors (MCFs) that account for key factors known to affect methane emissions: temperature, retention time and inoculum. This MCF matrix would be populated using a mechanistic emission model verified with on-farm emission measurements. Implementation of these MCF values will require re-analysis of farm surveys to quantify liquid manure emptying frequency and timing, and will rely on the continued collection of this activity data in the future. For model development and validation, emission measurement campaigns will be needed on representative farms over at least one full year, or manure management cycle (whichever is longer). The proposed approach described in this letter is long-term, but is required to establish baseline data for emissions from manure management systems. With these improvements, the manure management emission inventory will become more responsive to the changing practices on Canadian livestock farms.
Export citation and abstract BibTeX RIS

Content from this work may be used under the terms of the Creative Commons Attribution 3.0 licence. Any further distribution of this work must maintain attribution to the author(s) and the title of the work, journal citation and DOI.
List of abbreviations
| B0 | Maximum methane production potential |
| EF | Emission factor |
| FEMS | Farm environmental management survey |
| FS | Farm size |
| FSC | Farm size where change from one manure management to another occurs |
| GHG | Greenhouse gas |
| FIMS | Farm inputs management survey |
| IPCC | Intergovernmental panel on climate change |
| LFPS | Livestock farm practices survey |
| MCF | Methane conversion factor |
| MDP | Management and design practices factor |
| MS | Manure management system distribution factor |
| UNFCCC | United Nations Framework Convention on Climate Change |
| VS | Volatile solids |
1. Introduction
The potential for reducing emissions from manure management is large—between 25 and 80% using appropriate management and treatment (Cole et al 1997)—and mitigation strategies at the manure management stage do not affect animal productivity. However, without details on storage practices and accurate emission quantification methodology it is not possible to quantify potential emission reductions due to changes in farm management.
Production of CH4 occurs when organic matter undergoes microbial degradation under anaerobic conditions (Gaudy Jr and Gaudy 1988). The quantity produced depends on manure characteristics, temperature, and storage duration (USEPA 1994). In general, CH4 emissions are much larger when manure is stored as a liquid (e.g., IPCC MCF = 20% up to 70%) compared to solid (e.g., IPCC MCF = 2%). Research on emissions from liquid manure has generally focused on the influence of mitigation strategies such as covers (Amon et al 2006, Chadwick 2005, Laguë et al 2005), but less focus has been placed on quantifying annual emissions from farm manure stores. Though seemingly simple, the basic environmental and physical aspects of manure storage practices may have large influences on emissions.
The IPCC quantification methodology is guided by four overriding principles: transparency, accuracy, comparability and consistency. The IPCC Tier 2 guidance for estimating CH4 emissions from manure management is an empirical model that is transparent, comparable and consistent. However, the accuracy of the methodology has not been confirmed by independent research. The method requires livestock populations, animal feed, storage type, and average temperature to calculate an emission factor:

where EF(MM)T is the annual emission factor for defined animal category T (kg hd−1 yr−1),VST is the daily volatile solids excreted for an animal within the defined population T (kg d−1) and is based on total dry matter intake and digestibility of the feed, B0T is the maximum CH4 production potential from manure produced by an animal within defined population T (m3 kg−1 VS),MCFij is the CH4 conversion factor for each manure management system i in climate region j,MSTij is the system distribution factor, defined as the fraction of animal category T's manure that is handled using manure system i in climate region j.
The current Canadian model derives animal production parameters MS and VS from expert opinion surveys (Marinier et al 2004, 2005). Default MCF and B0 are used from IPCC guidelines (IPCC 2000). Although Canadian agriculture occurs in seven ecozones (Lands Directorate 1986) ranging from semi-arid to humid climates with monthly average temperatures from −20 to 2 ° C in January and from 16 to 22 ° C in July, regional differences in temperature and management are not considered. Rather, the entire country is modeled as a single average entity. The model is entirely static, only the number of animals changes over time. A recent uncertainty analysis of methane emissions from manure management estimated uncertainty was ±35% of the mean annual estimate, mostly due to the use of national-scale IPCC default parameter values (Karimi-Zindashty et al 2012). Thus, there is ample room to improve the implementation of the existing approach, taking into account more country-specific information about current manure management and to reflect changes in practices over time.
The objective of this letter is to develop an approach for quantifying CH4 emissions from agricultural sources that responds to changes in practices over time with lower uncertainty and better accuracy. Though the approach can be applied to any GHG inventory, we use the case study of CH4 emissions from manure management in Canada. We provide an overview of critical data and knowledge gaps. The analysis focuses on three aspects of the inventory process.
(1) Collection of relevant manure management storage system activity data—in the Canadian context, what data is available, how is the data collected, and what are the limitations of that data. The available activity data describing the use of solid versus liquid manure management is explored quantitatively.
(2) The development of models—published models are discussed in terms of their applicability to the national inventory and their ability to respond to farm management changes. An approach for improving the Canadian model is presented.
(3) Research aimed at model validation—measured CH4 emissions in published literature are reviewed. Data gaps and future research needs are identified.
2. Methods
2.1. Models
A review of CH4 emission models was conducted. This began with the IPCC modeling framework and an exploration of the Good Practice Guides including the models used to develop the IPCC approach. In addition, a literature search was conducted for empirical and mechanistic models including those used for biogas or inventory purposes. The scale of model validation and data required to run the model at the national scale were considered.
2.2. Activity data: manure storage systems
Four national producer surveys were identified as significant sources of manure management data in Canada: the 1995 farm inputs management survey (FIMS), the 2001 farm environmental management survey (FEMS), the 2005 livestock farm practices survey (LFPS), and the 2006 FEMS. The surveys were carried out by Statistics Canada in partnership with Agriculture and Agri-Food Canada. Survey sizes ranged from 3000 livestock farms in the 1995 FIMS to 21 000 farms (all types) in the 2001 FEMS. These surveys were designed to assess the adoption of BMPs for environmental issues. Statistics Canada publications summarizing the results of these surveys could not be used for inventory purposes primarily due to results being summarized by farm and not related to the number of animals.
To overcome the differences in survey design and to make the link between animal populations and manure management systems (i.e., MS in equation (1)), we re-tabulated the survey results. Decision trees were developed that linked the number of animals of each type on a farm to a specific manure management system. This was done using query models in Microsoft Access, and manual analysis for farms with multiple animal types and manure management systems. National results were tabulated and a sigmoid equation was used to describe MS as a function of farm size in dairy and swine production.
2.3. Measured emissions
Published CH4 emission measurements from Canadian manure management systems were identified by searching Agricola, Proquest and Scifinder databases as of January 2013. Results were limited to peer-reviewed work with the exception of Pelletier et al (2004). In total, 27 studies were found and each was assigned to the ecozone where research occurred so that regions lacking data could be identified (see section 3.3.2). Ecozones were used because ecological and climate characteristics affect agricultural practices and CH4 emissions.
To demonstrate the existing measured emissions, flux data were extracted from figures in selected studies using UnGraph 5.0 (Biosoft, Cambridge, UK). Studies were selected if they were conducted outdoors (included environmental influence in results) and provided sufficient data to convert to common units. Conversion of data in Pattey et al (2005) required the assumption of manure density (990 kg m−3; ASAE 2010) and for Kaharabata et al (1998), units of ppm were converted to emissions using the average concentration/source ratio reported (C/Q). Data were grouped by manure type (swine or dairy) and re-plotted.
3. Results and discussion
3.1. Emission modeling
3.1.1. Framework for inventory calculation.
A national inventory should estimate emissions in a transparent way that is comparable with inventories from other countries. At the same time, the inventory should capture farm management practices that influence emissions and provide an accurate estimate of emissions per animal. This generally requires data obtained from census, farm surveys, and weather stations. In Canada, data from the census and weather stations are well organized and collected regularly. However, as shown in figure 1, there are two factors that limit the inventory response to changing farm management: (i) limited data characterizing farm management practices, and (ii) the lack of a validated emission model that can predict manure emissions under different management practices.
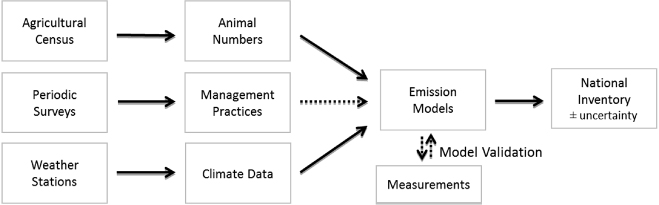
Figure 1. A general framework of data sources, models and measurements needed to create manure management emission estimates. Dotted lines indicate linkages that need improvement so that inventory estimates reflect changing management practices.
Download figure:
Standard image High-resolution image3.1.2. The IPCC emission modeling approach.
The IPCC Tier 2 methodology uses a methane conversion factor (MCF) to describe the amount of CH4 produced by a particular storage in comparison to the maximum CH4 production potential. The MCF reflects all aspects affecting CH4 production (i.e., temperature, retention time, and inoculum) within a single parameter. The first MCF values in IPCC documentation (IPCC 1997) were derived from CH4 emissions simulated by a mechanistic model (Zeeman and Hamelers 1992 reported in Zeeman 1994). The Zeeman and Hamelers (1992) model used first order kinetics to describe hydrolysis, Monod kinetics for methanogenesis, and parameters for the concentration of methanogens and methanogenic inoculum. In model runs, storages were treated as fed-batch systems where 15% of the stored manure was retained, to serve as a microbial inoculum.
The current IPCC Tier 2 MCF values for manure storage categories 'anaerobic lagoon' and 'liquid/slurry' were calculated based on a USEPA procedure developed for anaerobic treatment lagoons and described in a brief report by Mangino et al (2001) (tables 10.17, 10A-4 in IPCC 2006). This approach considers air temperature and retention time, using a monthly time-step and the van't Hoff Arrhenius equation. It does not account for inoculum. The procedure introduces a management and design practices (MDP) factor to calibrate the calculated emissions by supposedly accounting for other mechanisms of VS removal from the system besides CH4 production (e.g., not all manure being transferred to the storage from the barn). Calibrations of this model were based on biogas collected at two covered lagoons. Little justification was given for the MDP. The authors did not discuss how differences between calculated emissions and the CH4 captured by the lagoon covers could be accounted for by uncertainty in default parameters which were not measured (B0, VS production) and several assumptions (CH4 concentration of collected biogas, collection efficiency of the lagoon covers). Potential differences in CH4 production between covered and uncovered lagoons were also not considered (cf King et al 2011). Lory et al (2010) highlighted a weakness of the USEPA method stating that 'their estimate of MCF is fatally flawed because it estimated the conversion of VS into CH4 as a percentage of VS in excreted manure, not as a percentage of the maximum degradable VS in the storage'.
The IPCC MCF values have changed significantly over the years. For example, dairy cattle manure handled as liquid/slurry in a cool climate was assigned an MCF of 10% in IPCC 1995/1996 (table 5 in Zeeman and Gerbens 2000), but was reported as 39% in Zeeman (1994) and IPCC (2000), and ranges from 17% to 25% in IPCC (2006), based on Mangino et al (2001). It is unclear why there was such large variability in default MCFs (Dustan 2002), but it is likely due, in part, to changing from the results of Zeeman (1994) to the USEPA procedure (Mangino et al 2001).
Zeeman (1994) pointed out that MCF varies dramatically with temperature and storage time. For instance, swine manure stored at 15 ° C for 100 days had an MCF of 0%, but storage of the same manure at the same temperature for 180 days had an MCF of 39%. Storage time is absolutely critical, especially solids retention time. Temperature is only relevant in the context of short retention times, since B0 is temperature independent (Safley and Westerman 1992). If manure is stored anaerobically for sufficient duration the amount of CH4 produced will be the same regardless of temperature. The IPCC (2006) acknowledges that MCF depends on temperature and retention time. Yet, when defining the MCF values, temperature is given high precision—1 ° C increments—while retention time is vaguely lumped within system definitions. For example, liquid/slurry is defined as being stored 'outside the animal housing, usually for periods less than one year'. This imprecise definition of retention time is inadequate, and calculating the MCF in 1 ° C increments gives the illusion of precision. Finally, characteristics of inoculum are not considered, although it was part of the original methodology (Zeeman 1994) and has been demonstrated to have a strong influence (Massé et al 2008).
3.1.3. Alternatives to the IPCC Tier 2 modeling approach.
Mechanistic models besides Zeeman and Hamelers (1992) have been developed to estimate CH4 production in lab-scale reactors (e.g., Hill and Barth 1977, Bolte and Hill 1990, Massé and Droste 2000, Huang et al 2010). These models are based on similar concepts using VS and B0. The rate of emission production is regulated by temperature, and the total CH4 yield is affected by retention time. Microbial processes that degrade VS are modeled with varying kinetics, taking into account hydrolysis, acetogenesis, and methanogenesis.
Several farm GHG emission models were found that calculate emissions from manure management (e.g., FarmSim, DiaryWise, GAS-EM, HOLOS). These models all use the IPCC Tier 2 approach with user supplied activity data to calculate parameters like VS excretion. Manure emission calculations of the Unified Livestock Industry and Crop Emissions Estimation System (ULICEES, Vergé et al 2012) uses the IPCC methodology adapted to Canadian conditions by calculating VS based on the animal diets and digestibility. Calculations for liquid storage systems used the average temperatures of the provincial agricultural areas adjusted by an index of seasonal manure applications (Vergé et al 2007).
Some models deviate from the IPCC approach. The algorithm proposed by Sommer et al (2004b), (incorporated in the Integrated Farm System Model; Rotz et al 2011), shares many features with the IPCC approach but differs by partitioning VS into degradable and 'non-degradable' fractions. Methane production from each VS fraction is modeled separately, with the non-degradable fraction having a lower rate constant. Another unique aspect is that the Sommer et al (2004b) algorithm considers CH4 emissions from the barn and pre-storage (i.e., below barn holding pit) in addition to the storage itself, each having its own Arrhenius parameter. In their demonstration of the model (a modeling exercise without measured data to compare to), the 'in-house' pre-storage with 30 day retention time accounted for 40% of the cumulative annual emissions from the manure management system. The large emission rate from pre-storage demonstrates the importance of considering all manure management stages, and highlights a gap in the IPCC approach focused solely on the final manure storage.
Manure-DNDC (Li et al 2012) is a new mechanistic model that uses the anaerobic-balloon concept from DNDC and applies thermodynamics, climate, and reaction kinetics to estimate emissions. It is intended to model farm-scale systems including manure storages. Many options are possible including combinations of livestock and manure management system as well as mitigation strategies. The model simulates the environmental factors driving biogeochemical reactions, thus the required input data are focused on farm management, feed, and climate. This may be the best suited approach for modeling emissions mechanistically.
3.1.4. Current modeling approach in Canada.
Canada uses the IPCC Tier 2 approach (equation (1)) applied at the national scale. Volatile solids are derived from feed consumption estimates based on the quantity and quality (digestibility) of feed (IPCC 2006); or in the case of cattle, energy consumption estimates based on animal activity estimates and feed digestibility excluding contributions from bedding. Feed consumption—thus VS production—are derived from one expert opinion survey (Marinier et al 2004). A similar survey (Marinier et al 2005) gives a fixed estimate of the distribution of manure management systems including the division between solid and liquid manure. In all, manure management system categories are limited to: liquid, solid, Pasture range and Paddock, and other. All other parameters are IPCC defaults, including MCF and B0. Recently B0 has been determined from six Canadian farms (Godbout et al 2010), suggesting that some manures may differ substantially from IPCC defaults, and a broad sampling of manure is required to derive regionally specific values. The MCF for the entire country is the IPCC value for cool regions with an annual average temperature of 12 ° C (i.e., 20% for liquid manure). In fact, the annual average temperature in agricultural regions of Canada is between 2 and 8 ° C. Nonetheless, all liquid manure storages are given the same MCF.
3.1.5. Potential improvements to the Canadian modeling approach.
As models increase in complexity they require more detailed information that is difficult to obtain at a national scale (figure 2). Furthermore, to meet United Nations Framework Convention on Climate Change (UNFCCC) standards, the approach must be able to be applied consistently throughout the period that international agreements identify as the base year, to the present day. The current modeling approach has data inputs lying to the far-left of figure 2: where the data are available nationally but do not fully reflect management. Models with data inputs lying towards the far-right more accurately describe CH4 production but require data that is unavailable. The challenge is to find the balance where the emission model becomes as detailed as activity data will allow.

Figure 2. A conceptual gradient illustrating the availability of data at the national scale. On the left are the types of data available at the national scale, whereas on the right are the fine-scale factors driving CH4 production and emissions.
Download figure:
Standard image High-resolution imageGiven the constraints of data availability a pragmatic solution is required. We propose first to focus on the largest source of CH4—liquid manure—and take an achievable step towards quantifying emissions in a way that responds to management changes. A major improvement could be to have retention time and inoculum explicitly within the modeling framework to better reflect the driving forces of CH4 production thus allowing basic management practices that could mitigate emission to be incorporated in the model. To do this, we propose to take advantage of survey data that lie in the center of figure 2, indicating the timing and frequency of liquid manure application for different livestock types across the country. Using a mechanistic model to simulate emissions under different management scenarios, MCF values can be calculated to create an expanded matrix account for emptying frequency, timing, and amount of inoculum remaining after emptying (table 1). The effect of surface crusts can be brought into the framework using the same approach as it is recognized by the IPCC as a mitigation measure; however, the mitigation effect of methanotrophy is unclear and recent results suggest CH4 consumption peaks in winter (Nielsen et al 2013). The use of a mechanistic model (validated with measured emissions) reduces the reliance on emission data from single studies as multiple studies can be used to develop a single model. Additionally, the statistical fit between modeled and measured data could provide an estimate of uncertainty if the validated model is run against an independent data set.
Table 1. An example of possible methane conversion factors, MCFijkl, where i is the manure management system (in this case, liquid manure) and j,k,l are shown in the table. Hypothetical MCF factors are given for each combination of factors to illustrate the range of MCF values that could be made available in the model. A table like this would need to be populated using a combination of measurements and modeling for Canadian conditions.
| k | l | j | ||||
|---|---|---|---|---|---|---|
| Frequency and timing of removal with agitationa (yr−1) | Inoculum (% of total storage volume) | Temperature (° C) | ||||
| 3 | 6 | 11 | 12 | 13 | ||
| MCFijkl | ||||||
| <1 | 0 | 38% | 40% | 48% | 50% | 61% |
| <1 | 15 | 58% | 60% | 68% | 70% | 71% |
| 1 (spring) | 0 | 8% | 10% | 15% | 16% | 17% |
| 1 (fall) | 0 | 13% | 15% | 25% | 27% | 28% |
| 1 (spring) | 15 | 23% | 25% | 35% | 36% | 37% |
| 1 (fall) | 15 | 38% | 40% | 48% | 49% | 50% |
| 2 (spring, summer) | 0 | 5% | 6% | 8% | 9% | 10% |
| 2 (spring, fall) | 0 | 10% | 12% | 14% | 15% | 16% |
| 2 (spring, summer) | 15 | 10% | 12% | 14% | 15% | 16% |
| 2 (spring, fall) | 15 | 15% | 17% | 19% | 20% | 21% |
| 3 | 0 | 3% | 4% | 6% | 7% | 8% |
| 3 | 15 | 6% | 8% | 12% | 13% | 14% |
aAgitation is specified here because it clarifies that both liquids and solids were removed from the storage. This distinguishes removal of solids (i.e., volatile solids) which affects the solids retention time from the removal of liquid supernatant without agitation.
The equation used to calculate emissions would stay the same as equation (1), with the following modification: MCFij would become MCFijkl, where k indicates the retention time and time of storage emptying, and l is the amount of inoculum remaining in the storage after manure removal. The net effect is distinguishing among manure storages that are managed differently, e.g.:
- Storages that are 'emptied' once per year or less (e.g., earthen basins for swine manure in the prairies where the annual MCF might be above 40%).
- Storages that are 'emptied' twice per year (e.g., a typical manure storage where manure is spread in the spring and fall, where the MCF might be 20%, i.e., the current default value).
- Storages that are 'emptied' three times per year (e.g., a dairy farm with spreading on summer forage crops, where the annual MCF might be 5%).
- Storages 'emptied' in the spring will have less stored manure in the warm summer months and thus a lower annual MCF than those emptied only in the fall.
- Storages that are completely emptied would have a lower MCF due to the lack of inoculum and associated lag in CH4 production.
3.2. Activity data: manure storage systems
To accurately estimate emissions, and evaluate the efficacy of mitigation practices at the national scale, an accurate estimate of MS (equation (1)) is required. Canadian environmental characteristics are well known at a fine spatial scale and animal numbers are regularly monitored; however, manure management information is collected sporadically by surveys of producers or experts. These surveys were not developed to quantitatively link animals to manure management systems and survey compilations tend to use farms as the reporting unit, so management of a farm with 100 animals is weighted the same as a farm with 1000 animals. During previous compilation of survey results, farms with manure going to multiple manure management systems were ignored, resulting in over estimates of solid and liquid manures. Furthermore, differences in survey design, definitions, and question formulations resulted in inconsistencies from one survey to the next. Due to these limitations the Canadian inventory has relied on a single provincial-scale estimate of MS from an expert survey in 2004 (Marinier et al 2004), thus failing to reflect changes in the industry as farms get larger and adapt their manure management systems.
With the re-tabulated data we observed that there have been important shifts over time in the use of manure storage systems. In the dairy sector, the use of liquid manure systems increased by more than double between 1995 and 2006, from ∼30% to 70% of the total manure stored. Beef manure management shifted from having most manure stored in piles (60% in 1995) to the majority being manure packs in 2006 (60%). Use of liquid manure in poultry barns decreased substantially from 25% of animals in 1995 to only 10% in 2006. These data also allow regional management changes to be observed, however, due to confidentiality issues and small survey sample sizes, some provincial results cannot be shared.
3.2.1. Uncertainty in activity data: manure storage systems.
Survey methodology introduces uncertainty. At the national scale Bourque and Koroluk (2003) estimated the uncertainty associated with all farms storing solid manure in the 2001 FEMS survey was ±3% around the estimated national total for solid manure production. As data is further disaggregated—e.g., to provinces and different animal categories—uncertainty increases in proportion to the decreased sample size. For example, for swine in smaller provinces, there can be as few as seven respondents and coefficients of variation as high as 50%.
Uncertainty is also introduced by the survey design and the assumptions needed during tabulation of results, particularly for mixed-livestock farms and farms with multiple manure storages. The FEMS 2006 survey considered 14% of respondents as mixed farms and ∼10% of farms reported multiple manure systems. Errors were inevitable in the attribution of manure from each animal category to an appropriate manure storage system on these farms with multiple animal types and manure storage systems. Therefore, roughly 24% of the survey data could be exposed to error from data interpretation. While these farms could be removed from the survey, this approach would introduce bias into the analysis. Differences in survey definitions, and question formulation also introduce inaccuracies in the data. It is not possible to quantify this uncertainty, but it must be taken into account in the overall evaluation.
3.2.2. Effective use of survey data for better quantification of CH4 emissions.
Due to the limitations of manure management survey data it was not possible to develop a dataset that could provide a regional MS value based on survey data alone. Regional MS is desirable because it allows coordination with local environmental data and calculation of CH4 emissions on a finer scale (i.e., equation (1) could be calculated for each region in the country). An alternative approach was therefore required.
Detailed and complete statistics on animal populations and farm size have been collected on a regular basis through the Canadian agricultural census which has a >90% response rate and provides robust national and regional data. Therefore, in order to obtain a regional MS, our concept was to make a quantitative link between the census data and the manure management survey data. This was done by using farm size as a surrogate for manure management systems, based on statistical relationships established in the manure management survey dataset.
Consider the example of liquid versus solid manure. We expect that the use of liquid manure management systems is closely related to farm size, as larger farms require more automation and finances on large farms are adequate to justify the installation costs of liquid systems. For extrapolation of the survey results to the regional scale and across the time series, an empirical sigmoid model was developed to relate farm size to manure management systems:
where MSit is the manure management system in region i at time t,FSit is the farm size in region i and time t,FSC is the farm size at which a change from one specific manure management system to another is advantageous considering work load and economics of the farm and a and b are sigmoid fitting parameters that are animal specific, but constant over time and region.
For swine production (figure 3(a)), small farms use more solid manure while liquid systems become prevalent for farms above ∼500 hd. Surveys from 1995 to 2006 followed a similar logistic relationship with farm size accounting for approximately 90% of the variability in the results. This indicates that manure management systems have been stable over time in the Canadian swine industry.
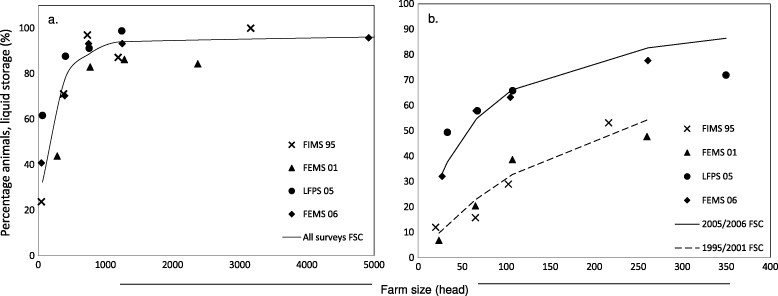
Figure 3. Relationship between farm size and the proportion of manure stored as liquid using data from surveys carried out in Canada. Farm size refers to the total number of animals on the farm, including mature and young stock. Each data point is the fraction of total animals contributing manure to a liquid manure system in the farm size class for each survey (FIMS 1995, FEMS 2001, LFPS 2005, FEMS 2006). Lines are a sigmoid model fit to the survey data for: (a) swine production, and (b) dairy production. Fits were obtained by adjusting the coefficients in the sigmoid function to minimize the squared difference between observed and modeled results. For dairy production, surveys from 1995 and 2001 were modeled separately from surveys in 2005 and 2006, with individual optimization of the farm size where change from solid to liquid manure management occurs (FSC), to reflect changes in the dairy industry.
Download figure:
Standard image High-resolution imageFor the dairy industry, manure management changes were also associated with farm size. Early surveys (1995 FIMS and 2001 FEMS) demonstrate different farm size relationships compared to the later ones (2005 LFPS and 2006 FEMS) (figure 3(b)). This quantitatively reflects the consolidation and renewal of farm infrastructure that occurred in the dairy industry in the past decade. Factors other than farm size alone have contributed to the conversion from solid to liquid systems as more and smaller farms have converted to liquid storage systems in recent years.
The relationship between farm size and manure management for each survey is robust. By combining these relationships with regional farm size distributions from census data, a regional MS matrix of liquid manure system use can be derived that captures change over time in each region. As a result it is possible to estimate, for example, that manure stored as liquid on dairy farms in Saskatchewan has increased from 22% to 88% between 1991 and 2006 and from 82% to 99% on swine farms. Based on a constant MCF and volatile solids excretion rate of 4.5 (dairy) and 0.35 (swine) kg hd−1 d−1, over the period of 1991 to 2006, CH4 EFs for manure management in Saskatchewan have increased from 14 to 48 kg hd−1 yr−1 for dairy production and from 6.8 to 8.1 kg hd−1 yr−1 for swine production, 340% and 20% increases, respectively. This level of temporal and spatial resolution is a great step forward.
3.2.3. Improvements needed for better quantification of CH4 emissions.
With some added analysis, producer survey data can be used to quantify activity data necessary for the calculating CH4 emissions. Performing these analyses retroactively, however, is not ideal as it is laborious and introduces uncertainty that could be avoided in future surveys. By clearly defining the inventory emission model and identifying the required activity data, future surveys may be refined to yield data for direct inventory use. Based on an evaluation of past surveys, new efforts must focus on the (i) ability to separate animal populations and clearly associate them with manure management systems on mixed farms, (ii) ability to capture multi-stage manure management systems including treatments (separation, covers, additives), (iii) clear definitions of management systems and treatments are needed within the survey.
To be able to implement the modeling framework outlined in table 1, information on storage duration and timing of emptying can be obtained from existing surveys (FEMS, LFPS, e.g., Sheppard et al 2011). The percentage of manure storages in a region emptied in spring, summer, and fall, is not sufficient for completing table 1. Therefore, this will require re-analysis of the survey data to determine the manure emptying practices of each respondent and make the link to animal numbers. Storage inoculum is currently unknown, but can be assumed to be 15% at present (aligned with IPCC 1997, Zeeman 1994) and leaving the opportunity to include tank cleaning as a mitigation practice in the future.
3.3. Measured emissions
To improve confidence and reduce uncertainty, the emission model used needs to be validated against measured data. There is, however, a lack of CH4 emission measurements available to compare with model results (Dustan 2002). For example, Sommer et al (2004b) lacked CH4 emission data from manure pre-storage and outdoor stores, so their model was parameterized to give similar results to the IPCC (1997) methodology. The IPCC (1997) method was based on Zeeman (1994) which was a modeling exercise (no measurements) using a model developed for laboratory digesters. The USEPA procedure (Mangino et al 2001) compared their results against biogas collected at covered anaerobic lagoons. Li et al (2012) compared manure-DNDC to measured data from seven case studies, however, none of the data included CH4 emissions from stored liquid manure—the only data for CH4 from manure was from the floor of mechanically ventilated barns or holding cells, and the only data from a liquid manure storage were N losses from a swine lagoon. In Canada there is a similar lack of data and there is a clear need to compare models to measurements made on the actual system being modeled (VanderZaag et al 2011).
3.3.1. Measurement scale and technique.
Comparisons between models and measurements should have the goal of determining the degree of confirmation between the model and the real-world it represents (Oreskes et al 1994). Model development may occur through three study types with different objectives: (1) capturing real emission values; (2) comparisons between emissions to evaluate specific factors; and (3) characterization of the capacity of materials to emit.
Lab studies are useful for characterizing materials and obtaining specific model parameters like B0. They are the basis of the IPCC defaults (e.g., (Hashimoto et al 1981)) and recent work has followed ISO standards (e.g., Godbout et al (2010)). A persistent problem with lab studies is that the lab vessels are imperfect analogs for farm-scale manure management systems (Lory et al 2010). Lab studies to determine B0 should be done at the same time as field studies so that emissions and B0 are measured simultaneously, enabling MCF to be calculated.
Pilot-scale studies are in between the lab and farm scales. These outdoors tanks are useful for comparing treatments and exploring mitigation practices like surface covers (e.g., VanderZaag et al 2010a, 2010b; Rodhe et al 2012). Being outdoors ensures that the manure is exposed to environmental conditions representative of the region (temperature, solar radiation, precipitation) and the scale of the tanks (∼2 m depth) enables stratification and ebullition to occur as it would on a farm. Pilot-scale studies are good for developing specific algorithms within a model because all supporting parameters can be measured accurately (e.g., total VS in the storage); but these are imperfect analogs. A major issue is that manure is often batch-loaded at the beginning of the study (often into clean vessels) unlike farms, where manure stores fill gradually. This affects the time-course and magnitude of emissions. The batch loading issue can be avoided by regular manure additions (see Rodhe et al 2012), though this is a logistical challenge. It is also challenging to obtain representative manure from a farm to put into the lab- or pilot-scale system since manure is so heterogeneous. Pilot-scale studies targeted at the effect of inoculum (e.g., varying the amount of residual manure left after removal in replicated tanks) would help characterize the inoculum effect incorporated into the MCF values in table 1, and would be useful for model development.
The ideal approach to understand and model on-farm emissions is to conduct on-farm measurements. This alleviates the problem of confirming that an analog system represents the real system. Furthermore, the link between animals and emissions is clear, which fits the inventory approach. The IPCC (2006) recommends that EFs be determined through non-invasive measurements of emissions in actual systems used in the country. Several micrometeorological techniques are available to measure CH4 fluxes from on-farm storages including mass balance approaches (Wagner-Riddle et al 2006, Sommer et al 2004a), tracer methods (Kaharabata et al 1998), and backwards Lagrangian stochastic dispersion modeling (Flesch et al 2005). A challenge is the aerodynamic criteria required, e.g., flat, relatively homogeneous terrain, and isolated manure storage. These techniques should be the cornerstone of future model development and inventory improvements.
Chambers can be used on farms but the chamber disturbs the measurement area (altering concentration and temperature gradients; triggering ebullition; disturbing surface crusts). Furthermore, spatial and temporal flux variability makes it difficult to estimate total emissions. Husted (1993) observed 100-fold differences in fluxes measured simultaneously at different places on a swine slurry tank. Park et al (2010) found higher estimates from the chamber than MMB approach, due to disturbance caused by the chamber and spatial heterogeneity in the tank with ebullition visible in areas near the inlet pipe (see also DeSutter and Ham (2005)). Wood et al (2013) continuously measured CH4 fluxes from dairy slurry stored in pilot-scale tanks and found substantial diurnal and seasonal variability highlighting the challenges with techniques that yield discontinuous time series. For on-farm measurements of CH4, micrometeorological techniques are preferable to chambers.
3.3.2. Canadian studies.
Livestock and manure management in Canada occurs primarily in four ecozones: Pacific Maritime, Prairies, Mixedwood Plains, and Atlantic Maritime. These ecozones affect the temperature of the stored manure and, perhaps more importantly, the storage time. For example, the Prairie ecozone has colder temperatures and the shorter growing season leaves narrower windows to apply manure. Thus longer storage times are needed, likely affecting the MCF (table 1). In Manitoba typical earthen basins have 400–500 days of storage capacity (MAFRI 2005). In contrast, the Pacific Maritime ecozone has a long growing season and moderate temperature, providing more opportunities to apply manure. In the Fraser Valley 60% of dairy and swine farms had less than 150 days of liquid manure storage capacity and 12% had less than 100 days (Bertrand 1999).
Dairy manure. In the Pacific Maritime ecozone Lo et al (1984) and Liao and Lo (1985) conducted lab studies on biogas production in bioreactors. These cannot be used to estimate MCF from manure storages. In the Prairies, McGinn and Beauchemin (2012) measured CH4 emissions from dairy cattle facilities for several days in the summer using the bLS inverse dispersion technique but manure emissions were not measured directly, rather estimated from IPCC equations; thus, this study cannot be used to estimate MCF from manure storages. In the Mixedwood Plains several studies were done in laboratories (Jackson et al 1994, Massé et al 2003, 2008) and three were outdoors (Kaharabata et al 1998, Pattey et al 2005, VanderZaag et al 2011). The outdoor studies used micrometeorological techniques at concrete tanks containing dairy slurry during campaigns of about six months. The lab studies investigated CH4 production from liquid manure for up to one year of incubation in closed vessels. The outdoor studies show a wide range of flux magnitudes and temporal variation (figure 4(b)). Pattey et al (2005) designed a pilot-scale study to evaluate composting. As part of the study, liquid manure (10% bedding) was batch-loaded into a clean bin of 2.6 m2 and 1.0 m depth and monitored twice weekly for 14 weeks. This may be useful for characterizing the effect of inoculum, but not for estimating MCF from manure storages. In the Atlantic Maritime ecozone, research has been in pilot-scale tanks without inoculum (VanderZaag et al 2009, 2010a, 2010b, Wood et al 2012, 2013) where the studies were designed to evaluate mitigation practices. Thus, there are data on emissions from slurry stored in tanks; however, there has not been a full year of data at a site that would enable comparison to an emission model or development of an MCF for a combination of j,k,l in table 1.
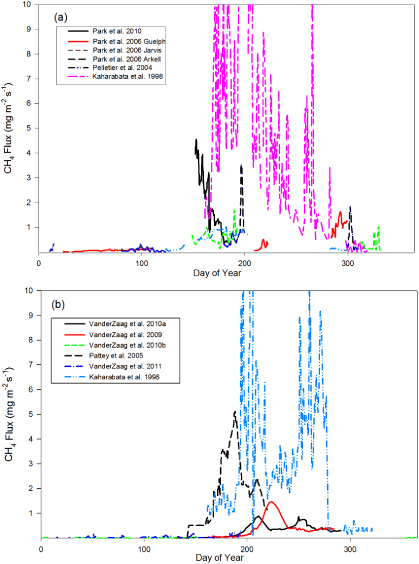
Figure 4. Fluxes of CH4 from Canadian studies in the literature for (a) liquid swine manure and (b) liquid dairy manure. Data were extracted from time series graphs and converted to mg m−2 s−1 using supporting data in each study. Daily averages fluxes are shown. The maximum fluxes from Kaharabata et al (1998) are above the scale.
Download figure:
Standard image High-resolution image
Swine manure. In the Prairies, Clark et al (2005) compared diets in a lab study; four measurements were made over eight weeks from batch-loaded manure in clean 200-L vessels. Outdoor measurements were conducted in the Prairies by Laguë et al (2005) who studied four farrow-to-finish swine farms using four floating chambers deployed for 2–8 days in up to three seasons. Some basins had floating straw covers. This study provides a starting point for modeling in this ecozone; however, there was high variability, small sample numbers, and no information about retention time. Flesch et al (2013) is the first study to conduct measurements at one farm for a full year. In 2010, they carried out four seasonal campaigns at a swine farrow-to-finish operation in Alberta, each campaign lasted ∼10 days. The retention time of the manure tank was ∼15 months. Methane measurements using bLS were compared to results calculated using the USEPA method but the MDP required major adjustment and the calculated methane emission values were two-third higher than measured. Additional measurements are clearly needed to develop a mechanistic model. In the Mixedwood Plains ecozone, measurements have been conducted on liquid swine manure in the lab (Massé et al 2003) and at farm tanks using floating chambers (Pelletier et al 2004, Park et al 2010), and micrometeorological techniques (Kaharabata et al 1998, Park et al 2006, 2010). One study investigated liquid swine manure composting with straw (Thompson et al 2004). As can be seen in figure 4, there have been measurements during all times of the year, but no study at a single farm for a full year. Variability in emissions is large, as was the case for dairy, likely due to farm management.
Beef manure. There is one study on solid manure systems comparing diet effects (manure pack; Boadi et al 2004). Other studies focus on composting manure (Hao et al 2001, Hao 2007, Hao et al 2009, 2010, Xu et al 2007). Liquid manure is minor in Canada's beef production; nevertheless there are no studies that could be used to improve the inventory.
To date, emission studies tend to focus on evaluating mitigation strategies and not quantifying annual emissions, which requires longer term measurements. Summer and fall are presumably the most important for high emissions and during that time we see a large range of emissions—often an order of magnitude—between studies and between farms. We would expect a wide range of emissions based on differences in temperature, inoculum, and retention time, but these studies do not give enough supporting data to determine what factors caused the variation. Data from pilot-scale batch-loaded studies without inoculum show a characteristic initial lag-phase followed by exponential increase and then decay. This is unlikely to reflect the time-course of emissions on a farm with inoculum and continuous loading. The two studies from dairy farms (Kaharabata et al 1998 and VanderZaag et al 2011) illustrate the importance of farm management. The low emissions observed by VanderZaag et al (2011) are consistent with the high removal frequency of manure on that farm. Unfortunately, the duration of both studies was only six months.
3.3.3. Recommendations.
Existing literature will be useful in a supporting role, but to make significant inventory improvements a new series of targeted measurement campaigns is required. A monitoring program is needed to obtain continuous, year-round emission measurements from farms representing key combinations of retention time and inoculum shown in table 1, and in regions with differing temperatures. The objective is to calibrate a mechanistic model that can be used to populate a matrix like table 1. Supporting information is crucial to describe farm management, animal data, and manure parameters including B0. Pilot-scale studies will be useful for developing the temperature and inoculum response of the model.
It would be premature to attempt to predict how emissions would change in Canada. However, we can illustrate the potential using a hypothetical region with an annual average temperature of 6 ° C where the liquid manure on half of the dairy farms is spread twice annually (spring and fall), a quarter spread three times per year, and a quarter spread once per year in the fall. All of the farms would currently be assigned an MCF of 20%. Using the hypothetical data in table 1, we would have an MCF of 17% on half of the farms, and 8% and 40% for the other two quarters. The weighted average MCF under the new methodology would be little changed at 20.5%. However, the opportunity for mitigation now exists. Consider if all of the farms applying manure once per year switch to twice per year (spring and fall), and further assume half of the farms emptying three times now remove all inoculum. In this scenario we have an overall MCF of 14.3%, which is a reduction of approximately 30%. By incorporating the added information into the model, we are able to capture regional information and the adoption of best management practices.
4. Conclusion
To establish an emission inventory that responds to changing farm management and management-based mitigation practices, it is necessary to: (i) develop country-specific emission factors that reflect the diversity of farm management practices and regional climates, and (ii) monitor changes in manure-management practices (and infrastructure) that affect CH4 production, such as storage duration. Though uncertainty remains high, surveys provide reasonable estimates of changes in the activity data for manure management practices. The proportion of liquid dairy and swine manure on farms evolves based on farm size and technological innovations. The use of liquid systems for dairy manure has changed at a greater rate than the increase in farm size. Further, information from surveys will be required to identify how liquid manure is handled in light of the key drivers of methanogenesis. The next requirement is development of a mechanistic model that reflects key drivers of methanogenesis to produce MCF values for important combinations of retention time, storage timing, and inoculum. To this end we propose an expanded matrix of MCF values that can be used directly with the existing IPCC Tier 2 equation (equation (1)). This maintains consistency with the IPCC and simplifies the database architecture required. To populate this matrix requires year-round CH4 emission measurements to calibrate a model for liquid manure emissions. Lab- and pilot-scale studies will be needed to support this on-farm measurement program. With these improvements the methane inventory will become responsive to changes on Canadian livestock farms.
This work highlights the current state of the science in terms of the lack of measurements to use for model development and the importance of obtaining national activity data. This knowledge gap demonstrates the disconnection between the desire to mitigate emissions by countries (i.e., inventories) and industries (e.g., carbon footprints) and the lack of an inventory emission model that can account for mitigation, even though the scientific capacity to make the measurements is well established. The specific approach outlined for the manure management CH4 inventory can be generalized to other countries. The resulting matrix can be integrated into an updated IPCC methodology without major changes to the established approach. The work described here is long-term but is nonetheless required to establish basic agricultural industry baselines. The general framework described in this paper is applicable as a guide for improving the inventory calculations for other GHG emission categories within agriculture, and could be adopted by other countries for improving their national GHG inventories.
Acknowledgments
We gratefully acknowledge funding from Agriculture and Agri-Food Canada's National Carbon and Greenhouse Gas Accounting and Verification System, and Environment Canada.