
Abstract
Detection of changes in the hydrological cycles of permafrost regions is a critical issue in hydrology. Better understanding of groundwater dynamics in permafrost regions is needed to assess the vulnerability of the cryolithic water environment to changing climate. However, little is known about the age of groundwater in the Siberian Arctic region. In order to determine the residence time of permafrost groundwater in eastern Siberia, transient tracers including tritium (3H), chlorofluorocarbons (CFCs), and sulfur hexafluoride (SF6) were used to analyze a mixture of supra-permafrost and intra-permafrost groundwater in the middle of the Lena River basin. Tritium analyses showed that the concentration ranges from 1.0 to 16.8 TU, and the apparent age of groundwater ranged from around 1 to 55 years. One of the spring waters appeared to contain more than 90% water recharged by precipitation before the 1960s nuclear testing era, and the water could be partly sourced from thawing permafrost. Comparisons of apparent groundwater ages estimated from different tracers imply that 3H and CFC-12 are the most applicable to groundwater vulnerability assessments in this region. Because the apparent age is a mixture of those from supra-permafrost and intra-permafrost groundwater, further analysis would be required to assess the contribution ratio of the two types of groundwater.
Export citation and abstract BibTeX RIS

Content from this work may be used under the terms of the Creative Commons Attribution 3.0 licence. Any further distribution of this work must maintain attribution to the author(s) and the title of the work, journal citation and DOI.
1. Introduction
The cryolithic water environment and associated hydrologic changes are crucial subjects to address given the current problems caused by global warming. Better understanding of groundwater dynamics in the permafrost region, i.e. permafrost hydrology, is needed to assess the permafrost vulnerability of this region to a changing climate. Especially, permafrost might contribute to the base flow (low flow) of the Arctic streamflow through its degradation due to global warming (e.g., Brutsaert and Hiyama 2012). Thus estimation of the residence time of permafrost groundwater is valuable for evaluating the extent of permafrost degradation.
Through trend analysis of precipitation, temperature, and streamflow data, Adam and Lettenmaier (2008) concluded that Russian Arctic streamflow is sensitive to warming primarily as a result of the thawing of permafrost (and more specifically melting of excess ground ice), because positive streamflow trends might exceed precipitation trends in magnitude in the Russian Arctic region. The authors also demonstrated that permafrost most likely plays a key role in long-term streamflow variability. Smith et al (2007) analyzed daily discharge data for 111 Russian Arctic rivers from 1936–1999 or 1958–1989, and found an overall pattern of increasing minimum daily flows (or low flows) throughout Russia. They speculated that reduced intensity of seasonal ground freezing, together with precipitation increases, might drive increases in river discharge to the Arctic Ocean. However, the age or residence time of groundwater in the region is not yet known.
To determine the residence time of groundwater in arid, semi-arid, and humid regions, transient tracers such as tritium (3H), chlorofluorocarbons (CFCs) and sulfur hexafluoride (SF6) have been widely used (Busenberg and Plummer 1992, 2000, IAEA 2006). However, few studies have used such tracers in the cryolithic region. This study tries to apply such transient tracers in order to estimate groundwater age and to evaluate groundwater vulnerability in the permafrost zone of eastern Siberia.
2. Study sites
The Melnikov Permafrost Institute (MPI) of the Siberian Branch of the Russian Academy of Sciences (RAS) has historically monitored supra-permafrost and intra-permafrost groundwater in the middle part of the Lena River basin, eastern Siberia (Gagarin et al 2012). They have tried to reveal recharge areas of supra-permafrost and intra-permafrost groundwater at three spring sites in the region (figure 1): Buluus spring (61° 20'N, 129° 04'E), Ulakhan-Taryn spring (61° 34'N, 129° 33'E), and Eruu spring (61° 42'N, 129° 45'E). They have also investigated Michita discharge (61° 23'N, 129° 11'E), although not much is known yet about its origin and recharge area.
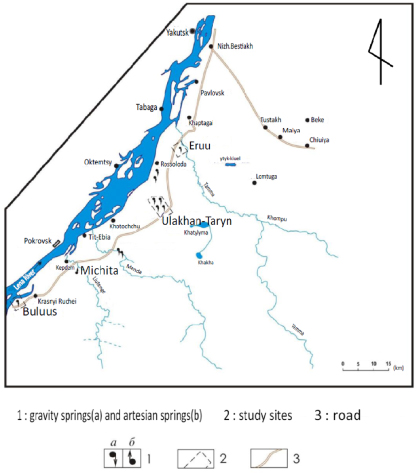
Figure 1. Map showing locations of springs on the Bestyakh terrace, middle of the Lena River basin, eastern Siberia.
Download figure:
Standard image High-resolution imageThe sites are located (130–160 m a.s.l.) within the Bestyakh Terrace of the Lena River with elevations ranging from 80–100 to 250–300 m a.s.l. Hydro-geologically the spring sites are located within the first-order Yakutian artesian basin, and the groundwater is recharged by an area approximately 400 square kilometers in size. The area lies in the zone of continuous permafrost. The thickness of permafrost in the Bestyakh Terrace ranges from 200 to 420 m. The depth of seasonal thaw, i.e. active layer thickness, varies over a wide range from 0.5–0.6 to 3.0–4.0 m, depending on surface energy balance, soil moisture content, and soil structure of the layer. Recent observations of soil temperature/moisture have shown abrupt increase in active layer depth after 2006 (Ohta et al 2008, Iijima et al 2010). Fedorov et al (2013) investigated permafrost degradation and changes in water balance of a thermokarst lake in the Tyungyulyu Terrace, which is located northeast of the Bestyakh Terrace. They analyzed the role of permafrost thawing in the water balance of a growing thermokarst lake, and showed melting of ground ice has significantly contributed to lake growth (30–35% to the lake water increase).
Supra-permafrost taliks (unfrozen zones), several tens of meters in thickness with soil temperatures above 0 ° C, are detected at the boundary of the Bestyakh Terrace and the Tyungyulyu Terrace. Drilling data show that open taliks perforating the permafrost exist only beneath the Lena River and large lakes. Intra-permafrost groundwater with 0 ° C temperature is found in the Bestyakh Terrace (Gagarin et al 2012).
2.1. Buluus spring
Buluus spring is located 110 km southwest from Yakutsk (figure 1). Springs appear at the right (northern) slope of an elongated valley, which is approximately 1.5 km long. The spring points are located 25–30 m high from the bottom of the valley and the slopes are covered with pine trees. Downstream of the spring site has a single distinct channel. Spring water drains into an oxbow lake located on the first terrace of the Lena River.
The recharge area of supra-permafrost and intra-permafrost groundwater of the Buluus spring is located at the intersection of several faults, resulting in highly fractured limestone. A supra-permafrost talik zone which feeds the spring is located 10 km northeast of the discharge point. The talik zone declines toward the spring area. It is about 4 km in maximum length and 0.5–1.5 km in width. Water-retaining suffosional depressions occur on the surface underlain by the supra-permafrost talik. In spring season, most of the surface (open) water, except for snow, drains into the supra-permafrost aquifer. The depressions are generally elongated and oriented in the direction of groundwater flow.
Three groups of groundwater discharge appear at this site and the main discharge rate is 120 l s−1 on average, which fluctuates interannually. The discharge occurs in the form of descending flows. The groundwater discharge from Buluus results in huge icing during winter season, reaching a thickness of about 4 m or more. By the end of the winter, the ice fills the entire valley floor.
2.2. Ulakhan-Taryn spring
Ulakhan-Taryn springs are located in the valley of the Ulakhan-Taryn creek, a small tributary of the Lena River (figure 1). The upper reaches of the valley are not well developed, while its middle reaches are a tortuous gorge developed in the Bestyakh terrace. The lower reaches of the valley widen to 500–900 m. The height difference between the terrace and the bottom of the valley is 15–25 m, showing evidence of continuing bank erosion and valley development.
Groundwater discharges in five major points (A, B, C, D and E), and the total mean annual discharge rate is 244 l s−1. Most of the groundwater emerges in the lower part of the slope in the form of descending flows which carry large amounts of sand. A new spring point of supra/intra-permafrost groundwater was found in 2008 at 3 km upstream of the Ulakhan-Taryn creek with a flow rate of 130 l s−1. The spring points are thus unstable and easily move to different locations. The intra-permafrost aquifer is recharged from large taliks beneath numerous lakes whose resources depend on precipitation. During the warm season, precipitation percolates through the unfrozen soil and the volume of water in the intra-permafrost aquifer increases.
Special features common in the Ulakhan-Taryn are suffosional or piping sinkholes, which provide a link for intra-permafrost water with surface water (or soil water in the active layer). The linkage is strong in wet years or in heavy rainfall events after which spring discharges increase rapidly. During the winter, ice formed in the valley of the Ulakhan-Taryn creek reaches a thickness of about 2.5 m. Observations indicate that about 5% of the total ice volume is formed in October–November, 10% in December, and the rest in the remaining winter (January–March).
2.3. Eruu spring
Eruu spring is located in a valley on the left (southern) bank of the Tamma River, which is also one of the small tributaries of the Lena River (figure 1). A deep U-shaped valley of 80–100 m in width and about 500 m in length has been formed by the groundwater discharge and its associated erosion. Its slopes and floor are forest-covered in the upper part and open (bare) in the lower part. Groundwater outflow points are located mainly at the bottom of the valley. The total mean annual discharge rate is 40 l s−1. Seeps with low flow rates also occur in the upper part of the valley. Part of the groundwater discharges in pulsing outflows, location and number of which varies interannually.
Recharge source of the groundwater at Eruu, the northernmost of the studied springs, is likely to be the lake taliks. The spring carries out large amounts of sand which is deposited at the valley bottom. The flow from the spring during winter forms an icing whose thickness reaches 2–3 m.
2.4. Michita spring
Not much is known yet about the recharge area of the Michita discharge. It may not be large compared to the other spring sites.
3. Methodology
Understanding groundwater characteristics such as pathways and residence time are the most important research issues in groundwater hydrology as well as for sustainable use of groundwater resources. Tritium (3H) concentration has previously been used for estimating the residence time of groundwater, especially in the Northern Hemisphere. The 3H concentration of precipitation peaked around 1963 due to nuclear testing (figure 2(a)). The half-life of 3H is relatively short (12.3 years), and therefore when nuclear testing was terminated the concentration declined (Shimada et al 1994). However, if the mean residence time of permafrost groundwater is around 50–60 years, 3H may be a useful tracer to detect the extent to which the groundwater originated from precipitation after nuclear testing.
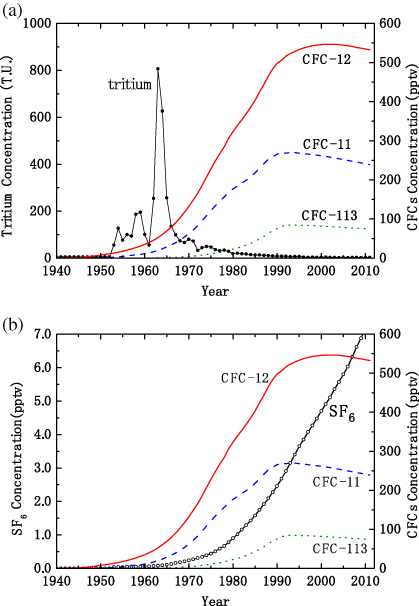
Figure 2. Time series of the tritium concentration (TU) in precipitation (a) obtained at Tokyo and Tsukuba, Japan (Shimada et al 1994). Also shown are the atmospheric CFCs concentrations ((a) and (b)) and the atmospheric SF6 concentration (b) observed by NOAA (National Oceanic and Atmospheric Administration) over North America (www.esrl.noaa.gov/gmd/hats/).
Download figure:
Standard image High-resolution imageOther transient tracers such as CFCs and SF6 can also be used to estimate residence time (IAEA 2006). CFCs are anthropogenic gases that were emitted into the atmosphere from the 1930s to 1987. Atmospheric concentrations of the major CFCs such as dichlorodifluoromethane (CCl2F2; CFC-12), trichlorofluoromethane (CCl3F; CFC-11), and trichlorotrifluoroethane (C2Cl3F3; CFC-113) peaked in the 1990s (figure 2). SF6 emissions began in the 1960s as it was used as an isolation gas, and its use continued through recent decades (figure 2(b)). CFCs can be used to estimate groundwater residence time recharged ∼20–60 years ago. SF6 can also be used for groundwater recharged around 1–40 years ago.
We used these three tracers to estimate the residence time at the four springs described above. We made two assumptions: that the sampled water truly contained CFCs and SF6 concentrations of the target groundwater in the aquifer, and that the recharged water reached full equilibrium in solubility with the soil gas (atmosphere) and the dissolved CFCs and SF6 were preserved within the aquifer. The dissolved CFCs and SF6 in the sampled water were used to estimate recharge age using Henry's solubility law (e.g., Warner and Weiss 1985). For accurate chemical analyses of dissolved CFCs and SF6 concentrations in the sampled water, the samples were kept isolated from the ambient atmosphere. The details of the analytic methodologies used are described in Thompson et al (1974), Thompson and Hayes (1979), and Bullister and Weiss (1988). Using analyzed concentrations of CFC-12, CFC-11, CFC-113, and SF6 from the sampled spring water together with temperature and elevation data, the recharge year (when the sampled water entered the aquifer) was estimated using Henry's solubility law.
3.1. Sampling
Spring water samples were taken on 28–29 July 2009, 28–29 July 2010, 6–7 August 2011, and 23–24 August 2012 at Buluus and Michita. Spring water sampled in 2011 at Ulakhan-Taryn and Eruu is also shown in this study. The samples for 3H and SF6 were collected with duplicates in 550 ml glass bottles with ethylene propylene rubber seal liner screw caps. Samples for CFCs were collected with duplicates in 125 ml glass bottles. Sample bottles were flushed with approximately 3 l sample water, then filled and capped underwater to prevent contact with the atmosphere. A peristaltic pump (Welco model Wpx-1000) was used to take water from the spring points.
Water samples of 2009 and 2010 were transported to Japan in August 2010. Those of 2011 and 2012 were transported to Japan in September that year. Water sampled in 2009 was stored at room temperature at MPI until transportation.
3.2. Analyses
3H counting was conducted using a low-background liquid scintillation counter, Aloka model LB5, following electrolytic enrichment of 3H by a factor of about 25 using Fe–Ni electrodes. Total analytical precision was better than ±0.23 tritium unit (TU) (±1σ). The 3H measurements were conducted at the Geo-Science Laboratory Co. Ltd, Nagoya, Japan.
CFC content in the samples was measured using a purge and trap gas chromatography procedure with an electron capture detector (GC-ECD) at the Geo-Science Laboratory Co. Ltd, Nagoya, Japan. The procedure involved stripping 40 ml sample water of CFCs using ultra-pure nitrogen gas. The extracted CFCs were purified and concentrated using a cold trap, and finally injected into the GC-ECD. The precision and detection limit of the analysis were less than 2% and 1 pg l−1, respectively.
SF6 content in the samples was measured using the same procedure and GC-ECD at the Geo-Science Laboratory. The only difference was that, after stripping 400 ml sample water, the extracted SF6 was purified and concentrated using two cold traps. The precision and detection limit of the analysis were less than 3% and 0.05 fmol l−1, respectively.
4. Results
4.1. Groundwater age estimation using 3H
The analyzed 3H concentrations are shown in table 1. 3H was detected in all of the spring water. The concentration at Buluus and Eruu springs was higher (9–11 TU) than that at Ulakhan-Taryn spring (1–7 TU). 3H concentration at Michita is the highest (15–17 TU). The clear difference among the springs indicates that the origin and mixing conditions of groundwater are different. There was no significant difference in 3H concentration at Buluus and Michita in the sampling years (2009–2012).
Table 1. Tritium (3H) concentration of spring water samples.
| No. | Name of samples | Year | Tritium (3H) concentration | |||
|---|---|---|---|---|---|---|
| (TU) | (Bq l−1) | |||||
| 1 | Buluus | 2009 | 10.5 | ±0.3 | 1.27 | ±0.03 |
| 2 | Buluus | 2010 | 9.1 | ±0.3 | 1.08 | ±0.03 |
| 3 | Buluus | 2011 | 9.7 | ±0.2 | 1.16 | ±0.03 |
| 4 | Buluus | 2012 | 9.8 | ±0.2 | 1.16 | ±0.03 |
| 5 | Ulakhan-Taryn B | 2011 | 6.7 | ±0.2 | 0.79 | ±0.02 |
| 6 | Ulakhan-Taryn C | 2011 | 1.0 | ±0.1 | 0.12 | ±0.01 |
| 7 | Ulakhan-Taryn E | 2011 | 2.1 | ±0.1 | 0.25 | ±0.02 |
| 8 | Eruu | 2011 | 11.1 | ±0.2 | 1.32 | ±0.02 |
| 9 | Michita | 2009 | 16.1 | ±0.2 | 1.92 | ±0.03 |
| 10 | Michita | 2010 | 16.8 | ±0.2 | 2.00 | ±0.03 |
| 11 | Michita | 2011 | 16.7 | ±0.2 | 1.98 | ±0.03 |
| 12 | Michita | 2012 | 15.4 | ±0.2 | 1.83 | ±0.02 |
Figure 3 shows the 3H concentration of 2011 samples, together with a time series of concentrations in precipitation samples collected at 21 sites in the Northern Hemisphere, obtained by GNIP (Global Network of Isotopes in Precipitation) mission of IAEA (International Atomic Energy Agency). The 3H concentration of precipitation at Yakutsk was around 100 TU in 1980 and 20 TU in 2000, and it was higher than that of Ottawa in Canada. This might be because Yakutsk is at a higher latitude, not far from the nuclear testing sites of the former Soviet Union. Although recent 3H concentrations in precipitation at Yakutsk were not recorded, a value of around 16 TU can be estimated from its declining trend from the 1970s to the 2000s.
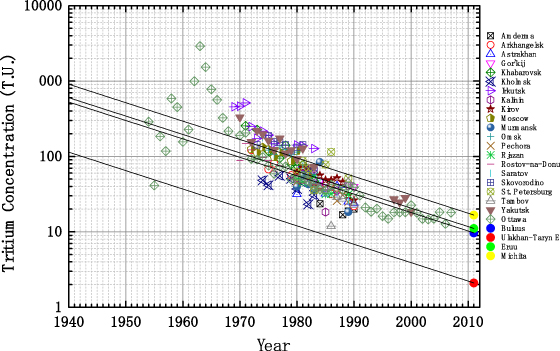
Figure 3. Tritium concentration (TU) of spring water samples obtained at four discharge points. Four lines, which were drawn using the half-life (12.3 years) of tritium, show the dating trend of spring water at the four sites. Also shown are the time series of tritium concentration in precipitation obtained at 21 sites of the northern hemisphere. The data were obtained by GNIP in IAEA (www-naweb.iaea.org/napc/ih/IHS_resources_gnip.html).
Download figure:
Standard image High-resolution imageThe lines in figure 3 show the dating trends of spring water, which were drawn using the half-life (12.3 years) of 3H. Where precipitation intersects 3H concentration, it indicates the apparent recharge year of the spring water. As shown in figure 3, the Michita water seems to have been recharged by very recent precipitation.
3H concentrations at Buluus and Eruu intersected with precipitation values at Yakutsk from 1970 to 2010. Thus, those springs may have mostly originated from precipitation that recharged the aquifer after the nuclear testing period of the 1960s. If we assume that groundwater pathways in talik zone have a piston-like flow, the ages of the Buluus and Eruu spring water can be estimated to be about 1–40 years old. However, because the 3H concentrations of both samples were not significantly higher than those of precipitation at Yakutsk, the water of Buluus and Eruu may contain older precipitation recharged before nuclear testing.
The 3H concentration at Ulakhan-Taryn was different from the other spring sites, and it was the lowest value compared to Buluus, Eruu and Michita (table 1). It did not intersect with the 3H concentration of precipitation after the nuclear testing era (figure 3). As the concentration of the Ulakhan-Taryn samples was clearly lower than that of precipitation that fell after the 1960s, it may have been recharged mostly by precipitation before the 1960s. If we set the 3H concentration of precipitation after the 1960s at 16 TU (the current value at Yakutsk), and that before the 1960s as 0.5 TU (the concentration of the 1950s), the percentages of precipitation recharge before the 1960s to the Ulakhan-Taryn spring water are 95% for the Ulakhan-Taryn C and 90% for the Ulakhan-Taryn E. If we assume that groundwater pathways have a piston-like flow, the recharge year of the spring water can be estimated as 1955, i.e., the age of the groundwater is 55 years.
4.2. Groundwater age estimation using CFCs and SF6
The concentrations of CFCs and SF6 are shown in table 2. The concentration differences among sampling years were also small for Buluus and Michita. Thus the method of preservation of the 2009 samples produced no issues in terms of analyzing concentrations or estimating groundwater age using CFCs and SF6.
Table 2. CFCs and SF6 concentrations of spring water samples.
| No. | Name of samples | Year | CFCs (pg kg−1) | SF6 (fmol kg−1) | ||
|---|---|---|---|---|---|---|
| CFC-12 | CFC-11 | CFC-113 | ||||
| 1 | Buluus | 2009 | 117 | 179 | 14 | 3.30 |
| 2 | Buluus | 2010 | 109 | 160 | 12 | 3.75 |
| 3 | Buluus | 2011 | 125 | 167 | 24 | 3.06 |
| 4 | Buluus | 2012 | 135 | 162 | 17 | 4.26 |
| 5 | Ulakhan-Taryn B | 2011 | 45 | 1 | 0 | 2.48 |
| 6 | Ulakhan-Taryn C | 2011 | 16 | 2 | 0 | 1.71 |
| 7 | Ulakhan-Taryn E | 2011 | 33 | 3 | 0 | 2.24 |
| 8 | Eruu | 2011 | 48 | 0 | 0 | 2.13 |
| 9 | Michita | 2009 | 451 | 786 | 88 | 3.43 |
| 10 | Michita | 2010 | 484 | 861 | 94 | 4.41 |
| 11 | Michita | 2011 | 498 | 1291 | 127 | 4.78 |
| 12 | Michita | 2012 | 487 | 912 | 95 | 5.67 |
Although CFCs concentrations were low, CFC-12 was detected at all sites. Three kinds of CFCs (CFC-12, CFC-11, CFC-113) were detected at Buluus and Michita whereas CFC-113 was not detected at Ulakhan-Taryn and Eruu springs. This may have been caused by deoxidizing conditions at Ulakhan-Taryn and Eruu (under deoxidizing conditions, methane-producing bacteria appear to remove dissolved CFC-11 and CFC-113 (Happell et al 2003)). Indeed, gas chromatography analysis detected CH4 at the Ulakhan-Taryn and Eruu, which is associated with deoxidization. In contrast, because three kinds of CFCs were detected at Buluus and Michita, microbial degradation likely plays a smaller role at both springs. This means the groundwater age could be estimated more reliably at Buluus and Michita.
The concentration of SF6 ranged from 1.71 to 5.67 fmol kg−1, and was higher at Michita and Buluus than at Ulakhan-Taryn and Eruu. This result is similar to that of the CFCs analysis, suggesting that the groundwater age of the Buluus and Michita springs is younger than that of the Ulakhan-Taryn and Eruu springs.
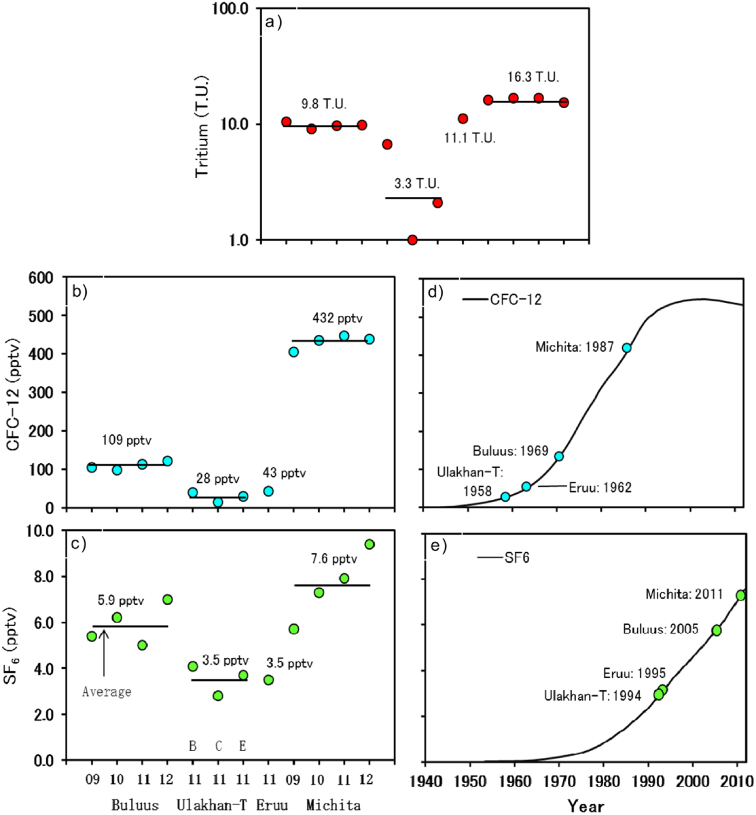
The equivalent air concentration (EAC) of the three CFCs and the SF6 was calculated using Henry's solubility law (e.g., Warner and Weiss 1985), in which the solubility potentials of CFCs and SF6 depend on the air temperature and air pressure when the precipitation fell. Current annual mean air temperature in the region is −8.9 ° C. However, because the water should be recharged above 0 ° C, representative value of the temperature was assumed to be 0 ° C. Mean surface elevation of the recharge area was assumed to be 150 m based on the topography map. Calculated EACs are shown in table 3. Figure 2(b) compares these EACs to the historical record of atmospheric concentrations reported in NOAA (National Oceanic and Atmospheric Administration), USA. The estimated recharge years based on the EACs of CFCs and SF6 are also shown in table 3. If we assume piston-like groundwater flow, it is possible to estimate the age of the groundwater. As shown in table 3 and figure 4, the estimated recharge years using the CFCs method were from around 20 to 40 years older than those using SF6. This may be associated with the characteristics of SF6 as a transient tracer. This issue is discussed in detail in section 5.
Table 3. EACs (equivalent air concentrations) of CFCs and SF6. Estimated recharge years are also shown.
| No. | Name of samples | Year | Equivalent air concentration (EAC: pptv) | Estimated recharge year | ||||||
|---|---|---|---|---|---|---|---|---|---|---|
| CFC-12 | CFC-11 | CFC-113 | SF6 | CFC-12 | CFC-11 | CFC-113 | SF6 | |||
| 1 | Buluus | 2009 | 105 | 35 | 6 | 5.4 | 1968 | 1967 | 1970 | 2004 |
| 2 | Buluus | 2010 | 98 | 31 | 5 | 6.2 | 1968 | 1966 | 1969 | 2007 |
| 3 | Buluus | 2011 | 113 | 32 | 11 | 5.0 | 1969 | 1966 | 1975 | 2002 |
| 4 | Buluus | 2012 | 121 | 31 | 7 | 7.0 | 1969 | 1966 | 1973 | 2009 |
| 5 | Ulakhan-Taryn B | 2011 | 40 | 0 | 0 | 4.1 | 1961 | 1947 | 1953 | 1997 |
| 6 | Ulakhan-Taryn C | 2011 | 14 | 0 | 0 | 2.8 | 1954 | 1949 | 1953 | 1992 |
| 7 | Ulakhan-Taryn E | 2011 | 30 | 1 | 0 | 3.7 | 1959 | 1959 | 1953 | 1995 |
| 8 | Eruu | 2011 | 43 | 0 | 0 | 3.5 | 1962 | 1946 | 1953 | 1995 |
| 9 | Michita | 2009 | 406 | 151 | 38 | 5.7 | 1985 | 1978 | 1984 | 2005 |
| 10 | Michita | 2010 | 435 | 166 | 41 | 7.3 | 1987 | 1980 | 1985 | 2010 |
| 11 | Michita | 2011 | 448 | 249 | 55 | 7.9 | 1987 | 1988, 2006 | 1987 | 2011 |
| 12 | Michita | 2012 | 438 | 176 | 41 | 9.4 | 1987 | 1980 | 1985 | N/A |
Figure 4. Comparison of the tritium concentration (a), EACs (equivalent air concentrations) of CFC-12 (b) and SF6 (c) of the spring water samples (see tables 1 and 3). Also shown are the estimated apparent ages of the spring water samples based on CFC-12 (d) and SF6 (e). Time series of the atmospheric concentrations of CFC-12 (d) and SF6 (e) were the same as in figure 2.
Download figure:
Standard image High-resolution image
5. Discussion
Comparison of apparent groundwater ages estimated from the three different tracers (3H, CFCs, and SF6) showed that the relative order of apparent ages was consistent each other. The apparent age was the oldest in Ulakhan-Taryn, and then Eruu and Buluus followed by Michita. Comparing figures 3 and 4, it can be suggested that the CFCs-based ages (especially CFC-12 ages) were similar to the values of the 3H-based ages. SF6-based ages, however, were significantly younger than 3H-based and/or CFC-12-based ages.
Because it could be assumed that the 3H-based ages are correct, the following three points could be made based on the CFCs and SF6 characteristics: (1) the ages based on CFC-12 are reliable, because they are similar to the 3H-based ages, and they appear to be the least affected by microbial degradation (as described in section 4.2); (2) the SF6 concentration might have increased mainly due to the mixture of SF6 from basement rock with permafrost groundwater, which would cause a younger estimate of SF6-based groundwater age; (3) and also due to excess air, redundant SF6 may have dissolved into the recharging water, leading to overestimated SF6 levels and thus younger groundwater ages. Regarding the second point, the basement rock of the study area consists of carbonate sedimentary rocks (limestone, dolomite, and marl) of Cambrian age, which may not introduce SF6 to the permafrost groundwater. However, it is difficult to completely deny the possibility of introduction of SF6. The third point is relevant at three spring sites because the recharge areas include open lakes and talik water. Hence, the effects of dissolution into open water surfaces (e.g., Heaton and Vogel 1981) should be carefully considered. We assumed here that SF6 shows stronger effects of dissolution than CFCs. We suggest that careful attention should be paid to this potential effect when using SF6 as a transient tracer in the permafrost region.
As shown in tables 1 and 3, the 3H-based ages and the CFC-12-based ages at Ulakhan-Taryn springs varied widely. This is because we applied a simple piston-like flow scheme to the groundwater system, and the samples were a mixture of supra-permafrost and intra-permafrost groundwater. It was not possible to separate these two types of permafrost groundwater in this study. Nevertheless, it should be noted that large variability in the concentrations of 3H and CFC-12 at Ulakhan-Taryn indicates unstableness of groundwater pathways and its recharge sources. Because soil pore ice was found below the active layer, i.e. between the active layer and the upper boundary of the intra-permafrost groundwater aquifer in this area, melted pore ice could be contributed to the source of the spring water at Ulakhan-Taryn. If recent global warming causes permafrost degradation at this site, it could drive changes of groundwater recharge source as well as changes of recharge rates, increasing contribution from the melting of ground ice.
In this study, by the use of multi-transient tracers, we found that 3H and CFC-12 are both valid for estimating groundwater age in eastern Siberia. Because the permafrost taliks in the cryolithozone hold special kinds of groundwater, 3H and CFC-12 could be used to assess the intra-permafrost and supra-permafrost groundwater and to assess the permafrost vulnerability to a changing climate. The next step related to the present study would be to separate out the age estimations for supra-permafrost and intra-permafrost water. This analysis would allow estimation of the contribution ratio of supra- and intra-permafrost groundwater for both springs. The analysis would require analyzing intra-permafrost groundwater during the winter, as most of the supra-permafrost groundwater would be completely frozen.
6. Conclusions
The application of transient tracers to estimate the residence time of permafrost groundwater is challenging. Because recent observations of soil temperature/moisture have shown an abrupt increase in active layer (thawing) depth after 2006 (Ohta et al 2008, Iijima et al 2010), continuous measurements of supra-permafrost and intra-permafrost groundwater are also essential for permafrost hydrology. If global warming causes permafrost degradation and changes groundwater recharge rates, hydrological tracers would be useful tools for estimating residence time. Such quantitative evaluation and continuous measurements and/or analyses would make it possible to assess the vulnerability of the cryolithic water environment. This study is the first attempt to apply transient tracers such as 3H, CFCs, and SF6 to the estimation of groundwater age in a permafrost zone.
The apparent ages of the mixture of supra-permafrost and intra-permafrost groundwater in the middle of the Lena River basin were estimated to be 1–55 years old. Interestingly, the spring water at Ulakhan-Taryn appeared to contain more than 90% water recharged by precipitation before the 1960s nuclear testing era. Because soil pore ice was found below the active layer around the site, melted ice could be contributed to the source of the spring water. If recent global warming causes permafrost degradation in the region, it could drive changes of groundwater recharge source as well as the rates, especially increasing the contribution from thawing permafrost.
The results of the groundwater ages estimated from different tracers imply that 3H and CFC-12 are the most applicable to groundwater vulnerability assessments in this region. Because the apparent age is a mixture of those from supra-permafrost and intra-permafrost groundwater, the next step would be to assess the contribution ratio of the two types of groundwater. This would require taking intra-permafrost groundwater during the winter, as most of the supra-permafrost groundwater would be completely frozen.
Acknowledgments
This study was supported by Research Project No. C-07 of the Research Institute for Humanity and Nature (RIHN), entitled 'Global Warming and the Human–Nature Dimension in Siberia: Social Adaptation to the Changes of the Terrestrial Ecosystem, with an Emphasis on Water Environments' (P.I.: TH). The authors wish to express their thanks to Dr Yuji Kodama of the Arctic Environment Research Center, National Institute of Polar Research (NIPR), Japan, Dr Kazuhiro Oshima of the Research Institute for Global Change, Japan Agency for Marine-Earth Science and Technology (JAMSTEC), Japan, and Dr Nakako Kobayashi of the Hydrospheric Atmospheric Research Center (HyARC), Nagoya University, Japan, for their collaborative field work. Finally, we sincerely thank Dr Alexander N Fedorov of the MPI and Ms Hiromi Shimizu of the RIHN, for their collaborative work in the project.