
Abstract
The responses of tree growth to recent climate warming may signal changes in the susceptibility of forest communities to compositional change and consequently impact a wide range of ecosystem processes and services. Previous research in the boreal forest has largely documented negative growth responses to climate in forest species and habitats characteristic of drier conditions, emphasizing the sensitivity of drier or warmer landscape positions to climate warming. In this study, we explored relationships between climate and tree-ring growth of black spruce, a dominant tree species typical of cool and moist habitats in the boreal forests of North America. We assessed how these responses varied with stand characteristics and landscape position across four different regions in Alaska and Yukon Territory. Approximately half of the trees measured across regions and topographic gradients exhibited reduced radial growth in response to warm temperatures in the previous growing season and current spring, which we interpret as a signal of drought stress. Although we found considerable variation in the growth responses of individual trees within sites, landscape position and stand characteristics were weak predictors of this variability, explaining ≦̸12% of the variation in any region. Our results indicate that future warming, particularly in spring, is likely to result in drought stress and a reduction of black spruce radial growth independent of region, landscape position, or stand characteristics. The occurrence of negative growth responses to temperature, even in cool and moist habitats, suggests that drought stress limitations may be more widespread in the northern boreal forest than previously anticipated, indicating broad sensitivity of ecosystem processes and services to climate change across a diverse range of habitat types.
Export citation and abstract BibTeX RIS

Content from this work may be used under the terms of the Creative Commons Attribution 3.0 licence. Any further distribution of this work must maintain attribution to the author(s) and the title of the work, journal citation and DOI.
1. Introduction
Global temperature has increased over the past 100 years at an unprecedented rate (IPCC 2013). This warming has not been uniform. Northern high latitude ecosystems, where the boreal forest resides, have warmed at nearly twice the rate of the global average, particularly during the last 30 years (ACIA 2005, IPCC 2013). This warming is estimated to have had substantial impacts on boreal forest productivity and tree growth (Beck et al 2011, Lloyd and Bunn 2007). As radial growth is strongly linked to climate, the study of annual tree rings is useful for understanding historical tree growth responses to climate (Fritts 1976). Changes in tree growth may signal changes in the susceptability of forest communities to compositional change and consequently impact ecosystem processes and services (Allen et al 2010, Soja et al 2007). Thus, examining past responses of tree growth to climate variability enhances our capacity to predict future changes in boreal forest vegetation as climate continues to change.
Declining tree productivity has been detected in observational studies throughout the boreal forest of interior Alaska (Beck et al 2011) and Canada (Ma et al 2012), and in satellite-based studies across larger regions (Beck and Goetz 2011, Lloyd et al 2011, Verbyla 2011). However, signals of declining tree productivity are less frequent in the northern, colder portions of latitudinal climate gradients (Lloyd and Bunn 2007, Lloyd et al 2011), or in more humid, maritime climate zones (Juday and Alix 2012, Wilmking and Juday 2005). These patterns are consistent with the hypothesis that negative responses of tree growth to warming is caused by temperature induced moisture stress, or drought stress (Barber et al 2000, D'Arrigo et al 2008). For example, mean annual air temperatures in interior Alaska have increased by 1.9 °C over the past 50 years (Karl et al 2009), while annual precipitation has remained relative constant (Hinzman et al 2005). Negative impacts of this warming on boreal tree growth have been associated with species occupying warmer and drier habitat conditions (e.g. Barber et al 2000, Juday and Alix 2012, Wilmking and Juday 2005) and are less frequent among trees growing in moister landscape positions (Johnstone et al 2010, Wilmking and Myers-Smith 2008). This suggests that forest sensitivity to climate warming may depend on local moisture availability (Lloyd and Bunn 2007). Understanding the importance of local context in driving patterns of climate sensitivity is essential for developing an integrated landscape perspective of ecosystem resilience to climate change.
Picea mariana (Mill.) B.S.P. (black spruce) is a dominant tree species in the boreal forests of North America, yet its radial growth response to recent climate change is poorly documented, particularly in rapidly warming regions of western Canada and Alaska (Hinzman et al 2005). Black spruce grows in a range of edaphic conditions, but is typically found on cold, wet, and nutrient poor soils associated with north-facing slopes and lowlands underlain with permafrost (Viereck et al 1983). As low soil temperatures restrict nutrient availability and tree growth (Viereck et al 1983), black spruce forests might respond favorably to recent climate warming. In contrast, if moisture is limiting at drier and warmer sites, then growth at these sites should respond negatively to warming due to temperature induced moisture stress. For example, black spruce in the Tanana flats of interior Alaska showed low sensitivity of radial growth to climate at peatland sites, while trees in higher ground exhibited signals of drought stress (Wilmking and Myers-Smith 2008). As the distribution of black spruce includes some of the coolest and wettest conditions in the boreal forest, this species provides an excellent system to test the hypothesis that changing constraints on resource availability from temperature- to moisture-limitation across environmental gradients will lead to corresponding changes in the sensitivity of tree growth to climate (Lloyd and Bunn 2007).
We tested the effect of environmental gradients on the sensitivity of tree growth to climate by examining growth-climate relationships of black spruce trees throughout the northwestern boreal forest. Our approach explicitly incorporated different scales at which environmental parameters may control growth responses, including regional scale variation in climate conditions such as temperature and precipitation; landscape scale variations caused by topographic gradients in elevation, aspect, and slope; and stand scale factors such as tree density and size that influence the local tree environment (Wilmking and Juday 2005). Traditional dendroclimatology methods consist of building a site chronology by averaging annual ring width measurements of numerous trees within a site and evaluating the chronology's response to climate parameters (Cook and Kairiukstis 1990). However, opposing tree growth responses (increasing or decreasing) to temperature can occur within a given sample site (Wilmking et al 2004, Wilmking and Juday 2005). Here, we analyzed growth-climate responses of individual trees within a site and use both multivariate statistics and traditional dendroclimatology methods to determine how responses varied between landscape positions and regions. Changes in tree growth in response to climate warming may be a key indicator of future alterations in ecosystem processes and services across heterogeneous forest landscapes (Allen et al 2010, Soja et al 2007).
2. Methods
2.1. Field and laboratory methods
In the summer of 2012, we established 36 sites in Alaska, USA and 12 sites in Yukon Territory, Canada in areas with abundant black spruce forest. Sites were located in four regions along the (1) Steese, (2) Dalton, and (3) Taylor Highways in interior Alaska and (4) along the Dempster Highway in northern Yukon Territory (figure 1). The four study regions differ in terms of annual and monthly climate conditions (figure 2); the Dalton region is relatively cool and dry, the Dempster region cool and moist, the Steese region warm and moist, and the Taylor region warm and dry. Sites were established in pure black spruce stands located within large, recent fire scars dating from 2004 or 2005, to enable planned comparisons between pre-fire tree growth and post-fire regeneration. Site selection was stratified based on broad scale topographic positions affecting drainage (moisture) and incident solar radiation (temperature) (Viereck et al 1983). Within each region, three sites were selected to represent each category of (1) wet and flat, (2) north-facing midslope (cool), (3) south-facing midslope (warm), and (4) dry and flat positions. Sites in the Steese and Taylor regions have coarse soils and are relatively well drained, whereas a thick cap of fine-grained loess characterizes soils in the Dalton and Dempster regions. The majority (75–80%) of the boreal forest throughout these regions is underlain by permafrost (Osterkamp and Romanovsky 1999), with the exception of south-facing slopes and floodplains near major rivers (Viereck et al 1983).
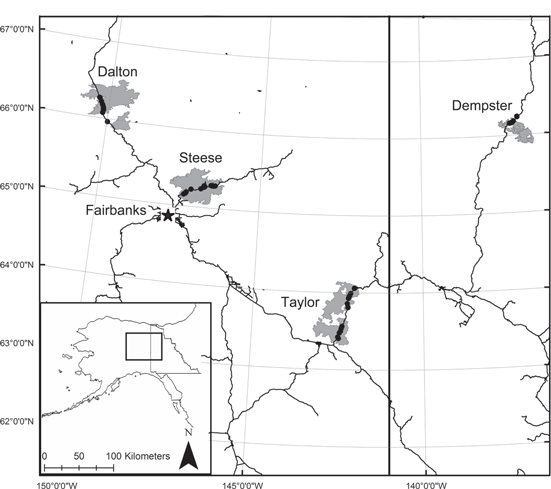
Figure 1. Location of 48 study sites (black dots) within four regions of recently burned forest (gray), along the Dalton, Steese, and Taylor Highways in interior Alaska and the Dempster Highway in Yukon Territory.
Download figure:
Standard image High-resolution image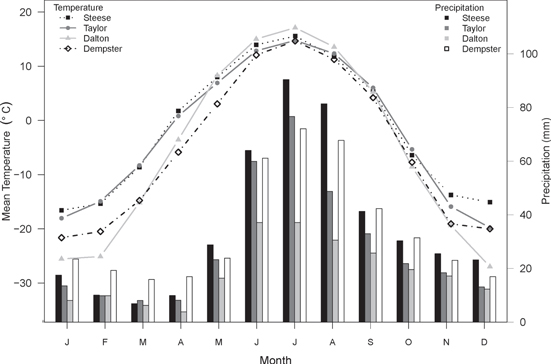
Figure 2. Mean monthly temperature (points) and total monthly precipitation (bars; averaged over the period 1974–2003) for each of the four regions examined in this study. Climate data were obtained from the Scenarios Network for Alaska and Arctic Planning (2013).
Download figure:
Standard image High-resolution imageAt each site, we characterized topographic and soil characteristics, and measured the structure and composition of the pre-fire stand (table S1). We recorded latitude, longitude, elevation, slope, and aspect, and used these variables for subsequent calculation of insolation, an index of solar radiation received at a site on the summer solstice (as per Bennie et al 2006). Soil pH was measured in the field for three random samples of near surface mineral soil (A horizon), using an electronic pH meter (Hanna Instruments) and 1 : 1 dilution with de-ionized water. Moisture classes, based on topography-controlled drainage and adjusted for soil texture, were assigned to each site on a six-point scale, ranging from xeric to subhygric (Johnstone et al 2008). Within each site, we measured the diameter at breast height (DBH) of all the pre-fire trees (>1.4 m in height) originally rooted within two parallel 2 m × 30 m belt transects to calculate stand basal area (m2 ha−1 of trees >1.4 m in height). At each site, we collected stem disks at the standard height of 1.4 m from ten randomly selected pre-fire black spruce trees along two belt transects. In the laboratory, the disks were sanded with increasingly finer sandpaper (up to 400 grit) to produce visible rings. Annual rings widths were measured (resolution 0.001 mm) on two radii per stem disk using WinDENDRO software version 2012c (Regent Instruments 2012).
2.2. Statistical analysis
To prepare the ring width measurements for growth-climate analyses, we visually cross-dated each tree-ring series against master chronologies developed for each site and region. We quality-checked our cross-dating using COFECHA version 6.06 (Grissino-Mayer 2001). Successfully dated ring-width series were analyzed in R version 3.0.2 (R Development Core Team 2011). Non-climatic trends in ring growth were removed by detrending raw ring widths with a smoothing spline, with a frequency response of 0.5 at a wavelength of 0.67 × n years (Zang 2010) in the package'dplR, version 1.5.7' (Bunn 2010). This detrending option is known to remove variances of low frequencies (i.e. longer wavelengths) with little or no removal of variance of high frequencies (i.e. shorter wavelengths) (Cook and Holmes 1996). Dividing actual ring-widths by the curve-fitted value in each year produced a dimensionless width index for each series (Bunn 2010, Cook and Briffa 1990). Individual tree chronologies were constructed by averaging the two detrended ring-width series for each tree.
We determined the growth-climate response of individual trees by calcualting bootstrapped correlations between ring widths and mean monthly temperatures and total monthly precipitation for 1975–2003 using the package 'bootRes, version 1.2.3' (Zang 2010). We chose to analyze growth-climate responses over this 30-year period to maximize the number of trees to include in the analysis and to circumvent the divergence problem (D'Arrigo et al 2008). We used downscaled climate data from SNAP (Scenarios Network for Alaska and Arctic Planning 2013) to provide climate records for each of the four regions examined in this study (see supporting information). We calculated growth-climate correlations using a 17-month climate window, extending from April of the year preceding growth to August of the current year of growth (Fritts 1976). The significance of each of the 34 climate correlations was determined from 95% confidence intervals (Zang 2010).
We grouped trees within each region according to their dendroclimatic responses through a hierarchical agglomerative cluster analysis (HCA) using Euclidean distances and Ward's linkage method in the package 'vegan, version 2.0–10' (Oksanen et al 2013). HCA begins with each object (individual trees in this case) in a separate cluster and then joins objects into groups based on their similarity (growth-climate correlations in this case) (Legendre and Legendre 2012). The outcome is a grouping in which trees that are in the same cluster resemble each other in terms of their dendroclimatic responses. Long stems indicate natural groups in the dendrogram; consequently, we examined branch length to identify the optimal number of clusters (Legendre and Legendre 2012). We characterized the growth-climate responses of each HCA groups by calculating the average correlation between individual chronologies in a group and the climate variables representing mean monthly temperature and total precipitation over 17 months. Significance of average correlations was based on 95% confidence intervals.
We completed a simple redundancy analysis (RDA) (Legendre and Legendre 2012) in 'vegan' to determine whether environmental and stand variables collected at each site (table S1) could explain the observed variability in dendroclimatic responses. We included geographic coordinates in the explanatory matrix to account for spatial non-independence, and tree DBH to capture any size-related effects. RDA is an ordination technique based on a multiple linear regression model, which relates the variability in multivariate responses to a set of explanatory variables (Legendre and Legendre 2012). To identify the individual variables within the explanatory dataset that were significantly associated with variation in dendroclimatic responses, we ran a stepwise forward selection, using model adjusted R2 and variable retention at a permutation value of 0.05 (Blanchet et al 2008). The significant variables from this selection process were retained for the RDA.
To visualize multivariate differences in dendroclimatic responses among the groups obtained from the HCA, we performed a principle component analysis (PCA) using the package 'labdsv, version 1.6-1' (Roberts 2013). We explored which environmental and stand variables were associated with the variance in dendroclimatic responses by calculating vectors overlays of explanatory variables in 'vegan'. The significance of the fitted vectors was determined using 999 permutations of the explanatory variables and tested using the 95 percentile range. We then plotted the significant vectors (p < 0.05) as radiating lines from the centroid of PCA ordination scores, where the angle and length of the vectors indicate the direction and strength of the relationship (McCune and Grace 2002). Additionally, we plotted the proportion of individuals for each site type belonging to each climate response group defined by the HCA.
To assess how site types varied in their growth responses to climate, we took a more traditional dendrochronology approach and created mean chronologies based on topographic classes (dry flat, wet flat, north facing slope, and south facing slope) in the package 'dplR, version 1.5.7' (Bunn 2010). General chronology statistics of mean correlation between trees (R), mean sensitivity, signal to noise ratio, autocorrelation, and expressed population signal for each of the standard chronologies developed per site type and region were calculated to ensure that all the chronologies were suitable for growth-climate analyses (Speer 2010). We then determined the growth-climate responses of each site type using the same methods as for individual chronologies (see above).
3. Results
Two distinct groups of growth-climate responses were identified by the HCA in each region (figures 3(a)–(d)). Slightly more than half of the trees were classified as 'Group 1' in the Taylor, Dalton, and Dempster regions (53.9, 53.2, and 57.3% respectively). In contrast, more trees (58.9%) were classified as 'Group 2' in the Steese region. 'Group 2' trees from all four regions had ring-width chronologies that were consistently and negatively associated with temperature variables (figures 3(e)–(h)), thus we refer to these trees as 'negative responders'. Negative responders across all regions showed consistent negative correlations between growth and temperature in the current April, current May, and previous July. Correlations between temperature variables and 'Group 1' trees were not consistent between the four regions. This group showed positive responses to current summer temperatures in the Steese (figure 3(e)) and Dalton (figure 3(g)) regions, and negative responses to winter temperatures in the Steese (figure 3(e)), Dalton (figure 3(g)), and Dempster (figure 3(h)) regions. Further, positive correlations between 'Group 1' trees and previous growing season temperatures were found for trees along the Dempster (figure 3(h)). As 'Group 1' trees did not consistently respond to temperature among the different regions, unlike the 'Group 2' negative responders, we refer to them as 'mixed responders'. This naming reflects the lack of consistent, significant correlations detected between growth of 'Group 1' trees and spring and summer temperatures.
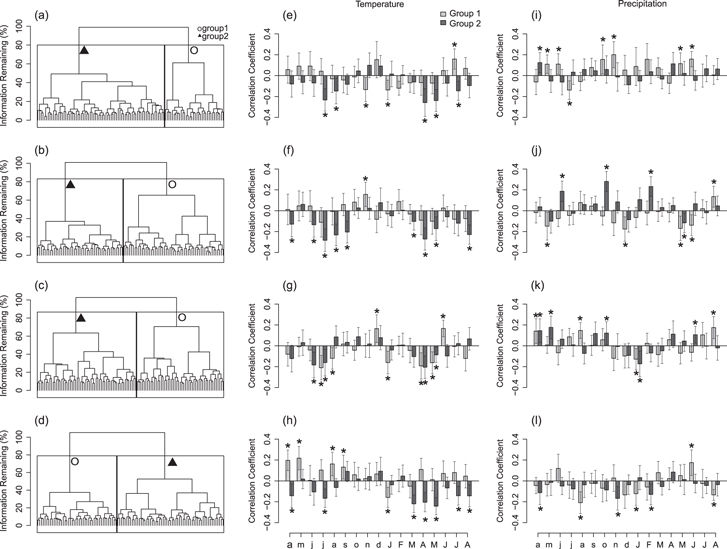
Figure 3. Hierarchical agglomerative clustering analysis (HCA) dendrograms and average correlations between mean monthly temperature and precipitation for trees in the Steese (a, e, i), Taylor (b, f, j), Dalton (c, g, k), and Dempster (d, h, l) regions. Dendrograms separate (a) 107 trees, (b) 102 trees, (c) 109 trees, and (d) 103 trees into two distinct groups based on dendroclimatic correlation coefficients. Length of nodes represents distinctness of groups. Individual tree ring width series from group 1 (light gray) and group 2 (dark gray), defined by the HCA, were used to calculate average correlations between mean monthly temperature and precipitation over a 17 month climatic window. Y-axes in e−l represent correlation coefficients with 95% confidence intervals (* = significant) and X-axes represent months of year (lower case = year prior to ring formation, uppercase = year of ring formation).
Download figure:
Standard image High-resolution imageCorrelations with precipitation were more variable and not consistent among regions or groups. In the Steese (figure 3(i)) and Dalton (figure 3(k)) regions, 'Group 1' mixed responders were positively correlated to precipitation, whereas in the Taylor (figure 3(j)) and Dalton (figure 3(l)) regions, mixed responders were predominantly negatively correlated with precipitation throughout the year. Correlations with precipitation and 'Group 2' negative responders were highly variable: few correlations were observed in the Steese (figure 3(i)) and Dalton (figure 3(k)) regions, positive correlations with previous growing season and winter precipitation were observed in the Taylor region (figure 3(j)), and negative correlations with winter temperatures were observed in the Dempster region (figure 3(k)).
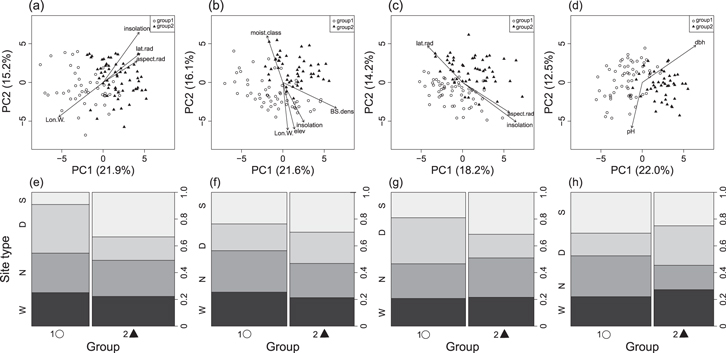
Negative and mixed responders were located in all of the topographic classes we sampled across all four regions, and were not strongly associated with the environmental and stand covariates that we measured. Stepwise selection of covariates chose two to four significant variables for each region (table 1). RDA ordination of dendroclimatic responses constrained by these covariates indicated that the measured environmental variables explained a small portion of the variation in dendroclimatic responses, e.g. between 6.1 and 12.1% of the variation in growth-climate responses within each region (table 1 and table S2). The PCA correlation biplot of dendroclimatic responses overlaid with vectors of significant covariates suggests that there were some associations between environmental variables and groups defined by the HCA, but these associations were not consistent among regions (figure 4). The proportion of individuals in each of the HCA response groups did not consistently vary across topographic classes (figure 4). However, there was some indication that negatively responding trees dominated south facing slopes in interior Alaska, particularly in the Steese region. In contrast, in the Dempster region, we observed a slight tendency for negatively responding trees to be found on north facing slopes or wet lowlands (figure 4).
Table 1. Environmental and stand covariates selected by forward stepwise selection for redundancy analysis. The order of variable selection is shown. Individual R2 of each individual variable is based on RDA analyses with only the single covariate included. The total variation is for the full RDA model with all selected covariates included.
| Highway | Variables | R2 | Order selection |
|---|---|---|---|
| Steese | Insolation | 0.062 | 1 |
| Longitude | 0.053 | 2 | |
| Total variation | 0.087 | ||
| Taylor | Black Spruce density | 0.042 | 1 |
| Moisture class | 0.034 | 2 | |
| Total variation | 0.061 | ||
| Dalton | Latitude | 0.032 | 1 |
| Slope | 0.025 | 2 | |
| Aspect | 0.022 | 4 | |
| Black Spruce density | 0.026 | 5 | |
| Total variation | 0.121 | ||
| Dempster | DBH | 0.041 | 1 |
| Soil pH | 0.031 | 2 | |
| Elevation | 0.013 | 3 | |
| Total variation | 0.089 | ||
Figure 4. Principal component analysis (PCA) correlation biplot of dendroclimatic responses overlaid by the significant vectors of environmental covariates. Separate panels show trees sampled in the (a) Steese, (b) Taylor, (c) Dalton, (d) and Dempster regions. Points represent individual trees belonging to each group (Group 1 = mixed responders (O), Group 2 = negative responders (▲)). The lower panels show the proportion of individual trees associated with each topographic class (S = south, N = north, D = dry, W = wet) belonging to each group, in the (e) Steese, (f) Taylor, (g) Dalton, and (h) Dempster regions.
Download figure:
Standard image High-resolution image
Standard, averaged chronologies based on site types within regions produced chronology statistics indicating they were suitable for climate analysis (table 2). Within the interior Alaska regions, these chronologies demonstrated a negative growth response to previous growing season temperature (July) and current spring temperatures (April and May) at most site types (figure S1). Radial growth responses of trees to temperature in the Dempster region did not follow a similar pattern to trees in interior Alaska; they responded negatively to previous August and December precipitation and did not show consistent temperature responses across site types (figure S2).
Table 2. Statistics of mean correlation between trees (R), mean sensitivity (MS), signal to noise ratio (SNR), autocorrelation (AR), and expressed population signal (EPS) for each of the standard chronologies developed per topographic site class and region.
| Regions | Site class | #Trees | R | MS | SNR | AR | EPS |
|---|---|---|---|---|---|---|---|
| Steese | South facing slope | 25 | 0.576 | 0.194 | 33.962 | 0.223 | 0.917 |
| North facing slope | 27 | 0.331 | 0.186 | 13.359 | 0.311 | 0.713 | |
| Dry-flat | 29 | 0.330 | 0.173 | 14.284 | 0.251 | 0.707 | |
| Wet-flat | 25 | 0.460 | 0.214 | 21.296 | 0.176 | 0.848 | |
| Taylor | South facing slope | 27 | 0.423 | 0.191 | 19.794 | 0.319 | 0.836 |
| North facing slope | 22 | 0.367 | 0.179 | 12.755 | 0.316 | 0.706 | |
| Dry-flat | 29 | 0.375 | 0.205 | 17.400 | 0.380 | 0.869 | |
| Wet-flat | 24 | 0.316 | 0.202 | 11.088 | 0.382 | 0.628 | |
| Dalton | South facing slope | 27 | 0.465 | 0.214 | 23.467 | 0.242 | 0.863 |
| North facing slope | 29 | 0.595 | 0.204 | 42.605 | 0.181 | 0.936 | |
| Dry-flat | 30 | 0.397 | 0.217 | 19.751 | 0.297 | 0.823 | |
| Wet-flat | 23 | 0.435 | 0.211 | 17.707 | 0.139 | 0.813 | |
| Dempster | South facing slope | 29 | 0.488 | 0.241 | 27.641 | 0.280 | 0.877 |
| North facing slope | 25 | 0.448 | 0.231 | 20.290 | 0.300 | 0.797 | |
| Dry-flat | 27 | 0.540 | 0.243 | 31.696 | 0.157 | 0.902 | |
| Wet-flat | 26 | 0.426 | 0.224 | 19.296 | 0.301 | 0.801 |
4. Discussion
The most common and consistent pattern of black spruce growth responses to climate was a negative response to warmer temperatures in the previous growing season and current spring. In contrast to our expectations, landscape position was a poor predictor of the variation in growth responses to climate in any of our studied regions. Previous studies have found that climate responses of boreal conifers varied within sites and the proportion of trees with negative responses to summer temperatures changed across longitudinal or latitudinal gradients of precipitation and temperature (Juday and Alix 2012, Lloyd et al 2011, Wilmking and Juday 2005), or across local moisture gradients (Johnstone et al 2010, Wilmking and Myers-Smith 2008). Thus, we expected that signals of temperature-induced drought stress in tree growth responses would vary among regions and topographic classes based on relative moisture availability. However, in interior Alaska, we found only weak evidence for our hypothesized association between negative temperature responses and warmer, drier landscape positions, and in the Yukon, negative responders showed a tendency to be associated with cooler and wetter landscape positions. Irrespective of topography, radial growth was typically negatively correlated with temperature variables and showed inconsistent responses to precipitation, except in the cool and moist Dempster region, where tree growth showed consistent negative associations with precipitation. Our results indicate that future warming, particularly in spring (April and May), may negatively influence the radial growth of black spruce trees across a broad region, and that this response is not ameliorated by local gradients in moisture availability. We discuss our results in terms of the heterogeneity in black spruce growth-climate responses we observed between regions, among landscape positions, and within sites.
The most widely accepted explanation for negative growth responses to warm spring and summer conditions is temperature-induced moisture stress (Barber et al 2000, Lloyd and Bunn 2007). Warmer temperatures during the previous growing season can result in a reduction of photosynthetic tissue, which limits radial growth the following year (Fritts 1976). Increased spring (April and May) temperatures may also induce drought stress through stimulation of photosynthesis and transpiration of evergreen foliage prior to soil thaw, when there is insufficient water transport from roots to support evaporative demands (Berg and Chapin 1994). Because moisture limitation is more likely in warmer and drier landscape positions (e.g. Lloyd and Bunn 2007), we expected to see negative temperature responses in upland and south-facing slopes, but were surprised to find these equally prevalent in cooler and wetter landscape positions. Studies of white spruce in Alaska have documented similar patterns of reduced tree growth in response to warm spring temperatures at cool and moist sites near treeline (Ohse et al 2012, Wilmking and Juday 2005). We hypothesize that negative temperature responses in cool and wet locations are associated with vertical patterns in the distribution of roots. Trees in cool and wet locations often have roots that are confined to shallow surface layers to avoid anaerobic and cold soil conditions in deeper soil layers (Islam and Macdonald 2004, LeBarron 1945). This rooting structure may render black spruce trees ineffective at water and nutrient uptake during periods when the active layer depth increases and the water table lowers (Dang and Lieffers 1989), particularly on north facing slopes where moisture may drain downslope as the active layer thaws (Jorgenson and Osterkamp 2005). Likewise, cooler landscape positions may experience delays in the timing of spring thaw, thus extending the risk of early season moisture deficits when roots are frozen (Berg and Chapin 1994).
Although there were widespread similarities in the pattern of black spruce radial growth responses to previous growing season and current spring temperatures, we did detect some regional differences in dendroclimatic responses. Specifically, radial growth in the Dempster region exhibited a consistent and negative response to fall and winter precipitation, whereas radial growth in interior Alaska was more strongly correlated with spring and summer temperature variables. These regional differences in dendroclimatic responses likely reflect different climatic constraints on tree growth among study regions. Specifically, the Dempster region was relatively cooler and wetter over the study period than the interior Alaska regions, and thus Dempster trees were more likely to experience conditions of adequate moisture during summer. Negative responses of Dempster trees to autumn and winter precipitation may reflect indirect effects on growth caused by mechanical damage from a heavy snow load. Additionally, precipitation that falls as snow has been linked to a delay in the start of the growing season and reduced radial growth (Vaganov et al 1999).
In this study, we used both multivariate statistics and traditional methods of tree ring analysis to explore black spruce growth-climate responses. The multivariate analysis indicated common patterns of negative growth responses to previous growing season and current spring temperatures, and highlighted the heterogeneity in growth-climate responses between individual trees within sites. This within site variability is often missed in standard dendrochronology studies, where individual tree chronologies are averaged together. Previous research examining individual tree growth of white spruce near treeline in Alaska found that growth responses to warming were positive, negative, or neutral and could not be predicted by landscape position or site type (Wilmking and Juday 2005). Our study expands upon this research to document variations in black spruce responses that were largely unrelated to topographic gradients in moisture availability for a species that dominates cool and moist environments within the contiguous boreal forest (Viereck et al 1983). Individual tree characteristics and their ability to compete for resources may explain some of the within site variability we detected. However, we found no relationship between growth-climate responses and factors likely to be associated with competition, such as stand density, tree age, and tree DBH. Within site variation in dendroclimatic responses could also be due to genetic variation between individuals (Wilmking and Juday 2005) or small-scale variability in soil conditions and nutrient availability (Pastor et al 1999). We did not address these possibilities but believe they warrant further investigation.
5. Conclusion
Our assessment of dendroclimatic responses within interior Alaska and northern Yukon suggests that the effects of continued warming on black spruce tree growth will largely be negative. Negative responses to spring and summer temperature were widespread, occurring at all landscape positions and in all regions. As black spruce is a dominant tree species in the boreal forest, its response to continued warming will play a key role in driving forest responses to climate change. Our results suggest that black spruce productivity is likely to decline across broad areas of boreal forest with continued warming. This response is apparent even in cool and moist environments that are expected to be resistant to temperature-induced drought stress (e.g. Lloyd and Bunn 2007), and where black spruce has dominated for millennia (Hu et al 1993). The widespread pattern of negative growth responses of black spruce to temperatures that we observed across topographic moisture gradients may be an important warning signal of broad-scale vulnerability of boreal forests to ongoing climate change.
Acknowledgements
This project was supported by funding from the Department of Defense's Strategic Environmental Research and Development Program (SERDP) under project RC-2109, the Natural Science and Engineering Research Council of Canada, and the Northern Scientific Training Program. We thank Fraser Baalim, Mathew Frey, and Scott Dudiak for assistance with fieldwork, Alix Conway for her mapping expertise, and everyone in the Northern Plant Ecology Lab at the University of Saskatchewan for their input and feedback at various stages of this manuscript. We thank Michelle Mack, Andrea Lloyd, Ben Bond-Lamberty, and Eric Lamb for comments and suggestions they provided on earlier versions of the manuscript.