
Abstract
The link between subsurface fluid injection and induced seismicity has gained recent significance with an increase in earthquakes associated with the disposal of oilfield waste fluids. There are obvious similarities between wastewater reinjection and proposed CO2 storage (CCS) operations. However, as well as the seismic hazard, induced seismicity during CCS operations poses additional risks, because an induced event located above the target reservoir could compromise the hydraulic integrity of the caprock. In this paper we re-examine case examples where earthquakes have been induced by wastewater injection into deep aquifers in the light of proposed future CCS operations. In particular we consider possible controls on event magnitudes, and look at the spatial distributions of events. We find that the majority of events are located below the target reservoirs. This is an encouraging observation from the perspective of caprock integrity, although it presents a challenge in terms of pre-injection characterization of deep-lying faults several kilometres below the target zone. We observe that 99% of events are found within 20 km of injection wells, suggesting a minimum radius for geomechanical characterization and monitoring. We conclude by making recommendations for modelling and monitoring strategies to be followed prior to and during commercial-scale deployment of CO2 storage projects.
Export citation and abstract BibTeX RIS

Content from this work may be used under the terms of the Creative Commons Attribution 3.0 licence. Any further distribution of this work must maintain attribution to the author(s) and the title of the work, journal citation and DOI.
1. Introduction
The capture of CO2 from large point sources, such as fossil fuel-burning power stations, and subsequent storage in suitable geological repositories (carbon capture and storage, or CCS) is likely to become an important technology to assist in the reduction of mankind's greenhouse gas emissions. For CCS to have an appreciable impact on global emissions, more than 3.5 billion tonnes of CO2 must be stored annually (Pacala and Socolow 2004).
In the mid-1960s, geologic disposal of waste fluids at the Rocky Mountain Arsenal, Colorado, appeared to induce seismic activity with a maximum magnitude of 5.3 (Evans 1966, Healy et al 1968, Major and Simon 1968, Hoover and Dietrich 1969, Hsieh and Bredehoft 1981). Subsequent examples of injection-induced seismicity—listed in table 1 and see review papers by Nicholson and Wesson (1990), Davies et al (2013) and Ellsworth (2013)—have served to further confirm the link between the injection of large volumes of fluid into the subsurface and the triggering of seismicity.
Table 1. Examples of injection-induced seismicity discussed in this paper. Notes: (1) maximum injection rate. (2) Based on Ahmad and Smith's (1988) maximum modelled injection rate of 0.0042 m3 s−1. (3) Based on Seeber et al (2004)'s estimate of 164 m3 day−1. (4) Based on Shirley's (2001) 2.5 million barrels injected in a year. (5) Based on Frohlich et al's (2010) maximum rate of 11 000 barrels day−1. (6) There are conflicting estimates of injection volume at Prague. Keranen et al (2013) base their estimate on volumes injected by the two nearest wells (1.5 × 10⁵ m3), while McGarr (2014) incorporates volumes from other nearby injection wells giving a significantly larger volume (120 × 105 m3).
| ID | Project | Years of injection | Maximum magnitude | Injection volume at MMAX (×105 m3) | Injection rate (m3 month−1) | Reference(s) |
|---|---|---|---|---|---|---|
| RMA | Rocky mountain arsenal, CO | 1961–1968 | 5.3 | 6.25 | 34 0001 | Major and Simon (1968), Hsieh and Bredehoft (1981) |
| PER | Perry, OH | 1975–1986 | 5.0 | 13.3 | 11 0002 | Nicholson et al (1988), Ahmad and Smith (1988) |
| ASH | Ashtabula, OH | 1987–1994 | 4.3 | 3.4 | 50003 | Seeber et al (2004) |
| TRI | Trinidad, CO/NM | 1988-present | 4.6 | 4 | 30 0004 | Shirley (2001), Meremonte et al (2002) |
| DFW | Dallas-Forth Worth, TX | 2008–2009 | 3.3 | 3.5 | 52 0005 | Frohlich et al (2010) |
| GUY | Guy-Greenbrier, AR | 2010–2011 | 4.7 | 4.6 | 95 000 | Horton (2012) |
| YOU | Youngstown, OH | 2010–2011 | 4.0 | 0.8 | 10 000 | Ohio Department of Natural Resources (2012), Kim (2013) |
| PRA | Prague, OK | 1993–2011 | 5.7 | 1.5|1206 | 1400 | Keranen et al (2013) |
| PDX | Paradox Basin, CO | 1991–present | 4.3 | 27 | 60 000 | Ake et al (2005) |
| CLE | Cleburne, TX | 2005–2010 | 2.9 | 28 | 54 000 | Justinic et al (2013) |
| TIM | Timpson, TX | 2006–2013 | 4.8 | 39 | 45 000 | Frohlich et al (2014) |
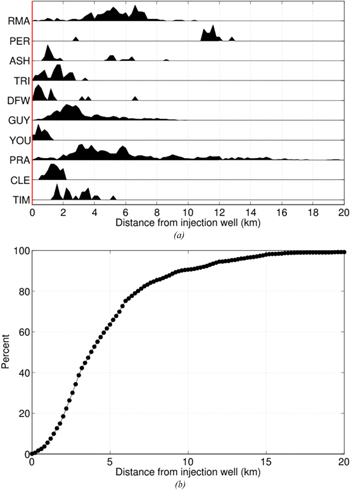
Table 1 lists the fluid injection rates, and the total volume of fluid injected at the time that the largest seismic event occurred, for examples where injection of large quantities of waste fluid has been reported in peer-reviewed literature to have triggered seismic activity. For context, we make comparisons with planned CCS projects in the UK.
The UK currently has two CCS projects in the development phase: White Rose in Yorkshire, and Peterhead, Scotland. White Rose proposes to inject 2 MT of CO2 per year 1 , while Peterhead proposes to inject 10 MT over a 10 year period 2 . Approximating the density of supercritical CO2 at reservoir temperatures and pressures as 700 kg m−3, we estimate an injection rate at the White Rose project of 2.8 × 10⁶ m3 year−1, or 240 000 m3 month−1, and a proposed injection volume at the Peterhead project of 14 × 106 m3.
In figure 1 we show the injection rates and volumes of the examples listed in table 1, alongside the proposed injection rate of the White Rose project, and the proposed injection volume of the Peterhead project, making the assumption that all of the captured emissions from each plant are stored in a single reservoir. It can be seen that possible future CO2 injection rates and volumes exceed those that are known to have been sufficient to cause seismicity. In view of this comparison, the need to consider how the potential to induce seismicity will affect our ability to securely store CO2 becomes clear. Zoback and Gorelick (2012) addressed this issue, concluding that there was a high probability that CCS might trigger seismic activity.

Figure 1. Injection rates (left) and volumes (right) for examples of seismicity induced by waste fluid injection (black columns), and injection rates and volumes proposed for future CCS projects White Rose and Peterhead. The relevant injection volume for PRA is disputed (see table 1, notes).
Download figure:
Standard image High-resolution imageInduced seismicity poses two potential threats to secure CO2 storage. Induced seismicity, if of large enough magnitude, poses a hazard in itself. Even if induced earthquakes are too small to cause significant damage, the public tends to view such instances extremely dimly, and subsequent public protests have already lead to delays or even the cancellation of offending projects. The CASTOR gas storage project, Spain, provides a timely example of a gas injection project experiencing delays due to induced seismicity (del Potro 2014). For sites that are a long distance from population centres (offshore sites, for example), the seismic hazard to facilities must still be considered, in particular the risk to pipelines transporting CO2 to the injection facility.
Moreover, the fracturing of rock implied by induced seismicity presents a possible leakage risk if it leads to the creation of permeable pathways through otherwise sealing caprocks. Supercritical CO2, with a density of ∼650–800 kg m−3 at reservoir conditions, is significantly lighter than formation brines with densities of ∼1000–1200 kg m−3, meaning that the hydraulic integrity of the caprock is crucial to guarantee secure storage. Active faults that run through otherwise sealing overburden layers may provide a pathway for buoyant CO2 to migrate back to the surface. Equally, the injection wellbores (or hydrocarbon exploration wells that intersect storage formations) present a potential leakage pathway if induced seismic activity, or geomechanical deformation more generally, causes excessive damage to annular cement. Zoback and Gorelick (2012) argue that the risks to CO2 storage integrity posed by induced seismicity makes CCS a 'risky, and likely unsuccessful, strategy for significantly reducing greenhouse gas emissions'.
1.1. What can we learn from events induced by wastewater injection?
Given the similarities involved between the injection of large volumes of produced water into deep saline aquifers and proposed CCS operations, the nascent CCS industry can learn much from these incidents. For example:
- What (if anything) controls the maximum earthquake magnitude that could be induced by injection?
- Do events typically occur solely within, or below, or above the injection interval? This has obvious implications for storage security; an event in the caprock would be of greater concern with respect to caprock integrity than an event several kilometres below the target interval.
- How are events distributed laterally? This again has implications for storage security because an event close to the injection point is likely to have a greater impact on wellbore casing integrity, while an event at significant distance may never actually reached by injected CO2, even though it is triggered by the resulting pressure increases. An important question when developing CCS sites is determining a 'radius-of-influence', defining the lateral extent of site characterization studies and baseline monitoring efforts carried out prior to injection. The maximum extent of induced seismic events might provide a minimum bound for this radius.
While there have been a number of reviews of injection induced seismicity in recent years, these specific questions have not necessarily been addressed with respect to their implications for CCS. In this paper we consider the case examples listed in table 1, considering the above questions, with specific focus on their implications for secure CO2 storage.
1.2. Mechanisms for generating injection-induced seismicity
Fluid injection into an aquifer will cause an increase in pore pressure to propagate from the injection point into the formation. During CO2 sequestration, this pore pressure front may propagate well in advance of the actual CO2 plume (e.g., Birkholzer et al 2009). The effect of an increase in pore pressure will reduce the effective normal stresses ( ) acting on a fault plane, leaving the effective shear stresses (τ') unchanged. The Mohr–Coulomb criterion dictates that a fault will fail when

where m is the coefficient of friction, and c is the cohesion of the fault plane. Therefore an increase in pore pressure created by fluid injection into a reservoir, by reducing effective normal stresses, has the potential to trigger failure on a fault, thereby generating earthquakes.
It is also possible to induce earthquakes on faults that do not have a direct hydraulic connection to the injection zone (for example faults that are kilometres below the injection interval). Changes in the stress field created by inflation of the target reservoir can propagate through the layers of rock above and below, and can potentially change the effective stresses acting on such faults by a sufficient amount to trigger a seismic event.
For obvious reasons, the faults most likely to be triggered by injection are those optimally oriented in the present day stress field such that τ' is maximized and  is minimized. The natural occurrence of intra-plate seismicity indicates that throughout the Earth's crust the in situ state of effective stress is such that a subset of optimally oriented faults are close to this critical failure criterion (e.g., Zoback and Healy 1992). That is to say that the crust is critically stressed (e.g., Zoback et al 2002), which in turn means that small changes in stress are capable of triggering earthquakes (e.g., Main 1996).
2. Case examples of injection-induced seismicity
Nicholson and Wesson (1990) provide a comprehensive review of seismicity induced by deep injection wells. More recently, the increases in both unconventional gas extraction and geothermal energy have lead to a re-focussing on the importance of injection induced seismicity, including reviews by the National Research Council of the National Academies (2012), by Davies et al (2013), and by Ellsworth (2013). The case studies used in this paper are listed in table 1, and described in greater detail in the online supplementary material available at stacks.iop.org/ERL/9/064022/mmedia Most reviews of induced seismicity have included examples from hydraulic fracturing, from depletion of oil reservoirs, from geothermal operations, and from hydroelectric reservoir impoundment. We focus solely on examples of seismicity produced by the disposal of large volumes of waste fluid into deep aquifers, as these are most pertinent to CO2 sequestration scenarios.
2.1. Occurrence rates of injection-induced seismicity
Determining how commonly large volume fluid injection wells induce seismic activity is difficult to establish, as it depends on the detection thresholds of the various seismic networks available, as well as the minimum injection volume considered. For example, there are over 100 000 Class II injection wells in the USA, of which only a small handful have been associated with seismic events, implying that injection-induced seismicity is a rare occurrence.
However, the recent increase in injection-induced events in the USA (Ellsworth 2013) has lead to a reassessment of this assumption. For example, Frohlich (2012) re-analysed Earthscope USArray data in the Barnett shale region, identifying 8 groups of seismic events that were potentially associated with injection wells. These smaller (2.0 ⩽ M ⩽ 3.0) events had previously gone undetected on national seismic arrays. While there are thousands of fluid disposal wells in the region, Frohlich identified that all eight seismicity clusters were associated with wells injecting at rates of 24 000 m3 month−1 or greater, of which there were only 161 in the region of interest. Although events of magnitude 2.0 ⩽ M ⩽ 3.0 are too small to cause damage at the surface, if they were to occur in the caprock of a CCS operation they would pose questions regarding sealing integrity. In addition they have the potential to be felt by the public, which is likely to lead to local opposition that can pose a risk to ongoing operations.
2.2. Maximum magnitudes
Given the possibility of inducing seismic events during CO2 sequestration, a key question is to ascertain what is the maximum earthquake magnitude (MMAX) that could be induced by CO2 injection into the subsurface.
The mechanism typically invoked for induced seismicity is that a small stress or pore pressure change occurs on a pre-existing fault that, being optimally oriented within the current stress field, is close to a critical failure threshold. Therefore small tectonic stress changes in the recent past may have triggered seismic events on the same (or at least similar) faults. Given this, it is possible that the historical seismic magnitudes of a region could provide some indication of the maximum magnitude induced by injection.
In some cases, MMAX during injection appears to correlate with nearby (within 25 km) historical earthquakes. For example, the M4.5–4.7 Lake County earthquake occurred in 1943 approximately 15 km from the epicentre of the M5.0 Perry earthquake (Wesson and Nicholson 1986); an M4.2 earthquake was recorded in 1973 within 25 km of Trinidad prior to the 2001 M4.6 event; the Enola earthquake swarm, with a maximum of M4.4, occurred in 2001 less than 20 km from the Guy–Greenbrier fault (Rabak et al 2010).
In some cases, past earthquakes can be identified, albeit at greater distance. For example, the aforementioned 1943 Lake County earthquake is within 50 km of the Ashtabula M4.3 earthquake, and in 1998 an M5.1 earthquake was recorded in western Pennsylvania, within 50 km of the Youngstown M4.0 earthquake. For the remaining case studies, there is either no historical record of seismicity in the area, or recorded earthquakes within 50 km are at least 1 magnitude unit smaller. This indicates that while historical seismic magnitudes can be useful as an indicator for MMAX, this is not a metric that can be relied upon completely. This might be in part because historical records of seismicity are not sufficiently long or detailed enough to fully characterize the natural seismicity of an area.
Alternatively, relationships have been developed that relate the maximum magnitude induced by injection to either the volume of fluid injected (McGarr 2014) or the length-scale of an ellipsoid of rock stimulated by injection (Shapiro et al 2011). McGarr (2014) modifies an equation first developed in McGarr (1976) to relate the cumulative seismic moment released due to a subsurface volume change, adapting it to describe MMAX as a function of the injection volume, ΔV:
where μ is the rock shear modulus.
Alternatively, Shapiro et al (2011) argue that MMAX will be controlled by the size of the zone stimulated by injection. The maximum size of the fault that can be ruptured scales to this length, and MMAX can then be calculated from this length using generic fault scaling relationships (e.g. Abercrombie 1995). By treating the stimulated volume as an ellipsoid, Shapiro et al (2011) find that MMAX can be scaled to the length of the smallest principal axis, LMIN:
Shapiro et al (2011) use spatial distributions of microseismic events to determine the dimensions of the ellipsoid stimulated by injection. We perform similar calculations for our case examples. We begin by defining discrete clusters of events using a density-based spatial clustering algorithm, and compute the dimensions of an ellipsoid containing 95% of the events of the cluster that has the largest number of events, selecting LMIN as the length of the smallest principal axis of this ellipsoid. We have only performed this calculation for case examples where data from local seismic networks is available, providing more accurate event locations (see section 2.3 and supplementary material), and where the largest cluster contains more than 15 events.
Figure 2 shows observed seismic moment released by the largest earthquake(s) of each case study, and the volumes injected at the time each event occurred (black circles). Also shown is the McGarr (2014) relationship (black dashed line), and the values computed via the Shapiro et al (2011) method for each case study using observed event locations (red squares).

Figure 2. Earthquake moment as a function of injection volume (after McGarr 2014). Black dashed line indicated the envelope for MMAX as described by McGarr (2014). Red squares indicate modelled MMAX based on event spatial distributions calculated using the Shapiro et al (2011) method.
Download figure:
Standard image High-resolution imageGiven the relative parsimony of the above models, they both appear to provide a reasonable envelope for observed values of MMAX. It should be kept in mind that these relationships describe an envelope of maximum potential magnitude that could be induced for a given injection volume, rather than the actual magnitude that will be induced. Hallo et al (2014) modify the maximum moment released by a seismic efficiency factor, Seff.
We envisage that installing monitoring networks to record microseismicity during early stages of injection may allow Seff to be estimated, providing better constraint on the expected MMAX for a given injection volume. Similarly, such a microseismic monitoring network would allow a 'stimulated ellipsoid' to be determined, which is required to determine MMAX following the Shapiro et al (2011) method.
2.3. Depths of induced seismicity
Whether or not an event induced during CO2 injection might pose a risk of leakage will be determined by the event hypocentre. For example, an induced event triggered well below the target storage formation will not pose as much of a risk to leakage as an event in the sealing caprocks. Similarly, the pulse of increased pressure created by CO2 injection will extend far ahead of the actual CO2 plume. As such, a fault some distance from the injection well could be re-activated by the pressure pulse, but never pose a leakage risk because it will not be reached by the zone of CO2 saturation. Equally, active faults near to the wellbore may pose a risk to wellbore integrity through shearing, whereas a more distant fault may not.
At this juncture, therefore, accurate event locations, and especially hypocenter depths, are required. Many of the events discussed so far have been detected only by national and/or regional seismic networks, where the nearest seismic station may be many tens of kilometres away. Such networks are not able to provide locations of sufficient accuracy for our purposes. In the following sections we therefore consider only events recorded on local seismic networks. The specific data sources that we use, and estimates of event location errors, are listed in the supplementary material.
In many of the case examples considered, local networks were deployed after the occurrence of the largest event. As such it is possible, even likely, that seismicity was occurring prior to these deployments, and that these events have gone undetected. Therefore our data are probably biased in that for many cases they may not capture the earliest stages of induced seismicity.
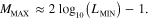
In figure 3(a) we plot histograms of event depths, scaled such that 0 on the 'y'-axis corresponds to the deepest injection depth at each site. Vertical red lines at the centre of each dataset illustrate the extent of injection intervals, while dashed green lines show the approximate basement depths, where this information is available.

Figure 3. Normalized histograms (a) and cumulative distribution (b) of event depths with respect to the injection interval. In (a), vertical red bars mark injection intervals, while dashed green lines mark the depth of basement rocks, where such information is available.
Download figure:
Standard image High-resolution imageIt has been suggested that injection either directly into basement rocks, or into basal layers with no underlying confinement, is a key factor in injection-induced seismicity (Person et al 2013). Dashed green lines in figure 3(a) show the approximate basement depths, where such data is available. In a number of cases (RMA, PER, ASH, and YOU) injection does indeed occur in close proximity to the basement, with the majority of events located in the basement rocks. Furthermore, for GUY and PRA, the majority of events appear to occur in basement rocks, even though deepest injection depths are more than 500 m above the basement.
In figure 3(b) we plot the cumulative distribution of event depths relative to the injection interval. Only 2% of events occur more than 500 m above the shallowest injection interval, while 80% of events occur at least 500 m below the deepest injection depth, and 50% of events are located more than 2.5 km below the injection interval. It is not clear whether the triggering of seismicity several kilometres below the injection interval is a result of hydraulic communication along faults or through dynamic (e.g., Kilb et al 2000) or static (e.g., King et al 1994) changes in the stress field transmitted through the rock frame.
These observations are, at first glance, encouraging for the future viability of CCS in one respect, but they also pose a challenge. The fact that the majority of events occur below the injection interval should be considered favourable in terms of storage integrity. However, our ability to mitigate induced seismicity depends in part on identifying potential faults during the site selection stage, so that they can be included in geomechanical models. Prior to injection, we anticipate that seismic reflection surveys with sufficient resolution to detect faults within the reservoir interval will be conducted. However, the resolution of such surveys is a function of depth, meaning that the detection of a fault more than 2 km below the injection zone may be a more challenging prospect.
A caveat to these observations is the potential difference between wastewater and CO2 as injected fluids. While we consider these differences more generally in the discussion section below, with respect to earthquake depths a key potential difference is the density of the different fluids, with injected water having a similar density to the in situ fluid, while CO2 is less dense, and therefore more likely to move upwards through overlying formations if a permeable pathway is available.
However, Mori and Abercrombie (1997) show that the increases in stress, rock strength and rock homogeneity leads to an increase in the number of large earthquakes with depth. These increases will be particularly significant moving from shallow sediments to crystalline basement rocks. We postulate that the downward migration of induced events may be a result of these factors. Similarly, Sumy et al (2014) argue that the largest event at Prague was triggered by static Coulomb stress transfer promoted by earlier events that were directly triggered by pore pressure increases. If this is the case, then the density of the injected fluid will not necessarily play a role in determining the locations of induced earthquakes.
Moreover, we note that Rinaldi et al (2014) have modelled the effects of CO2 injection into faulted reservoirs. Even though the CO2 was buoyant, and permeable pathways through the caprock were included in the models, they observed that the largest amounts of fault slip, and thereby it must be inferred the majority of the induced seismicity, occurred in layers bounding the base of the reservoir, rather than in the overburden.
2.4. Lateral distributions of induced seismicity
The pulse of pressure increase produced by CO2 injection will extend far in advance of the plume of CO2 itself. The 'radius-of-influence', which determines the limit of site characterization and baseline monitoring studies conducted prior to injection, should be determined by the zone of pressure increase, which may extend many tens of kilometres from the injection point, rather than the footprint of the CO2 plume, which may only extend a few kilometres.
With this in mind we consider the radius of influence for our case examples, as demarcated by the lateral distance of seismicity from the injection point. The injection rates and volumes anticipated for CCS operations exceed that of all the cases considered in this paper, so our observations should be considered to represent a lower bound estimate for the potential radius of influence of a CO2 sequestration site.
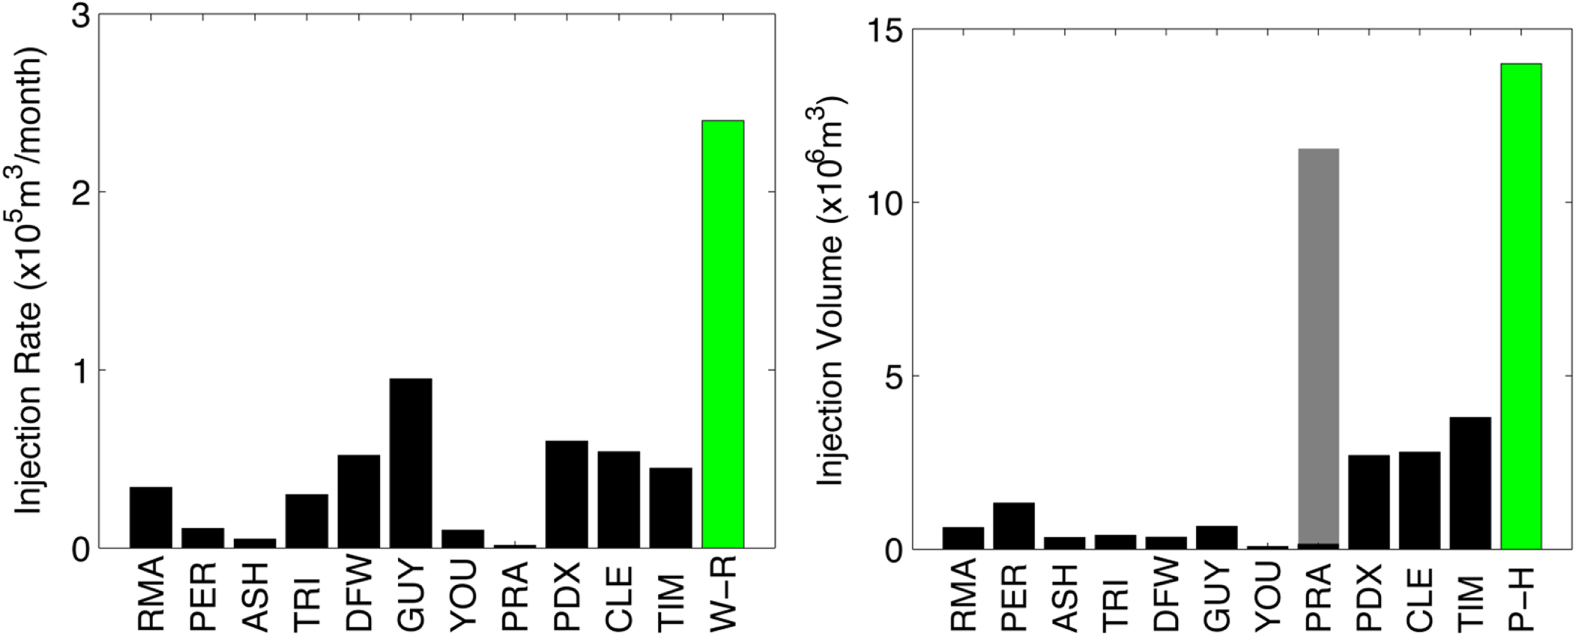
In figure 4(a) we plot histograms of epicentral distances from the injection wells, while in 4(b) we plot the cumulative distribution. In all cases bar Perry, some seismicity occurs within 2 km of the well. The mean epicentral distance from the nearest injection well is 5 km, while 99% of events occur within 20 km. These observations imply that a radius of influence of 20 km, as suggested in previous studies (e.g. Sminchak et al 2002), is a reasonable lower bound for the radius of influence.
Figure 4. Normalized histograms (a) and cumulative distribution (b) of event distance from the injection point, where 0 indicates an epicentre adjacent to the injection point. For cases with multiple injection wells, the distance to the nearest well is used.
Download figure:
Standard image High-resolution image
3. Discussion and conclusions
The successful deployment of CCS to mitigate anthropogenic CO2 emissions requires the injection of significant volumes of CO2 into the subsurface. Comparisons can be drawn with the increase in volume of wastewater disposal in the USA as a result of the boom in unconventional gas production. It is worth considering whether water injection can be used as an analogue for CO2 injection.
There are differences between the physical properties of water and supercritical CO2: water has a higher viscosity and higher bulk modulus, and there may also be differences in wetting behaviour (e.g., Wang et al 2013) and relative permeability. Also, CO2 will dissolve into formation brines, reducing the volume of free-phase CO2 in the reservoir from that injected. However, in this paper we are mainly concerned with earthquakes induced during injection, as opposed to post shut-in. Significant CO2 dissolution is unlikely to occur on these short timescales: for example Johnson et al (2001) estimate that at 85% of injected CO2 will still be in the free phase at the end of the injection period.
Few studies have attempted to directly compare seismicity generated by CO2 and water injection. The only direct comparison that we are aware of is described in Maxwell et al (2008) and Verdon et al (2010). In this case, both water and CO2 were used to hydraulically fracture different stages of the same well in a tight gas reservoir. Verdon et al (2010) noted similar rates and magnitudes of seismicity between the two fluids. However, the case of injecting fluids at high pressure to fracture unconventional reservoirs isn't directly analogous to the case of injecting larger volumes of fluids at lower pressures for waste storage.
It has been suggested that the lower viscosity and bulk modulus of CO2 with respect to water will render it less likely to induce seismic activity. However, from a geomechanical perspective the key factor in terms of re-activating a fault is the change in stress acting on the fault, which is in turn influenced primarily by the changes in pore pressure caused by injection. The increase in pore pressure across a reservoir is primarily determined by the volume of pore space occupied by the injected fluid.
Therefore we do not anticipate a reduced rate of seismicity during injection of CO2 as opposed to water. We note that CO2 injection has already caused substantial amounts of seismic activity at the In Salah CCS project (Verdon et al 2013, Stork et al 2013). Similarly, injection of natural gas, which also has lower viscosity and bulk modulus than water, is believed to have triggered a substantial amount of seismicity at the CASTOR natural gas storage facility, off the coast of eastern Spain (del Potro 2014).
Given this, we encourage the incipient CCS industry to take the opportunity to learn from experience with regard to wastewater disposal in the mid-continental USA. A major consequence of this increase in wastewater disposal has been the increase in felt seismicity (Ellsworth 2013). In the main, magnitudes have not been large enough to cause damage, although the largest Prague, OK, earthquake generated shaking up to intensity VIII, destroying 14 houses in the epicentral region (Keranen et al 2013). Nevertheless, public acceptance remains a significant barrier to CCS developments (e.g., van Noorden 2010). Like any industrial development that impacts on communities, CCS will require a Social License to Operate (Nelsen 2006) to be successful. Regular triggering of felt seismic events will jeopardize this SLO. Moreover, induced seismicity, when it occurs in the overburden, may compromise the hydraulic integrity of the caprocks.
The study of USArray data in the Barnett shale conducted by Frohlich (2012) has highlighted the importance of seismic monitoring during CO2 injection operations. Commonly, local monitoring networks are only deployed in response to felt events. As such, lower levels of seismicity prior to the felt event may be missed, and a full characterization of the seismic response to injection is not possible. In contrast, Ake et al (2005) show the advantages of installing a dedicated seismic monitoring network prior to injection. Firstly, the pre-existing base rate of natural seismicity can be established. Subsequently, the improved geomechanical characterization afforded by the monitoring network has allowed the operators to tune the injection program accordingly to minimize the risks of induced seismicity.
So far, monitoring of seismicity at 'megatonne'-scale CO2 storage sites has been patchy (Verdon et al 2013). Neither Sleipner nor Snøhvit have any kind of seismicity monitoring. At Weyburn, a microseismic monitoring array was installed to cover a small portion of the field, which has detected approximately 200 microseismic events with −3.0 < MW < −1.0 (Verdon et al 2011). At In Salah, a microseismic array was installed several years after the start of CO2 injection, after significant deformation had already been detected using InSAR methods. This array detected 9000 microseismic events over a year of monitoring, of which the largest had MW = 1.6 (Stork et al 2013), providing crucial information about caprock integrity (Verdon et al 2013).
Comparisons with seismicity induced by wastewater disposal have afforded us some insight into the seismicity we might expect during CO2 sequestration, and the risks that they might pose. The McGarr (2014) relationship implies that large-scale CCS projects have the potential to trigger events with M ⩾ 5.0, should the pore pressure increase impinge on an optimally oriented fault of sufficient size. This information should be factored in to studies assessing the seismic hazard posed by CCS operations.
The majority of observed seismic events have occurred below the injection interval, which must be considered favourable to secure CO2 storage (as opposed to overburden seismicity). 99% of events occur within 20 km of the injection point: this provides a lower bound of the area of influence for future CCS sites: geological characterization studies prior to injection must ensure that no pre-existing faults that are optimally oriented for failure in the current stress field exist within this distance.
Given the potential risks of induced seismicity posed by CCS operations, it is worth considering what actions can be taken to ameliorate these risks. Nicholson and Wesson (1990) make a number of suggestions, including: selecting sites with high transmissivity and storativity; making estimates of the stress state at potential sites; selecting sites that do not have evidence for faulting (though an absence of evidence does not necessarily prove the absence of a fault); and choosing sites in regions with low rates of natural seismicity. In table 2 we make a number of recommendations regarding geomechanical appraisal and seismic monitoring that we suggest should be undertaken prior to and during the operation of a CO2 sequestration site.
Table 2. Recommendations for geomechanical appraisal and seismic monitoring of CO2 sequestration operations.
| Recommendation | Comments |
|---|---|
| Evaluation of historical regional seismicity | Use regional event catalogues and historical information. Historical events may indicate the maximum magnitude that could be generated during injection |
| Search for faults within radius of influence | Large events will most likely occur on pre-existing faults, which should be avoided if possible, especially if optimally oriented within the present-day stress field. Faults may be observed in 3D seismic data, in wellbores, or from surface expression |
| Coupled numerical modelling of fluid-flow/geomechanical processes | Fluid-flow models compute pore pressure increases caused by injection. Geomechanical models compute the stress changes caused by pore pressure changes, allowing the geomechanical impact of the proposed injection program to be predicted. |
| Installation of local seismic network at least 6 months prior to injection | A local network might consist of 10–20 seismometers, placed such that they cover a region at least 20 km in radius from the injection point. Installation 6 months prior to injection will allow the background level of seismicity to be characterized. |
| Continuous seismic monitoring for a minimum of 2 yr | For the majority of case examples here, some seismicity is detected within 2 yr of injection. This should represent a minimum monitoring period even if no seismicity is detected. |
| Management of injection program based on observed seismicity | Injection rates and pressures can be modulated in response to observed seismicity. If rates and magnitudes of seismicity are deemed to be too high, injection rates/pressures can be reduced. If little or no seismicity is detected, injection rates might be increased if necessary. |
Acknowledgements
JPV is a Natural Environment Research Council Early-Career Research Fellow (Grant Number NE/1021497/1). This research was conducted under the auspices of the Bristol CO2 Group (BCOG) and the Bristol University Microseismicity Projects (BUMPS). I am grateful to the USGS for providing hypocentral locations for the Prague data. The remaining location data were taken from publically available sources listed in the Supplementary Material.
Footnotes
- 1
http://www.whiteroseccs.co.uk/about-white-rose (accessed 10 February 2014).
- 2
http://www.shell.co.uk/gbr/environment-society/environment-tpkg/peterhead-ccs-project.html (accessed 10 February 2014).