

Abstract
Aerosol pollution in China is significantly altering radiative transfer processes and is thereby potentially affecting rice photosynthesis and yields. However, the response of rice photosynthesis to aerosol-induced radiative perturbations is still not well understood. Here, we employ a process-based modelling approach to simulate changes in incoming radiation (RAD) and the diffuse radiation fraction (DF) with aerosol mitigation in China and their associated impacts on rice yields. Aerosol reduction has the positive effect of increasing RAD and the negative effect of decreasing DF on rice photosynthesis and yields. In rice production areas where the average RAD during the growing season is lower than 250 W m−2, aerosol reduction is beneficial for higher rice yields, whereas in areas with RAD>250 W m−2, aerosol mitigation causes yield declines due to the associated reduction in the DF, which decreases the light use efficiency. As a net effect, rice yields were estimated to significantly increase by 0.8%–2.6% with aerosol concentrations reductions from 20 to 100%, which is lower than the estimates obtained in earlier studies that only considered the effects of RAD. This finding suggests that both RAD and DF are important processes influencing rice yields and should be incorporated into future assessments of agricultural responses to variations in aerosol-induced radiation under climate change.
Export citation and abstract BibTeX RIS

Original content from this work may be used under the terms of the Creative Commons Attribution 3.0 licence.
Any further distribution of this work must maintain attribution to the author(s) and the title of the work, journal citation and DOI.
1. Introduction
Along with rapid economic growth, increasingly serious aerosol pollution (Liang et al 2016), increasing atmospheric aerosols (Dai et al 2013), and a greater number of hazy days (Wu et al 2006) have been widely observed in many regions of China. Air quality degradation has occurred not only in highly urbanized areas (Chan and Yao 2008) but also in many rural and suburban regions (Luo et al 2016). Recent studies have identified a set of fundamental climatic effects of aerosol pollution (Ramanathan et al 2005, Wild et al 2005) that are important during atmospheric radiative transfer processes (Lin et al 2015, Ren et al 2013). For example, the incoming radiation (RAD) in China was reduced by approximately 20% over 1961–2010, an effect that might be attributed to aerosol pollution (Lin et al 2015). In addition, aerosol pollution in China has resulted in a higher diffuse fraction (diffuse radiation divided by incoming radiation; here after referred to as DF) (Ren et al 2013).
Changes in RAD and DF influence the photosynthesis (Knohl and Baldocchi 2008, Mercado et al 2009) and productivity (Greenwald et al 2006, Zheng et al 2011) of most plants. Decreased RAD results in lower photosynthetic rates (Kanniah et al 2012), whereas a higher DF due to the scattering effects of clouds or aerosols can improve the light use efficiency of plants. These two processes offset each other, and their net impacts on plant productivity are unclear. An earlier study of forest ecosystems identified a trade-off between the RAD and DF values at which forest productivity reaches its peak (Mercado et al 2009).
Lowland rice is a food crop that is very sensitive to radiative changes because solar radiation is the most important climatic variable for irrigated rice in China (Zhang et al 2010). A recent study suggested that the geographic distribution of heavy aerosol pollution overlaps the major rice production area in China (Tie et al 2016), which further raises concern regarding the impacts of aerosol pollution on rice. Only a few studies have addressed the impacts of aerosol-induced radiative perturbations on rice (Chameides et al 1999, Tie et al 2016). These studies reported 3%–30% yield improvements due to mitigating aerosol pollution based on either simple crop-radiation response functions (Chameides et al 1999, Tie et al 2016) or statistical relationships from non-agricultural systems (Tie et al 2016). However, the potential effect of diffuse radiation was not quantified in these studies.
Our main objective was to assess and interpret the impacts of aerosol pollution mitigation on lowland rice yields in China by considering the effects of RAD and DF on rice photosynthetic processes. To achieve this objective, we (i) estimated the changes in RAD and DF due to decreasing atmospheric aerosol loadings using a radiation transfer model, (ii) simulated the yield responses to changes in RAD and DF using a rice growth model, and (iii) compared the modelled yield responses with field observations.
2. Methods
2.1. Study region and sites
Rice is grown in a wide range of domains across China, with varying climate conditions (figure 1). More than 90% of the rice production areas are irrigated (Maclean et al 2002). The eastern, central, southern, and southwestern regions account for 78% of the rice production areas in China. Less rice is grown in the northern regions, although rice production in these regions is increasing due to recent climatic warming (Zhang et al 2013). Rice is planted in 1513 counties in China, and climatic data were extracted for each of these counties from a historical daily climate database in geo-grid-cell base that we used in previous works (Zhang et al 2013, Zhang and Yang 2016).
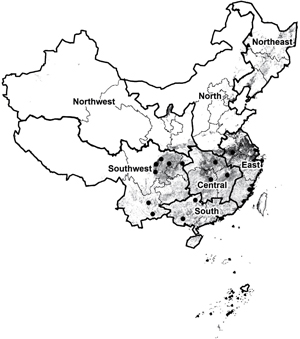
Figure 1. Study area and definition of regions. The shaded areas show the lowland rice fields, and the black points denote the experimental sites in the study. Rice production areas were separated into seven rice-growing regions in China.
Download figure:
Standard image High-resolution imageTo evaluate our modelling results, we collected observations of rice growth, including seasonal rice phenology and yield records, from the agro-meteorological observational network of the Chinese Meteorological Administration (CMA) and daily RAD, DF and average temperature (TAVG) data from the solar radiation observational network of the CMA. We then selected 14 (out of 193) experimental sites (figure 1) for which both agronomy data and radiation observations were available. Many sites were excluded because DF observations were not collected at these sites by the solar radiation observational network. For each of the 14 sites, we calculated the mean RAD, DF and TAVG during the growing season (i.e. the period from emergence to maturity) and paired these data with yield data in each season.
2.2. Radiation transfer model and rice simulation model
We used the Column Radiation Model (CRM) to predict aerosol-induced variations in RAD and DF (Yue and Unger 2017). The CRM is a standalone version of the radiation model used by the NCAR Community Climate Model version 3.6 (Kiehl et al 1998). The CRM calculates extinction and Mie scattering of both aerosols and clouds. The model considers the radiative effects of sulphate, nitrate (including ammonium), black carbon, organic carbon, dust, and sea salt and includes the impacts of hygroscopic growth on the optical parameters of particles. The CRM is driven by hourly 1 × 1° fields of temperature, humidity, and ozone at 20 sigma levels (approximately 1000 hPa to 1 hPa) interpolated from the Modern Era Retrospective-analysis for Research and Applications (MERRA) reanalysis product (Rienecker et al 2011). Surface variables, such as albedo, temperature, and pressure, were also adopted from MERRA. Vertical cloud profiles, including cloud cover and the liquid water path, were adopted from the CERES SYN1deg product (Rutan et al 2015). Three-dimensional concentrations of aerosols used by CRM were predicted offline using the NASA ModelE2 model, a coupled chemistry-carbon-climate model that has been fully validated against observations (Schmidt et al 2014). The model setup of pollution species was based on emission inventories obtained from the Greenhouse Gas and Air Pollution Interactions and Synergies integrated assessment model (http://gains.iiasa.ac.at/models/), which is comparable to other air pollution inventories (see supplementary text S1 and figure S1, available at stacks.iop.org/ERL/12/104003/mmedia). Due to the disk storage limit, we performed CRM simulations for the years 2009–2011, and the aerosol concentration in this period was defined as the present day (PD) level. The RAD and DF were then simulated under six different scenarios: 0, 20, 40, 60, 80, and 100% reductions in aerosol concentration relative to the PD level. We simulated the changes in RAD and DF associated with reducing aerosols and kept the same observed climate variables in all scenarios.
We employed a process-based rice growth model, ORYZA (v3) (Li et al 2016, Li et al 2017) to simulate yield. ORYZA integrates phenological, morphological and physiological processes to simulate rice growth and yield. The individual effects of diffuse and direct radiation on rice are distinguished in the model due to large differences in the illumination intensity between shaded (receiving only diffuse radiation) and sunlit (receiving both diffuse and direct radiation) leaves. For shaded leaves at depth L, the CO2 assimilation rate is calculated using a negative exponential function (equation (1)), which is characterized by an initial slope (the initial light use efficiency) and an asymptote

where AL is the gross CO2 assimilation rate, Am is the CO2 assimilation rate at light saturation, ε is the initial lightuse efficiency, and Ia is the amount of absorbed radiation.
For sunlit leaves, the CO2 assimilation rate is calculated separately for leaves with different angles and integrated over all leaf angles with an assumption of spherical leaf angle distribution. The fraction of shading and sunlit leaves changes with sun position, which is dependent on location and time of day. In the original version of ORYZA, diffuse radiation from incoming radiation is calculated using a fixed fraction. Here, we modified ORYZA to allow it to directly receive the radiation transfer model outputs; i.e. the daily RAD and DF values simulated by CRM are fed into ORYZA. This modification allowed us to simulate the rice yields under the abovementioned six aerosol reduction scenarios.
Both the CRM and ORYZA have been validated in China. CRM was evaluated against in situ observations from 106 sites over China for both RAD and DF (Yue and Unger 2017), and ORYZA has been calibrated based on phenology and yield data of 25 rice cultivars widely used in China (Zhang and Yang 2016). Graphical comparisons are presented in supplementary figures S2 and S3, which show that the data points are close to the 1:1 line. Details of the model validations can be found in our earlier works (Yue and Unger 2017, Zhang and Yang 2016).
2.3. Detection of individual effects of RAD and DF on yield
To detect the individual effect of RAD and DF on yield and validate the simulation results, we performed multiple regressions with both the simulated and observed data. For the simulations under the six aerosol scenarios, our model links the log yield Yields,c for scenario s in county c to the mean RAD and DF over the growing season (equation (2)).
where RAD denotes the mean incoming radiation (W m−2), and DF denotes the mean diffuse radiation fraction (0–1) over the growing season. We also included the quadratic effects of these two variables (to capture potential non-linear effects) as well as the county effects, Countyc (to capture location-specific differences). The coefficients α1 to α5 denote the regression coefficients, and ε is an error term.
For the observed data, we linked the log yield, Yieldc,t, for a given county c in a given year t to the mean RAD and DF over the growing season (equation (3)). However, because these data are collected under field conditions, there are other variables that potentially affect rice yield; therefore, the effects of potentially confounding variables need to be controlled for. Accordingly, we included TAVG in the model and accounted for time trends at the county level by including a county-by-year term to minimize the influence of overall agronomy technological improvements (Lobell et al 2011). The coefficients of α1 to α8 denote the regression coefficients
In addition, we produced a graphical representation of the individual RAD and DF effects on yields: we artificially increased the RAD by 10 W m−2 and the DF by 0.05 and then calculated the percentage changes in yield based on the two regression models. The median yield responses and their 95% confidence intervals (95% CIs) were estimated by the bootstrap method (Lobell et al 2011).
3. Results
3.1. Individual effects of RAD and DF on yield
The multiple regression models of the simulated results indicated that both RAD and DF exert significant effects on yield (table 1). The regression coefficients of the linear and quadratic terms were 0.0186 and −3.33×10⁵, respectively, for RAD, and −2.1 and 2.17, respectively, for DF. The statistical significance of the quadratic terms suggests different yield responses under different RAD and DF levels. For the models of the observed data, the signs of the regression coefficients are consistent with those obtained from the simulated data but they were statistically insignificant (table 1).
Table 1. Regression coefficients of RAD and DF from regression models of simulated and observed data. The values in parentheses are standard deviations, and ⁎ indicates statistical significance at p < 0.05.
| Climate variables | Simulation | Observation |
|---|---|---|
| RAD | 0.0186 (0.0019)⁎ | 0.0057 (0.013) |
| RAD2 | −3.33 × 10⁻⁵ (4.40 × 10⁻⁶)⁎ | −1.04 × 10⁻⁵ (3.74 × 10⁻⁵) |
| DF | −2.10 (0.304)⁎ | −0.342 (5.06) |
| DF2 | 2.17 (0.259)⁎ | 0.297 (4.216) |
Figure 2 compares the simulated and observed yield responses to 10 unit increases in RAD and 0.05 unit increases in DF at various levels of RAD and DF. We observed similar patterns between in the simulated and observed responses, although the 95% CIs for the observed data were large (figure 2). At most levels of RAD, increased RAD improves yield, but this effect is weaker at higher range of RAD over the growing season (figure 2(b1)). The RAD effect is close to zero when RAD is approximately 275 W m−2 based on the simulation data (figure 2(a1)) whereas the observed value is slightly lower (250 W m−2) (figure 2(b1)). At most levels of DF, increased DF results in higher yield, and the yield increases are higher at higher levels of DF. Over the growing season, the effect of DF is close to zero at a DF value close to 0.45, as estimated from simulation data (figure 2(a2)), and close to 0.55, as estimated from observation data (figure 2(b2)).
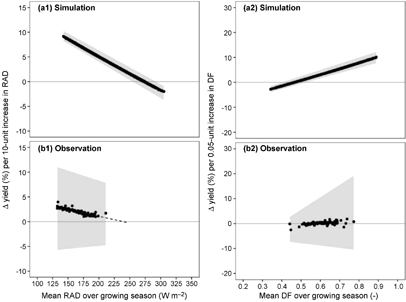
Figure 2. Estimated percentage yield change per 10 unit increase in RAD (a1) and (b1) and per 0.05 unit increase in DF (a2) and (b2) at various RAD and DF over the growing season. The estimates are based on regression models (equations (2) and (3)) for simulated (a1) and (a2) and observed data (b1) and (b2). The black points represent the median impact on yield, and the grey-shaded areas represent the 95% CI, as estimated using the bootstrap method. The dashed line in (b1) is the extension of the yield response to estimate the RAD value at which the response is zero.
Download figure:
Standard image High-resolution image3.2. Net effect of RAD and DF on yield
With lower aerosol loading, the CRM predicted increased RAD (figures 3(a1)–(a5)) and decreased DF (figures 3(b1)–(b5)) in the study region. For example, RAD was significantly increased by 1.6%–8.7% as aerosol decreased from 20 to 100% (table 2). The northern, eastern, and central regions showed the greatest increases in the RAD, with increases of 2.3%–12.3%, 2.2%–11.8%, and 1.7%–8.9%, respectively (table 2). In contrast, DF was estimated to significantly decrease by 2.8%–16.6% with an aerosol reduction from 20 to 100% (table 2). The northern, eastern, and northeastern regions exhibited the largest reductions, which were equal to 3.6%–22.0%, 3.3%–20.2%, and 3.3%–18.9%, respectively.
Rice yield shows diverse responses to aerosol-induced radiative perturbations. With reduced aerosol levels, the simulated yield increased in 84%–95% of rice production areas depending on the aerosol reduction scenario (figures 3(c1)–(c5)). However, yield reduction was predicted in some northeastern and southern areas, particularly at aerosol reductions of 40%–100% (figures 3(c3)–(c5)). A regional analysis predicted statistically significant yield increases in the north (1.6%–5.9%) and east (1.5%–5.1%). In contrast, in the northeast, the overall yield was estimated to decrease by 0.1% for an aerosol reduction of 80% and by 0.4% for an aerosol reduction of 100% (table 2), but these decreases are not statistically significant because both positive and negative changes occurred in the region (figure 3(c5)). In summary, our results suggest that the overall rice yield would increase by 0.8%–2.6% in China due to the net effect of RAD and DF at aerosol reductions of 20%–100% (table 2).
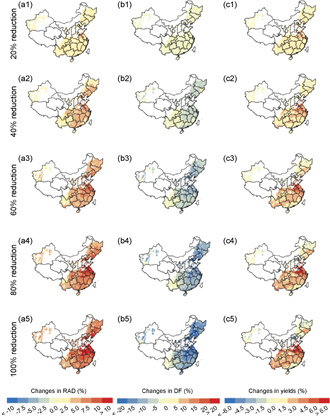
Figure 3. Percentage changes in RAD (a1)–(a5), DF (b1)–(b5), and yield (c1)–(c5) under scenarios of aerosol concentration reductions of 20% (first row), 40% (second row), 60% (third row), 80% (fourth row) and 100% (fifth row) of the PD. The white areas indicate areas of no rice production.
Download figure:
Standard image High-resolution image3.3. Yield sensitivity to reduced aerosol pollution
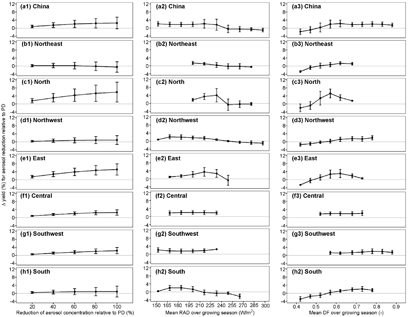
As described above, the mitigation of aerosol pollution is estimated to have an overall positive effect on rice yield in China. But, our results also indicate that the rate of yield increase is gradually lower at higher levels of aerosol reduction (figure 4). For the major rice production areas in China, the derived yield-aerosol sensitivity (defined as the percentage yield change per 20% reduction in aerosol concentration) is 0.63 ± 0.59 with one standard deviation at aerosol reductions of 20%–60% (slope of figure 4(a1) for the first three scenarios). However, at higher percentages of aerosol reduction (80 to 100%), the rate of yield increase is markedly lower, with a yield-aerosol sensitivity of 0.13 ± 0.53 (slope of figure 4(a1) for the last two scenarios).
Figure 4. Percentage changes in yield induced by aerosol reduction relative to PD under different aerosol reduction scenarios (a1)–(h1), county RAD levels (a2)–(h2), and county DF levels (a3)–(h3) based on simulated results. The panels in the first row represent all of the rice-growing counties in China, and the panels in the remaining rows represent specific regions. The error bars indicate the standard deviations for each bin.
Download figure:
Standard image High-resolution image
The majority of regions show patterns consistent with this overall pattern. For aerosol reductions of 20%–60%, the yield-aerosol sensitivities are 1.36 ± 1.0 in the northern regions (figure 4(c1)), 0.22 ± 0.43 in the northwestern regions (figure 4(d1)), 1.21 ± 0.60 in the eastern regions (figure 4(e1)), 0.62 ± 0.25 in the central regions (figure 4(f1)), 0.52 ± 0.29 in the southwestern regions (figure 4(g1)), and 0.22 ± 0.43 in the southern regions. However, at higher percentages of aerosol mitigation (80%–100%), yield-aerosol sensitivity is only one tenth to one half of the value at lower percentages: 0.60 ± 0.85 in the north (figure 4(c1)), 0.03 ± 0.47 in the northwest (figure 4(d1)), 0.41 ± 0.45 in the east (figure 4(e1)), 0.10 ± 0.29 in the central region(figure 4(f1)), 0.34 ± 0.39 in the southwest and 0.001 ± 0.51 in the south (figure 4(g1)). The northeastern region deviated slightly from the general pattern: the yield increased under the 20%–60% aerosol reduction scenarios (by 0.2%–0.3%) but decreased (by 0.1%–0.4%) under 80%–100% aerosol reduction (figure 4(b1)).
To further understand the change in yield sensitivity with changes in aerosol loading, we plotted the county-level yield changes induced by aerosol reduction against the mean growing season RAD (figure 4(a2)–(h2)) and DF (figure 4(a3)–(h3)) in each county. In China, aerosol reductions in counties with low seasonal RAD (<250 W m−2) result in yield increases under the 20%–100% reduction scenarios (figure 4(a2)). In these areas, RAD is limited, and its enhancement due to aerosol reduction improves the yield. In contrast, in counties with seasonal RAD greater than 250 W m−2, the yield decreased under aerosol reduction (figure 4(a2)). In these areas, RAD is abundant, and DF is the limiting factor. As a result, the reduction of DF in response to aerosol mitigation decreases light use efficiency and hence yield. The threshold of RAD for yield-to-RAD sensitivity varies by region. For example, the threshold value is 250 W m−2 in the northeast (figure 4(b2)) and north (figure 4(c2)) but only approximately 210 W m−2 in the south (figure 4(h2)).
In those counties with lower seasonal DF (<0.5) (figures 4(a3)–(h3)), the yield was estimated to decline under aerosol reduction. DF is the limiting factor for yield in these counties, and aerosol reduction decreases DF. In the counties with higher seasonal DF (>0.5), the mitigation of aerosol pollution results in higher yield (figure 4(a3)) because of the enhancement of RAD and the relatively minor effect of declining DF. The thresholds of DF for yield-to-DF sensitivity are region-specific and range from 0.45 to 0.55 (figures 4(b3)–(h3)).
4. Discussion
4.1. Impact mechanism
This study investigated the changes in RAD and DF in response to aerosol mitigation and their estimated impacts on rice yield. As the amount of atmospheric particulate matter decreases, more solar radiation reaches the Earth's surface (figures 3(a1)–(a5)) (Lin et al 2015), and the amount of diffuse radiation decreases (figures 3(b1)–(b5)) (Kanniah et al 2012). The abundant light at the top canopy can cause photosynthetic saturation (Kanniah et al 2012). This phenomenon is consistent with our modelling results, i.e. a diminishing positive effect of RAD with increasing RAD over the growing season (figure 2(a1)). However, direct radiation only illuminates the upper part of the canopy, and the lower part is often deeply shaded and below photosynthetic saturation due to the spherical canopy structure (Gu et al 2003). However, the shaded lower canopy can be illuminated by the omnidirectional features of diffuse radiation, which typically results in greater light use efficiency. Our simulations reflect this mechanism: yield improvement is greater under higher DF values than lower ones (figure 2(a2)). This result is consistent with findings in a forest ecosystem (Knohl and Baldocchi 2008).
We observed some discrepancies in the estimates of the individual effects of RAD and DF between the simulations and the observations (figure 2). Several factors likely contributed to these discrepancies. First, the cultivars simulated in ORYZA are representative cultivars of each province and were selected based on available data (more details can be found in Zhang and Yang (2016)). These cultivars are not the same as the cultivars used in the 14 sites with radiation observations (figure 1). Thus, slight differences in RAD and DF thresholds can be expected because leaf features and canopy structure, which determine radiation use, vary among different rice cultivars (Knohl and Baldocchi 2008). Second, the regressions of the observation data were constructed to control for some potentially confounding variables (i.e. TAVG and technology improvement), and the sample size was markedly smaller (n = 159) than that used for the regressions of the simulated data. Higher numbers of regression variables and lower sample sizes both reduce the power to detect significant effects. Future investigations are needed as more observed data become available. Despite these differences, the response slopes of yield sensitivity to RAD and DF are similar between the simulated and observed data (figure 2).
Our model revealed an increase in yield with higher RAD and a concurrent decrease in yield with lower DF. The net effect of the two contrasting processes, as predicted by our model, is a gradual slowing of yield increase with larger aerosol reductions (figure 4(a1)). This pattern differs from the linear increase simulated by previous studies (Chameides et al 1999, Tie et al 2016) because the impacts of diffuse radiation were considered in the present study. Our model shows that the mitigation of aerosol pollution is predicted to result in yield increases in those counties with seasonal RAD less than 250 W m−2 (figure 4(a2)). However, for those counties with greater RAD, RAD increases are not beneficial because the crop is near its photosynthetic saturation point, and the concurrent decline in DF results in a decrease in yield (figure 4(a3)).
Based on our simulation results, the threshold of DF for yield-to-aerosol sensitivity is 0.5 (figure 4(a3)), which means that a DF of approximately 0.5 is when yields generally increase. The range of the DF threshold is between 0.45 and 0.55 depending on the region (figures 4 (b3)–(h3)). This value falls within the ranges reported for rice (0.5 to 0.7) (Greenwald et al 2006, Zheng et al 2011) but is lower than the values (0.6–0.9) reported for forest (Alton and North 2007, Mercado et al 2009, Oliphant et al 2011). These differences in threshold DF are likely related to the diversity of canopy structures and the variation in the leaf area index among plants (Knohl and Baldocchi 2008).
4.2. Comparisons with previous estimates
In the simulations, aerosol reduction in China had an overall positive effect on rice, with yield increases occurring primarily in the eastern, central, and southern regions of China (figure 3). In contrast, yield declines were estimated in some counties located in the northeast, north and south regions (figure 3). Based on our model, yield improvement under the scenario of no aerosol pollution was estimated to be approximately 2.6% (table 2). This estimate is lower than the simulated yield increases of 5%–30% reported by Chameides et al (1999) and of 3%–5% reported by Tie et al (2016) for rice. Such discrepancy is again attributed to the omission of DF effects in previous studies. In this study, we employed a radiation transfer model and a crop model, which revealed that the decrease in DF associated with lower aerosol levels partly offsets the positive effect of increased RAD. This finding suggests that the role of diffuse radiation is as important as the total amount of incoming radiation for the accumulation of plant photosynthetic products (Greenwald et al 2006, Alton and North 2007, Xin et al 2016).
Table 2. Percentage changes in RAD, DF and yield (weighted by rice production area) relative to PD in each region under different aerosol reduction scenarios. The numbers in italics are not significant(p > 0.05), and the numbers in regular font are statistically significant (p < 0.05), as determined by paired t-tests.
| Region | 20% reduction | 40% reduction | 60% reduction | 80% reduction | 100% reduction |
|---|---|---|---|---|---|
| Northeast | |||||
| RAD | 1.4 | 2.9 | 4.4 | 6.0 | 7.6 |
| DF | −3.3 | −6.8 | −10.5 | −14.5 | −18.9 |
| Yield | 0.2 | 0.3 | 0.2 | −0.1 | −0.4 |
| North | |||||
| RAD | 2.3 | 4.6 | 7.1 | 9.6 | 12.3 |
| DF | −3.6 | −7.4 | −11.8 | −16.6 | −22.0 |
| Yield | 1.6 | 3.1 | 4.3 | 5.3 | 5.9 |
| Northwest | |||||
| RAD | 1.0 | 2.0 | 3.1 | 4.1 | 5.2 |
| DF | −2.4 | −5.0 | −7.7 | −10.6 | −13.6 |
| Yield | 0.3 | 0.6 | 0.8 | 0.9 | 0.9 |
| East | |||||
| RAD | 2.2 | 4.4 | 6.8 | 9.2 | 11.8 |
| DF | −3.3 | −6.9 | −10.8 | −15.3 | −20.2 |
| Yield | 1.5 | 2.8 | 3.9 | 4.7 | 5.1 |
| Central | |||||
| RAD | 1.7 | 3.4 | 5.1 | 7.0 | 8.9 |
| DF | −3.0 | −6.2 | −9.7 | −13.5 | −17.7 |
| Yield | 0.8 | 1.5 | 2.1 | 2.4 | 2.5 |
| Southwest | |||||
| RAD | 1.2 | 2.3 | 3.5 | 4.8 | 6.0 |
| DF | −1.5 | −3.1 | −4.9 | −6.7 | −8.8 |
| Yield | 0.6 | 1.2 | 1.7 | 2.1 | 2.4 |
| South | |||||
| RAD | 1.3 | 2.7 | 4.0 | 5.4 | 6.9 |
| DF | −2.5 | −5.2 | −8.0 | −11.0 | −14.2 |
| Yield | 0.4 | 0.7 | 0.8 | 0.9 | 0.9 |
| China | |||||
| RAD | 1.6 | 3.3 | 5.0 | 6.8 | 8.7 |
| DF | −2.8 | −5.8 | −9.1 | −12.7 | −16.6 |
| Yield | 0.8 | 1.5 | 2.1 | 2.4 | 2.6 |
4.3. Other mechanisms through which air pollution might affect rice yield
This study focuses on the changes in RAD and DF induced by aerosol mitigation and the consequent influences on the photosynthetic processes of rice. However, we recognize that lower levels of atmospheric aerosols also cause higher temperatures (Li et al 2016), alter cloud properties (Fan et al 2016) and precipitation patterns (Jiang et al 2016), which might also affect rice. For example, as heat stress is harmful to rice (Zhang et al 2013), increased temperature might further offset the yield benefits obtained from the increase in RAD obtained under aerosol reduction. Additionally, several studies have documented highly detrimental effects of ozone on plant health and productivity (Ainsworth et al 2012, Tang et al 2013, Feng et al 2015). Ozone was found to reduce rice yield in China by 12% (Shi et al 2009), which is higher than the net effect of RAD and DF estimated in the present study. This finding suggests that relative to ozone damage, aerosols might play a secondary role in affecting crop yields. Finally, the relationships between air pollution variables and agricultural variables are not all one-way effect. For example, agricultural fertilizer is a major cause of NH3 emissions (Liu et al 2017), which form secondary inorganic aerosols (Wu et al 2016) and reduce radiation. Therefore, a trade-off between the positive effect of fertilization and the harmful effect of air pollution might exist. The abovementioned processes are not considered in the current study. An integrated modelling approach is required to consider the interactive effects of aerosol pollution on agricultural outputs in our future assessments.
Acknowledgments
We appreciate the insightful suggestions of anonymous reviewers to improve this work. This work was supported by China's National Key Research Special Program—the 5th project (2016YFC0207705), National Natural Science Foundation of China (41661144006), and Newton Fund (AHKF-7DZH3G).