

Abstract
High latitude ecosystems are prone to phenological mismatches due to climate change- driven advances in the growing season and changing arrival times of migratory herbivores. These changes have the potential to alter biogeochemical cycling and contribute to feedbacks on climate change by altering greenhouse gas (GHG) emissions of carbon dioxide (CO2), methane (CH4) and nitrous oxide (N2O) through large regions of the Arctic. Yet the effects of phenological mismatches on gas fluxes are currently unexplored. We used a three-year field experiment that altered the start of the growing season and timing of grazing to investigate how phenological mismatch affects GHG exchange. We found early grazing increased mean GHG emission to the atmosphere despite lower CH4 emissions due to grazing-induced changes in vegetation structure that increased uptake of CO2. In contrast, late grazing reduced GHG emissions because greater plant productivity led to an increase in CO2 uptake that overcame the increase in CH4 emission. Timing of grazing was an important control on both CO2 and CH4 emissions, and net GHG exchange was the result of opposing fluxes of CO2 and CH4. N2O played a negligible role in GHG flux. Advancing the growing season had a smaller effect on GHG emissions than changes to timing of grazing in this study. Our results suggest that a phenological mismatch that delays timing of grazing relative to the growing season, a change which is already developing along in western coastal Alaska, will reduce GHG emissions to the atmosphere through increased CO2 uptake despite greater CH4 emissions.
Export citation and abstract BibTeX RIS

Original content from this work may be used under the terms of the Creative Commons Attribution 3.0 licence.
Any further distribution of this work must maintain attribution to the author(s) and the title of the work, journal citation and DOI.
Introduction
The potential for phenological mismatches between consumers and their resources as a result of changing climate is particularly acute in high latitude regions where the growing season is advancing rapidly due to increasing temperatures (Serreze and Francis 2006, Barber et al 2008, IPCC 2013). In these regions, herbivores that time their migration using photoperiod or cues in their wintering habitat that are not directly related to temperature in their summer habitat, may arrive late relative to vegetation phenology thus altering the timing of their grazing with respect to the growing season (Doiron et al 2015, Clausen and Clausen 2013). Both herbivory and the timing of the growing season are important controls on biogeochemical cycling and greenhouse gas (GHG) emissions from high latitude regions (Humphreys and Lafleur 2011, Cahoon et al 2016, Metcalfe and Olofsson 2015, Kelsey et al 2016). Therefore the interacting effects of changes to the start of the growing season and grazing phenology may have implications for regional GHG budgets. However, the effect of a phenological mismatch on GHG exchange in high latitude ecosystems remains unexamined.
Phenological mismatch between grazing and the growing season has the potential to alter regional GHG fluxes by changing the local environmental conditions that control gas exchange. An earlier or prolonged growing season at high latitudes may increase CO2 uptake by promoting vegetation growth and increasing primary productivity (Cahoon et al 2016, Ueyama et al 2013). However, the effects of grazing may counteract an advanced growing season because grazing decreases biomass (Sjögersten et al 2008) and reduces net CO2 uptake (Sjörgersten et al 2012, Cahoon et al 2012), despite the potential for increased CO2 emission through soil respiration in response to less shading and warmer soil temperatures (Risch et al 2013, Welker et al 2004). In contrast, some grazing exclosure studies in high latitude systems suggest the opposite response with grazing exclusion resulting in greater CO2 emission, particularly where there is a change in species composition in response to the removal of grazing (Falk et al 2015, Metcalfe and Olofsson 2015, Lara et al 2017). While the mechanisms are complex, it is clear that presence or absence of grazing is an important driver of CO2 flux through effects on soil and vegetation properties, and changes in timing of grazing is also likely an important control on local CO2 flux.
Phenological mismatch may also alter CH4 and N2O fluxes from northern ecosystems. Anoxic soils within northern wetlands are a source of CH4 that may increase with warming and contribute to a GHG source (Bousquet et al 2011, Turetsky et al 2014, Bloom et al 2010), particularly in regions influenced by herbivory (Kelsey et al 2016). Grazing can also increase CH4 flux by decreasing diffusive resistance to CH4 transport through plant biomass (Dingemans et al 2011). Conversely, grazing can reduce CH4 fluxes by decreasing biomass and slowing the delivery of carbon to the soil (Ding et al 2005, Chen et al 2014), or through changes to species composition (Falk et al 2015). Northern wetlands also produce N2O under the appropriate soil moisture, temperature and nutrient conditions (Ma et al 2008, Tian et al 2012, Stewart et al 2014). Few studies have investigated effects of herbivory on N2O, but research indicates trampling and fecal input can increase the rates of N cycling (Zacheis et al 2002, Oenema et al 1997, Gao et al 2008), which could influence N2O flux. These results suggest grazing and growing season conditions can affect GHG fluxes, but how timing of grazing and growing season onset will influence these processes remains an important outstanding question.
The coastal region of the Yukon-Kuskokwim (Y-K) Delta in western Alaska is experiencing rapid climate change that has created a phenological mismatch between the start of the growing season and grazing by the primary herbivores of the region, migratory geese. Over the last 30 years increasing temperatures have led to an advance in the onset of the growing season of 2.6 days per decade (determined from 50% of maximum normalized difference vegetation index, D. Douglas, unpubl. data, methods described in Ross et al 2017). In contrast, the hatch date of Pacific blank brant (Branta bernicla nigricans), which marks the start of the intense grazing season of the most prominent grazers at this site, has advanced only 1.4 days per decade (Fischer et al 2017). These changes have resulted in a phenological mismatch of 4 days since the early 1980s such that the geese start to graze 'late' relative to the growing season. The goal of this research is to determine how such a trophic mismatch affects GHG fluxes. We used a field experiment with controlled conditions to manipulate the start of the growing season and the timing of grazing to investigate the following questions: (1) How does change in the timing of grazing relative to the growing season alter GHG fluxes? (2) What are the controls on each component of GHG exchange (i.e. CO2, CH4, and N2O) in this system? The results of this study will help determine how changing phenology of vegetation and grazing interact as controls on GHG emissions, and the potential implications for phenological mismatch to alter GHG exchange in high latitude ecosystems.
Table 1. Description of study design indicating how timing of grazing and growing season treatments contribute to phenological mismatch. Typical grazing is matched with long-term historical means, early and late grazing started respectively 21 days before and after typical grazing. Advanced spring was estimated to be 22 days early (supplemental figure 2). The typical grazing, advanced growing season scenario is the most likely consequence of climate change.
| Grazing | Growing season | Result | Mismatch? |
|---|---|---|---|
| Early | Ambient | Geese arrive 21 days early; spring typical | Early grazing |
| Early | Advanced | Geese arrive 21 days early; spring 22 days early | No mismatch |
| Typical | Ambient | Geese arrive typical time; spring typical | No mismatch |
| Typical | Advanced | Geese arrive typical time; spring 22 days early | Late grazing |
| Late | Ambient | Geese arrive 21 days late; spring typical | Late grazing |
| Late | Advanced | Geese arrive 21 days late; spring 22 days early | Late grazing |
| None | Ambient | Geese do not arrive; spring 22 days early | No grazing |
| None | Advanced | Geese do not arrive; spring typical | No grazing |
| Control | Ambient | No treatment | Ambient conditions |
Materials and methods
Study site
This study was conducted in the central coastal region of Y-K Delta in western Alaska (61.247 °N, −165.616 °W; supplemental figure 1 available at stacks.iop.org/ERL/13/044032/mmedia). The Y-K Delta is composed of 75 000 km2 of coastal tundra along the Bering Sea, between the Yukon and Kuskokwim Rivers. Vegetation in the coastal region is characterized by a gradient from the barren tidal mud flats, to wet sedge meadows dominated by Carex, to moist meadows on slough levees (Jorgenson 2000). Permafrost is absent in the coastal region of the Y-K Delta where this study site is located. Our study site is located within a colony of Pacific black brant (brant hereafter) that use the area as nesting and brood rearing habitat. Brant, and the other primary grazers at this site, cackling geese (Branta hutchinsii), do not grub during the breeding season rather they eat only aboveground parts of the local Carex vegetation (Sedinger and Raveling 1984), and their grazing results in the formation of grazing lawns.
Experimental design
Our study was a field experiment with a factorial design consisting of four timing of grazing treatments (early, typical, late and no grazing) crossed with two timing of growing season treatments (advanced and ambient) for a total of eight treatments. Our experiment also included 'background' grazing plots (table 1) that were naturally grazed through the summer and fall. Timing of grazing was manipulated using captive brant and was designed to align with the timing of maximal use of the grazing lawns. The start of the early and late treatments differed by 21 days from the start of typical grazing on 20 June (Fischer et al 2017) to simulate several scenarios of phenological mismatch: both where grazing is early relative to the growing season (early grazing, typical growing season), and the more likely scenario for this region where grazing occurs late relative to the growing season (typical grazing, advanced growing season). All treatments were grazed at the same intensity: two geese for four 24 hour periods, two weeks apart, which is equal to 7.2 goose-hours m−2 month−1 (comparable to Herzog and Sedinger 2004). The background grazing plots were naturally grazed throughout the summer. Prior to each round of grazing geese were held without food for two hours to allow any feces from captive feed to pass through their digestive system (Prop and Vulink 1992). The birds were also held for an additional two hours after grazing in order to recover and return any feces deposited to the appropriate experimental plots.
The start of the growing season was manipulated using passive open-topped chambers (OTCs; 85 cm base diameter base tapering to 50 cm diameter top, 30 cm tall) that warmed the soil from 1 May until 1 July each season. While often used to increase temperature, OTCs also accelerate growth at the start of the season (Sullivan and Welker 2005, Post et al 2008). Therefore, OTCs were left on plots long enough to advance the growing season but not have season-long warming effects. OTCs were temporarily removed for 24 hours at a time during goose grazing treatments before their permanent removal on July 1. The OTCs advanced the growing season by 22 days (supplemental figure 2).
Our study was composed of six experimental blocks established within grazing lawns. Each block contained a replicate plot of all eight treatments plus the background for a total of 54 plots, each ca. 1.13 m2 (supplemental figures 3(a) and (b)). The treatments were initiated in May 2014 and remained in place for three summers; measurements for this study were done during the third year of treatment. To remove background grazing, exclosures were installed around all treatment plots from 1 May through 25 August. Exclosures were designed to surround two plots at a time according to the implementation of the grazing treatment (i.e. the advanced growing season, early grazing plot was grazed at the same time as the ambient growing season, early grazing plot; supplemental figures 3(c) and (d)).
Greenhouse gas measurements and environmental conditions
GHG exchange was measured approximately two times per week at each plot between 2 June and 18 August 2016 for a total of 18 dates for CO2 and 19 dates for CH4 and N2O. Flux chamber collars were installed in each plot in early May. The collars (10 cm tall, 15 cm diameter) were inserted approximately 5 cm into the soil, left in place for more than 48 hours before measurement and remained in the ground undisturbed all season. A chamber (21 cm tall, 13 cm diameter, with a 5 cm flange around the base) was used to measure gas exchange. During measurement the chamber was attached to the collar to create a gas-tight seal, and a fan was used inside the chamber to avoid stratification. All gas exchange measurements were made within 5 hours of solar noon. CO2 exchange was measured on five blocks (45 plots), and CH4 and N2O exchanged were measured concurrently on three blocks (27 plots). Due to constraints on how the equipment could be moved around the field site, one block that was measured for CH4 and N2O exchange was not measured for CO2 fluxes. CO2 exchange was occasionally measured on different dates than CH4 and N2O exchange, and therefore the measurement dates were organized into sampling occasions for the purpose of statistical analyses.
Measurements of CO2 exchange were made by circulating gas from the chamber to an infrared gas analyzer (supplemental table 1). Net ecosystem exchange (NEE) was measured using a translucent chamber. After the translucent chamber was removed from the collar and allowed to equilibrate with the ambient atmosphere, the chamber was placed back on the collar and covered with an opaque cloth to obtain a measurement of ecosystem respiration (ER). CO2 flux was calculated using an exponential model of change in concentration through time between 30s to 120s after deployment. The difference between ER and NEE was used to determine gross primary productivity (GPP). CH4 and N2O exchange were measured by circulating gas from the chamber to a cavity ring-down spectroscopy analyzer. CH4 and N2O concentrations were measured every 5 seconds for 3 minutes. CH4 and N2O fluxes were determined using the change in concentration through time between approximately 60s and 180s after chamber deployment using a non-linear model specifically designed for these gases (Hutchinson and Mosier 1981). All fluxes were corrected for water content. Mean combined GHG emissions expressed in CO2 equivalents were determined using the 100 year horizon global warming potential of 34 for CH4, and 298 for N2O (Myhre et al 2013). Seasonal mean GHG flux in CO2 equivalents was calculated by multiplying the seasonal mean flux by the global warming potential for each gas.
Local environmental and soil conditions were measured through a combination of in situ measurements and continuous sensors with data loggers (supplemental table 1). A local meteorological station collected continuous measurements of air temperature at 2 m, precipitation at 0.5 m, and photosynthetically available radiation (PAR) at 2.5 m. Soil temperature at each plot was measured 10 cm below the soil surface. In situ measurements of vegetation height within the collars were made every 10 days throughout the season. Total biomass within each flux collar was determined at the end of the study by harvesting and obtaining a dry weight.
Statistical analyses
To assess the effectiveness of our advanced growing season treatments, we determined that our treatment advanced the season by ca. 22 days (already presented in supplemental figure 2). To assess the effectiveness of our grazing treatments we compared GHG fluxes among the timing of grazing treatments and the background plot using analysis of variance (ANOVA).
To explore how phenological mismatch affects GHG fluxes (Question 1), and controls on CO2, CH4, and N2O exchange (Question 2), we used a linear mixed modeling framework with GHG flux as the response variable, soil temperature, air temperature, PAR, biomass, and stem height as continuous predictor variables, timing of growing season and timing of grazing treatments as categorical predictor variables, and block and sampling occasion as random effects. The most important variables were determined as those present in the best performing model. For each GHG we tested 41 different models plus a null model (lmer function in the R package lme4 (Bates et al 2015 R Core Development Team), supplemental table (2). All models included only biologically relevant predictor variables. Models were restricted a priori to two terms or fewer, or three terms when an interaction was present, according to the number of observations in our dataset (Bolker et al 2009). Each model suite included all possible combinations of predictor variables, both with and without interactions. Covarying predictors, including air temperature and soil temperature, and biomass and stem height, were not included in the same model. The typical-ambient plots were coded as the reference level for categorical variables. CH4 and N2O fluxes were log-transformed to produce a normal distribution prior to analysis. Continuous predictor variables were centered and scaled to produce a standard deviation of one and a mean of zero. The predictor variables met assumptions of non-collinearity and the residuals met assumptions for normality and homogeneity of variance. Model performance was evaluated by the Akaike Information Criteria (AIC; MuMIn package, Bartón K 2014, R Core Development Team). We based our model selection on AIC because it is preferred for selecting among multiple incompletely specified models (Aho et al 2014). We determined goodness-of-fit using a pseudo r2 calculated according to the recommendation of Nakagawa and Schielzeth (2013).
Results
CO2, CH4 and N2O exchange
Our results confirm this study design as a robust method for testing the effects of changing phenology on GHG fluxes because we did not identify any differences in CO2, CH4 or N2O gas exchange between typical grazing treatments and the background plots (supplemental table 3). Despite seasonal trends in temperature and solar radiation (supplemental figure 4), our measurements of GHG exchange all showed little trend through the season in CO2, CH4 or N2O fluxes (supplemental figure 5). We found that advancing the growing season resulted in a small reduction in CO2 uptake (less negative NEE; figure 1) but timing of grazing had a larger and more consistent effect on CO2 exchange (table 2, supplemental table 4). Early grazing was the only grazing treatment that reduced CO2 uptake (less negative NEE) because it increased ER more than it decreased GPP. In contrast, late grazing increased CO2 uptake (more negative NEE) as a result of greater GPP accompanied by only slight increases in ER (figure 1). CO2 uptake increased the most in response to no grazing because of large increases in GPP.
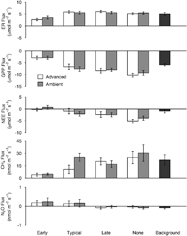
Figure 1. Study season mean gas flux under all grazing (Early, Typical, Late, None) and growing season (Advanced, Ambient) treatments. Error bars show standard error of the mean. Positive values represent an emission to the atmosphere. Dark gray represents the ambient control.
Download figure:
Standard image High-resolution imageOur modeling results suggest that GPP overwhelmed ER to control NEE. Both GPP and NEE were driven by nearly the same environmental factors: PAR, vegetation size (biomass and stem height respectively), and their interaction indicating that CO2 exchange was more strongly related to PAR in tall vegetation (pseudo r2 = 0.60 and 0.51 respectively; table 2). In contrast, ER was driven by soil temperature and timing of grazing (pseudo r2 = 0.68).
Table 2. Top performing models for greenhouse gas exchange based on AIC. Abbreviations: photosynthetically active radiation (PAR); air temperature (Air T); soil temperature at 10 cm (soil T); Stem height (Stem ht).
| Ecosystem Respiration | LogLik | AIC | delta AIC | conditional pseudo R2 |
|---|---|---|---|---|
| Model | ||||
| Biomass + Grazing | −1152.6 | 2321.1 | 0 | 0.68 |
| Biomass + Air T | −1163.4 | 2338.8 | 17.7 | 0.65 |
| Biomass + Air T + Biomass⁎Air T | −1163.4 | 2340.8 | 19.7 | 0.66 |
| Biomass + PAR | −1172.3 | 2356.5 | 35.4 | 0.65 |
| Gross Primary Productivity | LogLik | AIC | delta AIC | conditional pseudo R2 |
| Biomass + PAR + Biomass⁎PAR | −1605.1 | 3224.2 | 0 | 0.60 |
| Biomass + PAR | −1615.0 | 3242.0 | 17.8 | 0.59 |
| Biomass + Grazing | −1623.5 | 3263.0 | 38.8 | 0.54 |
| Stem ht + PAR + Stem ht⁎PAR | −1636.9 | 3287.9 | 63.7 | 0.55 |
| Net Ecosystem Exchange | LogLik | AIC | delta AIC | conditional pseudo R2 |
| Stem ht + PAR + Stem ht⁎PAR | −1659.4 | 3332.7 | 0 | 0.51 |
| Biomass + PAR + Biomass⁎PAR | −1661.0 | 3335.9 | 3.2 | 0.52 |
| Biomass + Grazing | −1667.7 | 3351.5 | 18.8 | 0.44 |
| Biomass + PAR | −1670.8 | 3353.7 | 21.0 | 0.50 |
| Methane | LogLik | AIC | delta AIC | conditional pseudo R2 |
| Biomass + Grazing | −370.7 | 757.3 | 0 | 0.74 |
| Stem ht + Grazing | −401.0 | 818.0 | 60.7 | 0.66 |
| Biomass + PAR + Biomass⁎PAR | −413.5 | 841.0 | 83.7 | 0.54 |
| Biomass + PAR | −416.0 | 843.9 | 86.6 | 0.53 |
| Nitrous Oxide | LogLik | AIC | delta AIC | conditional pseudo R2 |
| Biomass + Soil T + Biomass⁎Soil T | −226.8 | 467.6 | 0 | 0.08 |
| Biomass | −229.9 | 469.8 | 2.2 | 0.06 |
| Biomass + Air T | −229.1 | 470.2 | 2.6 | 0.07 |
| Stem ht + Soil T + Stem ht⁎Soil T | −228.3 | 470.5 | 2.9 | 0.07 |
Timing of the growing season had no consistent influence on mean CH4 emissions, but timing of grazing did influence CH4 flux (figure 1). Early grazing had the lowest CH4 emissions, and emissions increased through typical, late and no grazing (figure 1). The importance of grazing timing in controlling CH4 emissions was confirmed further by our modeling. The best performing model of CH4 flux (pseudo r2 = 0.74) included biomass and timing of grazing (table 2).
The best performing model of N2O flux contained soil temperature, biomass, and their interaction, but was quite weak (table 2; pseudo R2 = 0.08). The interaction of soil temperature and plant biomass suggests that plots with less vegetation have higher N2O emissions, particularly when soil temperatures are warm.
Seasonal global warming potential
Mean combined GHG flux expressed in CO2 equivalents suggests a summer-season GHG sink in all treatments except for the early grazing treatment (figure 2(a)). In the early grazing treatment, mean flux of CO2, CH4 and N2O all were net emissions under ambient growing season conditions (figure 2(b)). In contrast, combined GHG flux in CO2 equivalents from the late and no grazing treatments indicates a net sink because the large CO2 uptake outweighs CH4 emissions even despite the greater global warming potential of CH4. We also found a net sink in mean combined GHG flux of both the advanced and ambient growing season treatments (figure 2(a)). Throughout the study, the direction of the combined GHG flux was dominated by CO2, with CH4 as the second most influential gas in all treatments. Despite its high global warming potential, N2O emissions were so small that N2O does not contribute noticeably to combined GHG flux.

Figure 2. (a) Study season average exchange of greenhouse gases across both growing season treatments under typical timing of grazing; (b) Study season average exchange of greenhouse gases across all grazing treatments under an ambient growing season. Error bars show standard error of the mean. GHG flux is expressed in CO2 equivalents. Positive values represent an emission to the atmosphere. Typ—typical; Backgr.—background.
Download figure:
Standard image High-resolution image
Discussion
Climate change is resulting in phenological mismatch between herbivores and their forage throughout a range of terrestrial environments (Lane et al 2012, Brook et al 2015, Middleton et al 2013, but see Gustine et al 2017). Rapidly warming temperatures at high latitudes may make these regions particularly prone to phenological mismatch. While previous studies have shown the effects of these mismatches on herbivore populations (Clausen and Clausen 2013, Doiron et al 2015), our study demonstrates that mismatches can also alter GHG emissions in the summer breeding areas of migratory species. More specifically, we found that functionally late grazing can decrease summer-season GHG emissions primarily through greater CO2 uptake (figure 2). In contrast, early grazing relative to the growing season results in emissions of both CH4 and CO2. In all treatments except early goose grazing, GHG exchange was determined by opposing forcing of CO2 and CH4 fluxes, which acted as a sink and a source respectively. These results suggest that the developing phenological mismatch in coastal western Alaska, in which geese are arriving into a more phenologically advanced system, may result in increased GHG uptake during the summer season.
Rates of GHG exchange observed in our study are comparable, or slightly lower, than rates observed in similar high latitude ecosystems (Bartlett et al 1992, Kelsey et al 2016, Sturtevant and Oechel 2013). The overall exchange of GHG in this ecosystem was dominated by CO2 flux, followed by CH4 flux, with little contribution from N2O emissions (figures 2 and 3). We found that CO2 exchange contributed between 50 and 80% of the combined GHG flux expressed in CO2 equivalents (figure 2), and was controlled primarily by vegetation height and an interaction between vegetation height and PAR (table 2). While we are not aware of any existing studies that examine the effects of changes in the timing of grazing on CO2 exchange, previous studies on the effect of grazing exclusion indicate that herbivory influences CO2 exchange through herbivory-induced changes to primary productivity and local soil environment (Cahoon et al 2012, Gornall et al 2009, Falk et al 2015, Sjögersten et al 2011). Our results suggest that in addition to herbivore exclusion, timing of herbivory is also an important driver of CO2 exchange through a similar mechanism, specifically that early grazing reduces CO2 uptake by reducing primary productivity, while late grazing increases CO2 uptake by increasing primary productivity. It is also likely that the duration of herbivory, in addition to timing, influences final GHG balance.
CH4 was the second largest contributor to total GHG emissions and acted as a GHG source in all treatments (figures 2 and 3). Our results underscore the importance of the timing of grazing as a driver of CH4 emissions (table 2) and suggest that delaying grazing contributes to greater CH4 emissions through vegetation-induced increases in CH4 production. The soil of northern wetlands is often O2 poor, and vegetation can fuel CH4 oxidation by transporting O2 to the rhizosphere during photosynthesis (Ding et al 2005, Caffrey and Kemp 1991), or can stimulate methanogenesis through the production of photosynthetically-derived root exudates (Whiting and Chanton 1992, Shannon et al 1996, Lai et al 2014). Grazing is also known to stimulate root exudation of carbon (Hamilton and Frank 2001, Bardgett et al 1998) which affects soil biota and ecosystem function (Bardgett and Wardle 2003). Both of these processes may be relevant in this region because our modeling indicates biomass and timing of grazing are the most important controls on CH4 emissions in this study (table 2) and specifically that greater GPP in late grazing and no grazing treatments increases CH4 emissions to the atmosphere (figures 1 and 3).
N2O emissions did not contribute to total GHG forcing, with the exception of small emissions in the early grazing treatment (figures 2 and 3). N2O flux was controlled weakly by soil temperature, biomass, and their interaction indicating that de-vegetated plots have higher N2O flux, especially at higher soil temperature (table 2). Although the relationship is not strong, this finding is consistent with previous research, which suggests that plants at this site may directly take up amino acids, particularly because N is important for osmotic regulation of the salt-tolerant Carex species present at this study site (Ruess et al 1997). If direct uptake of amino acids by plants limits N mineralization, then denitrification may be substrate-limited, thus decreasing N2O emissions in areas with greater primary productivity and increasing flux in areas with lower primary productivity. However, without large increases in soil temperature, N2O emissions from this ecosystem will likely remain inconsequential and phenology-induced changes in GHG exchanges in this system will come from CO2 and CH4.
The developing phenological mismatch explored here is an important component of on-going change in GHG exchange in this region in response to changing climate. Even though grazing lawns compose only about 10% of the landscape in this region, they are the only portion of the landscape with appreciable CH4 emissions (Kelsey et al 2016) and are also the vegetation community expected to experience the largest increase in GHG emission with a warming or advancing growing season (Kelsey et al 2016). Our results indicate that for the experimental treatments imposed here, changes in timing of grazing have a greater effect than season advancement, highlighting the importance of timing of grazing for determining GHG flux in this region. The climatic changes that result in phenological mismatch will also likely affect other components of the ecosystem such as soil moisture and water table depth, and while extreme soil drying in this region could limit soil respiration and CH4 emissions, due to the wet nature of this coastal system it is unlikely that soil moisture will become limiting in the near future.
Our study has a few limitations that constrain our results, but do not alter our conclusions. First, like all experimental studies, our results are constrained by the experimental treatments imposed. Our experiment explored only one scenario of advanced growing season (ca. 21 days), and it is possible that stronger or earlier warming could result in larger growing season effects on GHG exchange. Similarly, a phenological mismatch of less than 21 days could result in smaller effects on GHG exchange. In either case the nature of the change may affect the strength of the GHG response, but not the direction (sink versus source). Second, the logistical constraints associated with our remote study site limited the temporal resolution of our flux measurements to approximately two measurements per week, thus we report seasonal mean GHG emissions rather than a season-long cumulative GHG balance. However, we are confident our study design is sufficient to characterize the direction of summer season GHG exchange in this ecosystem for several reasons. First, the largest contributor to GHG exchange at this site is CO2 which is also generally less spatially and temporally variable than CH4 and N2O (Dai et al 2012). While CH4 exchange has the potential to be more spatially and temporally variable than CO2, it is clear that the frequency of our observations allowed us to account for large variability in CH4 fluxes (supplemental figure 5). Finally, N2O fluxes at this site are so small that they are essentially zero, and therefore these fluxes do not affect net GHG balance.
In high latitude regions, temperatures are projected to continue increasing at a faster rate than the rest of the globe with increases up to 5° C by 2100 (Myhre et al 2013), and this trend will likely further exacerbate phenological mismatch in this region (Clausen and Clausen 2013). Our results suggest that phenological mismatch, particularly a change in the timing of grazing, is important for future GHG emissions in high latitude wetland ecosystems which cover ~346 Mha in the northern hemisphere. Increasing the strength of the phenological mismatch already developing between brant and their forage in western Alaska will likely increase the summer-season GHG sink by promoting primary productivity that will override the concurrent increase in CH4 emissions. However, it is also possible that changing migration patterns of brant in this region, such as the increasing percent of brant overwintering further north (Ward et al 2009), could prompt geese to arrive earlier in the Y-K Delta relative to the growing season and switch the summer-season GHG flux from negative to positive. Finally, the largest changes to GHG emissions at this site would occur if this ecosystem was not grazed. Researchers have identified long-term declines in brant population at this site (Leach et al 2017), and some have hypothesized that the populations may decrease on the Y-K Delta while increasing in other areas, such as the North Slope of Alaska where they also breed and molt, if forage quality becomes more beneficial elsewhere (Flint et al 2008, Tape et al 2013). This scenario would increase CH4 emissions, but also CO2 uptake, and ultimately result in the most substantial increase in summer season average GHG uptake. Taken together our results suggest that projections of the role of arctic and subarctic ecosystems in the global climate system should account for climate-driven changes in grazing phenology to characterize how emissions and the source/sink status of these ecosystems will change under future climate conditions.
Acknowledgements
This work was supported by the National Science Foundation Arctic System Science Program awards 1304523 and 1304879, and by the Utah Agricultural Experiment Station, Utah State University, and approved as journal paper number 9002. We are grateful to David Douglas of the USGS for sharing data on season advancement in western Alaska. We would also like to thank Kaj Lynöe, Lindsay Carlson, Thomas DeMasters and Mike Sullivan for field assistance, and the staff of Yukon Delta Wildlife Refuge for assistance obtaining the appropriate permits to enable our research. The following permits were obtained for this work: Alaska Department of Fish & Game Scientific Collection permit number 16–23, US Fish & Wildlife Service NWR Refuge Special Use Permit number FF07RYKD0-14-06, US Fish & Wildlife Service Migratory Bird Scientific Collection permit: MB28352B-0. The data from this study are published online on the NSF Arctic Data Center repository under identifiers arctic-data.13841.1 (doi: 10.18739/A24R34) and arctic-data.13843.1 (doi: 10.18739/A28J6F). Any use of trade, firm, or product names is for descriptive purposes only and does not imply endorsement by the US Government.