

Abstract
The last major volcanic eruptions, the Agung in 1963, El Chichon in 1982 and Pinatubo in 1991, were each associated with a cooling of the troposphere that has been observed over large continental areas and over the Western Pacific, the Indian Ocean and the Southern Atlantic. Simultaneously, Eastern tropical Pacific temperatures increased due to prevailing El Niño conditions. Here we show that the pattern of these near-surface temperature anomalies is partly reproduced with decadal simulations of the EC-Earth model initialised with climate observations and forced with an estimate of the observed volcanic aerosol optical thickness. Sensitivity experiments highlight a cooling induced by the volcanic forcing, whereas El Niño events following the eruptions would have occurred even without volcanic eruptions. Focusing on the period 1961–2001, the main source of skill of this decadal forecast system during the first 2 years is related to the initialisation of the model. The contribution of the initialisation to the skill becomes smaller than the contribution of the volcanic forcing after two years, the latter being substantial in the Western Pacific, the Indian Ocean and the Western Atlantic. Two simple protocols for real time forecasts are investigated: using the forcing of a past volcanic eruption to simulate the forcing of a new one, and applying a two-year exponential decay to the initial stratospheric aerosol load observed at the beginning of the forecast. This second protocol applied in retrospective forecasts allows a partial reproduction of the skill attained with observed forcing.
Export citation and abstract BibTeX RIS

Original content from this work may be used under the terms of the Creative Commons Attribution 3.0 licence.
Any further distribution of this work must maintain attribution to the author(s) and the title of the work, journal citation and DOI.
1. Introduction
Volcanic eruptions can significantly impact the climate system by injecting large amounts of sulphate aerosols into the stratosphere. These particles cool the troposphere by reflecting incoming solar radiation and warm the stratosphere by absorbing the outgoing longwave radiation. This radiative forcing can decrease the global mean surface temperature by several tenths of degrees and induce regional cooling that can exceed one degree (Swingedouw et al 2017), with also large impact on precipitation rates (Iles and Hegerl 2014). The global impact of a volcanic eruption is largely dependent on its magnitude. Forcings of different volcanic eruptions with similar magnitudes have similarities even in the case of volcanoes located at different longitudes, because volcanic aerosols are quickly advected by the zonal circulation in the stratosphere. However, the atmospheric conditions at daily to annual timescales modulate the regional imprint of the volcanic forcing (Trepte et al 1993, Jones et al 2016).
Large eruptions also excite dynamical responses. Observations show an increase in the occurrence of the positive phase of the Northern Atlantic Oscillation (NAO) during the three winters following the 8 largest eruptions of the last millennium (Swingedouw et al 2017), a signal associated with positive temperature anomalies over Northern Eurasia (Ortega et al 2015). However, the volcanoes that erupted during the instrumental era, i.e. from 1850, are too small and too few to allow the detection of any significant NAO signal over this period. The first studies investigating the volcanic imprint on the climate system with the historical simulations of the Coupled Model Intercomparison Project 3 and 5 (CMIP, Taylor et al 2012) suggest a weak response of the winter NAO to volcanic eruptions, both in CMIP3 (Stenchikov et al 2006) and in CMIP5 (Driscoll et al 2012). Nevertheless, there is evidence for a modulation of the stratospheric circulation after volcanic eruptions that is related to a dynamical response of the atmosphere (Kodera 1994, Robock 2000, Shindell et al 2004, Graf et al 2007). Several model studies highlighted modifications of wave activity leading to a strengthening of the polar vortex after volcanic eruptions (Bittner et al 2016a), an impact that depends on the space-time structure of the volcanic forcing (Toohey et al 2014). Model studies require large ensemble experiments (∼40 members) to detect polar vortex changes (Bittner et al 2016b) or NAO signals (Ménégoz et al 2017) after volcanic eruptions because of small signal to noise ratios. Zambri and Robock (2016) showed that the CMIP5 models reproduce a winter warming after volcanic eruptions. The apparent contradiction between this warming and the lack of positive NAO signal in CMIP5 experiments has been resolved by (Barnes et al 2016) who demonstrated the need to consider this dynamical response at the intra-seasonal scale and separately for different eruptions to be detected.
During the last decades, the last three major eruptions, Agung (March 1963), El Chichón (March 1982) and Pinatubo (June 1991), coincided with the onset of El Niño events varying in magnitude depending on the eruption. The climate internal variability triggers El Niño events every 2–7 years. When considering only three eruptions over half a century, it is statistically impossible to demonstrate any causal relationship between volcanic eruptions and these Niño events because these may have occurred simultaneously by chance. As reviewed by Swingedouw et al (2017), proxy-based temperature reconstructions over the last millennium show an increase in the frequency of El Niño events the year after large volcanic eruptions, which then were followed by La Niña conditions. The ENSO response to volcanic eruptions has been widely investigated using climate models. Several studies show an increase of the probability of El Niño conditions after volcanic eruptions (Schatten et al 1984, Hirono 1988, Ohba et al 2013, Maher et al 2015, Pausata et al 2015a) whereas (Ding et al 2014) did not find an ENSO signal related to volcanic eruptions. Finally, Pausata et al (2016) and Khodri et al (2017) showed that the volcanically forced-impact on the ENSO variability depends on the Pacific Ocean initial state at the time of the eruption, and may be small relatively to unforced internal variability.
Climate models are able to reproduce, at least partly, the response of both the ocean and the atmosphere to volcanic eruptions (Swingedouw et al 2017). However, modelling approaches used to simulate the climate response to volcanic eruptions are hindered by the difficulty to accurately estimate the spatio-temporal evolution of the volcanic aerosols in the atmosphere (e.g. Sato et al 1993 2012, Ammann et al 2003, Gao et al 2008, Eyring and Lamarque 2013). The dynamical response to large eruptions, in relation to ENSO, NAO or any mode of variability is challenging to simulate because it could be modulated by the climate background conditions (Zanchettin et al 2013, Pausata et al 2015b, Ménégoz et al 2017). Moreover, it is difficult to detect such dynamical signal as it is often overwhelmed by internal variability at seasonal to decadal timescales.
Understanding the climate response to volcanic eruptions is of major importance when developing decadal forecast systems for two main reasons. First, forecast systems need to be able to predict the climate response to the next future volcanic eruption. Such a goal can be considered, for example, by developing idealized volcanic forcing designed for real-time forecast (Toohey et al 2016), that should be adapted as a function of the atmospheric circulation patterns during the volcanic eruption (Jones et al 2016). Second, the period typically considered to estimate the model biases covers the last decades and includes therefore the three last major eruptions (Agung, El Chichón and Pinatubo). An accurate forecast system has to simulate correctly the climatic response to these eruptions, leading to a cooler climate than it would have been without these. The prediction skill of forecast systems is commonly evaluated by running hindcasts, defined as retrospective forecast including an estimate of the observed external forcings, and in particular the volcanic forcing (e.g. Smith et al 2007, Doblas-Reyes et al 2013, Meehl et al 2013). Recently, Timmreck et al (2016) used two sets of hindcasts covering the last decades, one including and one excluding the volcanic forcing, to demonstrate that a significant part of the skill of their decadal forecast system was associated with the volcanic forcing.
Table 1. EC-Earth v2.3 experiments used in this study. All experiments are 5 year simulations performed with 5 member ensembles (see text) and initialised each year in November.
| Experiment | Start date (November for all the experiments) | Volcanic forcing | Initialisation |
|---|---|---|---|
| Volc-Init | Each year over 1961–2001 | Estimation from observed forcing | From observations |
| Volc-NoInit | 1850 | Estimation from observed forcing | Spin-up 1850–1961 |
| NoVolc-Init | Each year over:1961–1964;1980–1983; and 1989–1992 | Stratospheric aerosol load set to background value (average of the forcing over 1850–2012) | From observations |
| IdealVolc1-Init | 1 year exponential decay of the stratospheric aerosol load from the observed initial state | ||
| IdealVolc2-Init | 2 year exponential decay of the stratospheric aerosol load from the observed initial state | ||
| SwitchVolc-Init | 1963, 1982, 1991 | Volcanic forcings switched between eruptions: 1963: Agung replaced by El Chichon; 1982: El Chichon replaced by Agung; 1991: Pinatubo replaced by el Chichon. |
This work aims: (1) to investigate the climate variability related to volcanic eruptions considering observational datasets and atmosphere-ocean general circulation model experiments based on different configurations; (2) to check the ability to predict the climate response to volcanic eruptions by diagnosing the skill of a forecast system related to volcanic aerosols in both decadal hindcasts and real-time forecasts, comparing it with the skill related to the initialisation of the forecast. In this context, we investigate a set of simple idealized forcings that could be used to predict the climate response to a new volcanic eruption. The experiment protocol is presented in the second section. The response of the near-surface temperature to volcanic eruptions in observational datasets and model experiments is described in the third section. In the fourth section, we compute the skill of forecast systems including different ways of simulating the volcanic forcing. Finally, the fifth section is a summary of the strategies recommended to predict the climate response to a volcanic eruption.
2. Experimental setup
This study is based on the EC-Earth ocean-atmosphere coupled model version 2.3. (Hazeleger et al 2012) demonstrated that EC-Earth 2.3 is able to simulate well the main patterns of inter-annual climate variability, even if it has a general cold bias in terms of surface temperature. Here, EC-Earth 2.3 is used as a forecast system as described in (Doblas-Reyes et al 2018), to run decadal hindcasts over 1961–2001, using the observed forcing and initialised from estimates of the observed climate state: ORAS4 reanalysis for the ocean component (Mogensen et al 2011, Balmaseda et al 2012), ERA40 reanalysis for the atmosphere and land surface before 1989 and ERA-interim one afterwards (Uppala et al 2004, Dee et al 2011), and sea-ice initial conditions generated with the respective ocean-atmosphere coupled model forced by the DFS4.3 atmospheric surface fields (Brodeau et al 2010). Such forecasts cannot be considered as real-time forecasts, since they use observational estimates of the natural and anthropogenic forcings, mainly greenhouse gases, aerosols, as well as changes of solar irradiance and land use (Hazeleger et al 2012). The volcanic forcing is estimated from the observations of the aerosol optical depth (AOD) described in (Sato et al 1993, 2012; see supplementary material available at stacks.iop.org/ERL/13/064022/mmedia).
The experiments carried out in this study are described in table 1. The main experiment, Volc-Init, is a 5 member ensemble of 5 year forecasts initialised from observations in November each year over the period 1961–2001 and using historical forcings as described previously. The 5 member ensemble is generated by perturbing infinitesimally the 3D temperature in the initial conditions of the atmosphere and the ocean. To evaluate and investigate the effects of the initialisation and the volcanic forcing separately, we carried out a set of sensitivity experiments, considering Volc-Init as a reference. Volc-NoInit is a historical simulation without initialising from observations but rather from a pre-industrial control simulation (1850–1961 is considered as a spin-up), using the same reconstruction of the observed volcanic forcing as Volc-Init. Several experiments were carried out in which the predictions are initialised from the 4 years surrounding the last major eruptions (1961–1964, 1980–1983 and 1989–1992) as in Volc-Init, but with a volcanic forcing that is replaced by different stratospheric aerosol loads: (i) NoVolc-Init is forced with a background value of stratospheric aerosol forcing, computed as the mean over the period 1850–2012 from the updated Sato et al (1993) estimate, a method to exclude volcanic eruptions; (ii) IdealVolc1-Init and IdealVolc2-Init are two experiments in which the stratospheric aerosol load decreases from the initial state with a one-year and a two-year exponential decay respectively. In these experiments, the initial state of the volcanic forcing is the value extracted from the (Sato et al 1993) dataset at the date corresponding with the beginning of the forecast; (iii) SwitchVolc-Init is based on interchanging the forcings of the last three eruptions. The order in which the eruption forcings have been switched in this experiment is subjective. Due to limited computational resources, SwitchVolc-Init was run only for the three start dates corresponding with the years of the Agung, El Chichón and Pinatubo eruptions. IdealVolc1-Init, IdealVolc2-Init and SwitchVolc-Init are sensitivity tests of idealized forcings that could be used in a real-time forecast following a future volcanic eruption, for which we would have initial observations of its radiative perturbation but no information of its future evolution.
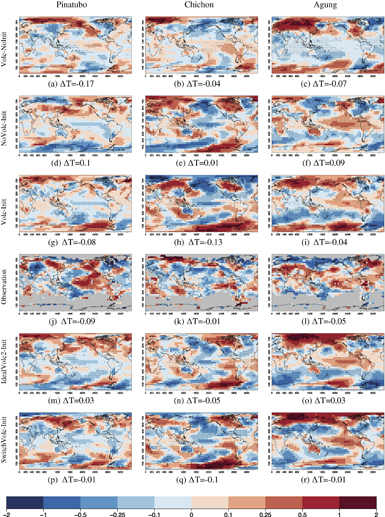
Figure 1. Three-year mean near-surface temperature anomaly after the volcanic eruptions (computed from the month of January that follows the eruption, with respect to modelled or observed climatology computed over 1961–2001), after the Pinatubo (left), El Chichón (middle) and Agung (right) eruptions: (abc) historical simulation including the volcanic forcing and without initialisation from the observation; (def) forecast setting up the stratospheric aerosol load to background levels (NoVolc-Init); (ghi) forecast initialised from observations and including a volcanic forcing based on observations (Volc-Init); (jkl) HadCRUT4 observations (Morice et al 2012); (mno) forecasts based on an idealized volcanic forcing corresponding to a two-year exponential decay of the stratospheric aerosol load observed at the timing of the initialisation (IdealVolc2-Init); (pqr) forecast including switched volcanic forcings (SwitchVolc-Init, replacing Pinatubo with El Chichón, El Chichón with Agung and Agung with El Chichón); the anomalies are detrended to exclude long-term trends over 1961–2001 and dotted areas show anomalies significant at the 95% level according to a bootstrap resampling of the anomalies computed over 1961–2001 (see details in the supplementary material). Global temperature anomaly is indicated below the maps for each model configuration/observation. Missing data in the observed data set appear in grey. All the data has been interpolated on the HadCRUT4 grid (5° × 5°).
Download figure:
Standard image High-resolution image3. Near-surface temperature response to volcanic eruptions
Figure 1 shows the mean near-surface temperature anomalies observed and simulated following the Agung, El Chichón and Pinatubo eruptions individually. As a first step, we have computed the anomalies on average over three years (computed from the month of January that follows the eruption) to highlight the main features of the climate variability during the period when the imprint of the volcanic forcing is active, without considering potential seasonal modulations. The sensitivity experiments described in table 1 are used to compare the internal and the volcanically-forced variations of the climate after the volcanic eruptions. In figure 1, the model anomalies correspond to 5 member means for each of the forecasts initialised in the year of the eruption (after the eruptions). A polynomial detrending is applied to the anomalies to investigate the inter-annual climate variability approximately removing the long-term externally forced trends over 1961–2001 (see supplementary materials). In figure 1, the global temperature change is indicated for each model configuration/volcanic eruption, and significant anomalies are highlighted in dotted areas (methods detailed in the supplementary materials). The 3 year global-averaged temperature for the forecasts initialised each year is shown for the different model configurations, with and without detrending, in figure S1.
HadCRUT4 surface temperature observations (Morice et al 2012) show a general cooling after the Pinatubo and El Chichón eruptions (figures 1(j)–(k)), with significant values lower than −0.25 °C over the Western Pacific, the Indian and the Atlantic Oceans and over large areas of Americas and Eurasia. Due to its geographical location, the Agung eruption is known to have impacted mainly the Southern hemisphere (Sato et al 1993, Fujiwara et al 2015), explaining the lack of cooling in many areas of the Northern hemisphere in the case of this eruption (figure 1(l)). The grey areas of figures 1(j)–(l)) show that missing observations strongly limit the possibility to estimate the climate response to volcanic eruptions at middle to high latitudes, in particular in the Southern hemisphere. However, the observations available at Northern high latitudes suggest a heterogeneous spatial response, which varies in the three volcanic eruptions. A noteworthy exception to the general cooling is the significant warming that occurs in the eastern to central tropical Pacific, a signal varying between 0 and 1 °C that is associated to a predominance of El Niño conditions observed with different timing and magnitudes following these eruptions (Swingedouw et al 2017). The 3 year average global cooling in the HadCRUT4 dataset reaches −0.09, −0.01 and −0.05 °C respectively after the Pinatubo, El Chichón and Agung eruptions. This reduced cooling suggests a modulation of the volcanic imprint by climate internal variability.
The initialised forecasts that include the volcanic forcing (Volc-Init) reproduce also a global cooling, reaching −0.08, −0.13 and −0.04 °C respectively for the Pinatubo, El Chichón and Agung eruptions. These values corresponds to ensemble means, and the spread between the members reaches ∼0.1 °C (not shown), suggesting that the internal variability can partly overwhelm the volcanic signal. The forecasts Volc-Init (figures 1(g)–(i)) reproduce the significant cooling observed in Western Pacific, a feature more or less pronounced in the observations depending on the volcanic eruption (figures 1(j)–(l)). In the Eastern Pacific, the forecasts simulate a lack of cooling, even a slight warming where the observations show a significant warming. Overall, Volc-Init shows a heterogeneous pattern of surface temperature anomalies that is not systematically in phase with the observations. The forecasts Volc-Init allow to estimate the temperature changes after volcanic eruptions where the HadCRUT4 observation is not available. In particular in the Southern Hemisphere, a significant cooling occurs after the three eruptions at middle latitudes (∼50°S) whereas positive temperature anomalies are modelled over Eastern Antarctica.
Excluding the volcanic forcing from the forecasts cancels a part of the cooling that occurs after the volcanic eruptions (figures 1(d)–(f), NoVolc-Init). The 3 year global mean temperature anomalies take positive values with this model configuration, reaching 0.1, 0.01 and 0.09 °C respectively after the Pinatubo, El Chichón and Agung eruptions. Even without volcanic forcing in these forecasts, a part of the volcanic imprint is present in these experiments, since they have been initialised from an observational state itself affected by the volcanic forcing. They have been initialised in November the year after the volcanic eruptions, i.e. 5 months after the Pinatubo eruption and 8 months after the El Chichón and the Agung eruptions. However, the similarities between the forecasts NoVolc-Init and Volc-Init suggest that internal variability predominates volcanic signals at the regional scale.
The Volc-NoInit simulations lead to a significant global cooling reaching −0.17, −0.04 and −0.07 °C respectively after the Pinatubo, El Chichón and Agung eruptions (figures 1(a)–(c)). The initialised forecasts Volc-Init provide an estimate of the sum of the volcanic signals and the climate internal variability at the time of the eruption, while Volc-NoInit reflect the volcanic signal, due to the averaging of the unforced variability. In EC-Earth, the main characteristic of this signal is a cooling in the Western Pacific, and a lack of cooling in the Eastern Pacific. The spatially heterogeneous response of the surface temperature in figures 1(a)–(c) suggest that (i) the volcanic signals differ between the volcanic eruptions at the regional scale; (ii) with 5 member, the ensemble experiments are too small to detect clearly the regional patterns of the volcanic imprint. Larger ensemble forecast would be required to detect in particular the dynamical responses of the atmosphere to the volcanic forcing.
Considering the regional temperature anomalies, the IdealVolc2-Init and SwitchVolc-Init strategies seem to be appropriate to predict the climate response following volcanic eruptions (figures 1(m)–(o) and (p)–(r) to be compared to the reference Volc-Init in figures 1(g)–(l) and to the observations in figures 1(j)–(l)). The added value of these protocols compared to the forecast excluding the volcanic forcing is not obvious considering figure 1. A strict evaluation of the forecasts skill for the different model configuration is described in section 4.

Figure 2. Averaged SST anomaly from 5S–5 N and 170–120 W (Niño3.4 region) with respect to a climatology computed over 1961–2001, used as an ENSO index in HadSST3 observations (black curve, Kennedy et al 2011a, 2011b) and in EC-Earth simulations (colored curves). (a), (b) and (c) correspond to forecasts initialised in November the year before the volcanic eruptions, whereas (d), (e) and (f) correspond to forecasts initialised in November, 8 months after the Agung and the El Chichón eruptions, and 5 months after the Pinatubo eruption. The grey spread show the 5%–95% range of the 5 member forecast Volc-Init. Vertical dotted lines mark the timing of the eruption. SD stands for 'start date' and indicates the year when the forecast is initialised from observational estimate. The month 0 in the x-axis correspond to November, the year of the initialisation.
Download figure:
Standard image High-resolution imageAnother interesting feature is the lack of cooling, and sometimes a warming, modelled and observed in the Eastern Pacific after the volcanic eruptions. Millennium observations show an increase of the likelihood of El Niño events the first year following a volcanic eruption, a result consistent with several modelling studies (e.g. Maher et al 2015, Pausata et al 2015a, Khodri et al 2017). Such a dynamical response has a small signal to noise ratio, requiring a large ensemble of simulations to be detected, furthermore it is not reproduced systematically by climate models (Swingedouw et al 2017). The HadCRUT4 observations show a significant warming in the Niño 3.4 region during three years after the volcanic eruptions (figures 1(j)–(l)). Our predictions including the volcanic forcing, regardless of whether they are initialised from observations or not, show a lack of cooling, or a slight warming in the Niño3.4 region (figures 1(a)–(c)) and (g)–(i))), but less pronounced than in the observations. This suggests that either the volcanic forcing does not have a pronounced effect on ENSO in the simulations or that the signal is too small to be detected. Note that ENSO signals are not significant even when merging several experiments covering the volcanic eruptions to form a larger sample (for example by merging several 5 member forecasts initialised at different years and covering the three year after volcanic eruptions to get samples of 15 members; not shown).
Figure 2 shows predictions of the sea surface temperature (SST) in the Niño3.4 region (5 S–5 N and 170–120 W) in simulations initialised in November the year before the eruption (figures 2(a)–(c))) and after the eruptions (figures 2(d)–(f))). The black curves show the El Niño conditions that were observed during one to three years after the last volcanic eruptions. There is no El Niño signal in the Volc-Noinit experiment (green curves) after the volcanic eruptions, except in the simulations starting before the El Chichón eruption (figure 2(b)). Again, this suggests that in EC-Earth2.3 the volcanic forcing may not have an impact on ENSO or it may not be detected due to the low signal-to-noise ratio.
In accordance with the observations, El Niño conditions are simulated during one to two years in the experiment initialised before the Agung eruption, even when excluding the volcanic forcing (figure 2(a)). The experiment initialised before the El Chichón eruption also predict El Niño conditions, but with a smaller intensity than in the observations. This suggests that El Niño events were developing before the beginning of these volcanic eruptions. The forecast initialised in November 1990 predict neutral conditions over the months 1–10 (1990–1991), a signal also found in the observations. However, the El Niño conditions that are triggered 5 months after the Pinatubo eruption (end of 1991 and 1992) in the observations are not reproduced by the forecasts. The forecasts initialised after the eruptions show El Niño conditions during the first year (figures 2(d)–(f))).
The ENSO variations in the forecasts are probably due to the initialisation which affects the simulation during the first year following the eruptions. This effect is larger than the volcanic imprint since all the initialised experiments show similar ENSO conditions, regardless of the stratospheric aerosol load used (Volc-Init, NoVolc-Init and both IdealVolc forecasts). This statement is supported by the fact that the ensemble spread of the Volc-Init forecast overlaps the ensemble mean of the other initialized experiments. It is therefore probable that strong El Niño events would have occurred even without volcanic eruptions. This is confirmed by the ECMWF seasonal predictions of SST initialised one month before the El Chichón and the Pinatubo eruptions that predict strong El Niño conditions with an amplitude similar to the observed one, despite the absence of volcanic aerosol loadings (figure S2).
In the extra-tropics, the model simulates a post-volcanic warming, or a lack of cooling, in large areas of the Eurasian continent that shows different spatial pattern among the eruptions (figures 1(a)–(c)) and (g)–(i))). This may suggest NAO imprints. On average, the EC-Earth 2.3 forecasts do not simulate any significant NAO signal the first and the second winter after these eruptions, but show a statistically significant positive NAO signal the third winter after the three eruptions (not shown, and documented in Swingedouw et al 2017, their figure 10). This signal has to be considered cautiously because it is based on small ensemble experiments (5 members), a limitation that explains why we do not focus this study on the NAO. Nevertheless, this signal is consistent with (Ménégoz et al 2017), who simulated a positive NAO signal induced by ocean and sea-ice feedbacks the third winter after a Pinatubo-like eruption, using large ensemble experiments (36 members). Positive NAO anomalies were observed during the two winters following the Pinatubo and the El Chichón eruptions whereas the Agung eruption was followed by negative NAO conditions. Even if the volcanic forcing may have played a role, such NAO conditions have been probably largely driven by internal variability since the ratio of the volcanic signal compared to the noise of the NAO is weak (Bittner et al 2016b, Ménégoz et al 2017). This finding is supported by Marshall et al (2009), who demonstrated that the positive winter NAO conditions observed after these eruptions could be predicted even without considering any volcanic forcing in their forecast system. One caveat here is that models may underestimate the forced response in the NAO (Scaife et al 2014, Eade et al 2014) and if this applies to volcanic forcing it could mean that models overemphasize the effects of internal unpredictable variability.

Figure 3. Skill of EC-Earth simulations (5 member mean) over the first five forecast years estimated from a comparison with HadCRUT4 observations: Correlation (a and b) and RMSE (c) of 12 months running mean anomalies of the global near-surface temperature; (d) Correlation of the SST in the Niño 3.4 region. In (a), (b) and (d), when higher than the horizontal lines, the correlations are significant at 95% according to a one-sided t-test. In (b) and only in (b) the correlations are computed after a first-order polynomial detrending of the anomalies. The correlation difference between the hindcast including the volcanic forcing and the other experiments is significant at 95% when an inverted triangle is superimposed to the curve. As recommended in (Siegert et al 2017), the correlation between the different experiments is taken into account to compute the statistical significance of the skill differences correctly. These differences are never significant in (a). The global mean of temperature in the simulations is an average excluding the model data where and when the HadCRUT4 observation lacks data.
Download figure:
Standard image High-resolution image4. Skill related to volcanic forcing
To test a forecast system at the seasonal and/or decadal timescales, an ensemble of several tens of predictions is commonly required to ensure enough confidence in the evaluation of the skill (Siegert et al 2017). Hence, it is statistically not possible to test a forecast system by considering only the three predictions initialised the years of the last three major eruptions. Nevertheless, considering that forecast systems applied in retrospective hindcasts include the volcanic forcing, a part of the skill computed over the last decades is necessarily related to this volcanic forcing (Timmreck et al 2016). Here, the prediction skill related to the initialization and volcanic forcing is evaluated and investigated using the set of experiments over the period 1961–2001.
A sample of hindcasts with 41 start dates from 1961–2001 is used to compute the anomaly correlation coefficient (ACC) and the root mean square error (RMSE) for the global near-surface temperature anomalies between the HadCRUT4 observations and Volc-Init (see supplementary materials), applying a 12 month running mean to the anomalies (figures 3(a)–(c)), red curve). The global mean temperature is calculated as the area-weighted average excluding the model data where and when the HadCRUT4 observation includes missing values (figures 1(j)–(l), grey spaces). Then, the same evaluation is applied to an historical simulation that has not been initialised from observations (figures 3(a)–(c)), green curve). To evaluate the skill of the forecasts excluding the volcanic forcing or including idealized forcings over 1961–1991, the sample of start dates of Volc-Init is also considered over the same period, but the start dates affected by the eruptions, i.e. the four hindcasts centred on each of the eruptions are replaced by the different sensitivities experiments (NoVolc-Init, IdealVolc1-Init, IdealVolc2-Init, respectively the blue, yellow and purple curves in figures 3(a)–(c))). This protocol has been used to construct full samples of predictions without the need to run all the experiments over the whole period 1961–2001. In other words, it was not necessary to run NoVolc-Init, IdealVolc1-Init and IdealVolc2-Init over the whole period 1961–2001, since they would have been similar to Volc-Init out of periods of large volcanic eruptions, with a level of stratospheric aerosols varying around a background level much smaller than those observed after large volcanic eruptions. The periods covered by the different sensitivity experiments can be considered viewing table 1 and figure S1.
The ACC of the different forecasts ranges between 0.95 and 0.75 and is statistically significant for 5 years at least (figure 3(a)). The ACC difference between the experiments is never significant in figure 3(a), indicating that the comparisons presented below need to be considered carefully. The forecast Volc-Init performs better the first two years, both in terms of ACC and RMSE (figures 3(a) and (c). The initialized forecasts have higher skill (higher ACC and lower RMSE) during the first two years in comparison to the Volc-NoInit experiment. However Volc-NoInit has higher skill than the rest of the forecasts thereafter. This suggests that the skill beyond the first two forecast years is mainly related to the external forcings (mainly anthropogenic), and that the historical simulation reproduces better the climate variability related to these forcings beyond the first two years. Following (Pohlmann et al 2017), we hypothesize here that the drift generated by the initialisation of the model with observational data, that corresponds to a state that is not consistent with the model equilibrium, can affect the physical realism of the initialised forecast. This assumption is hypothetical since the skill difference between the experiments is not significant.
The difference of skill between the experiments NoVolc-Init, IdealVolc1-Init and IdealVolc2-Init is almost indistinguishable in terms of global mean temperature, and it is systematically lower than the skill of the forecast that includes an estimate of the observed volcanic forcing (Volc-Init, figure 3(a)). This highlights that a part of the skill is related to the volcanic forcing in Volc-Init. Since the skill is dominated by the near monotonic increase in global mean temperature driven by anthropogenic forcings (Doblas-Reyes et al 2013), to approximately isolate the temperature variations due to internal variability and the volcanic forcing, we detrended the global mean temperature anomalies (see supplementary material). Removing the trends, the skill of the forecasts drop below the level of significance the third year after the initialisation, suggesting that the skill beyond 3 years is essentially due to the anthropogenic-driven trend (figure 3(b)). In addition, the differences between the experiments become statistically significant (figure 3(b)), with the following ranking: Volc-Init, IdealVolc2-Init and IdealVolc1-Init equally ranked, NoVolc-Init and Volc-NoInit. This result is consistent with (Timmreck et al 2016) who detected statistically significant differences in the skill related to the volcanic forcing only when removing the trend, a way to emphasize the forecast skill in terms of inter-annual variability. The idealized experiments (Volc-Init, IdealVolc2-Init and IdealVolc1-Init) perform significantly better than a forecast neglecting the volcanic forcing, at least for the initial two years (figure 3(b)).

Figure 4. Contribution to the ACC for the first forecast year (Year 1, top), the average of the three first forecast years (Years 1–3, middle) and the average of the third, fourth and fifth forecast years (Years 3–5, bottom): from the initialisation (a, d and g), from the volcanic forcing based on observations, and from the idealized volcanic forcing based on a 2 year exponential decay (g, h and i). The correlation increase is significant in the dotted areas. The grey areas correspond to regions where the observational data is missing for more than 25% of the total number of years.
Download figure:
Standard image High-resolution image
In contrast with the results for global mean temperature, the ENSO skill does not differ between the experiments that either include or not the volcanic forcing (figure 3(d)). The ENSO skill is significant in our forecast during around 18 months, with values decreasing from values close to 1–0.3, and it is driven mainly by the initialisation. The spatio-temporal characteristics of the stratospheric aerosol load does not affect our predictions of ENSO and confirms that the ENSO response to volcanic forcing in our model has a low signal to noise ratio if it is simulated, and would require a larger ensemble to be detected.
The skill of decadal forecast systems is generally higher over the ocean than over the continents, and higher in the tropics than in the high latitudes (Smith et al 2007, Meehl et al 2013), a feature also found for the EC-Earth forecast system (figure S3). The skill of forecast systems decreases with the forecast time, but it is statistically significant for forecast years 2–5 and even 6–9 at the regional scale, in particular over the tropical Atlantic, the Indian Ocean and the Western Pacific (Doblas-Reyes et al 2013).
Figure 4 shows the regional forecast skill due to the initialisation and the volcanic forcing. It is evaluated as the differences in ACC between the different forecast experiments where the contribution from the initialisation is estimated by the difference Volc-Init–Volc-NoInit, the contribution from the volcanic forcing based on observations is estimated by the difference Volc-Init–NoVolc-Init, and the contribution from the idealized volcanic forcing by the difference IdealVolc2-Init–Novolc-Init.
In the first year of forecasts, the initialisation is responsible for a significant part of the skill, in particular in large areas of the Pacific, the tropical Atlantic and the Indian Ocean, but also in some areas of Northern America, Southern America and Africa, where its contribution to the ACC ranges between 0.5 and 1 (figure 4(a)). The contribution of the initialisation is still significant over the forecast years 1–3 in the Pacific and the Atlantic, but it is almost negligible over the forecast years 3–5 (figures 4(d)–(h)). The contribution of the volcanic forcing is statistically significant in the Western Pacific for all the forecast years, with values varying around 0.5 in this area (figures 4(b)–(h))). Interestingly, it increases with the forecast time, contributing to the forecast skill with equivalent magnitude as the initialisation over the forecast years 1–3 and even greater over the forecast years 3–5. This contribution is small over the continents, but it is significant with a contribution to the ACC that reaches 0.5 in Western Pacific, Indian Ocean and Southern Atlantic (figure 4(h)). This finding is consistent with (Guemas et al 2013) who show high skill related to volcanic aerosols over the Indian Ocean. Regardless of the initialisation and the volcanic forcing, there is also a statistically significant decrease in skill in some areas. These features, however, are mainly over the Pacific Ocean and its surrounding continents (figures 4(g) and (h)) where observations are sparse, strongly limiting the evaluation of the forecast skill (Massonnet et al 2016). The ACC contribution of the idealized volcanic forcing (IdealVolc2-Init) shows a similar pattern as for the observed volcanic forcing, which is smaller but statistically significant over the Western Pacific and over some areas of the Southern Ocean high latitudes (figures 1((s)–(l)) figures 4(c)–(i))). We emphasized previously that using this idealized forcing (IdealVolc2-Init) improves the skill to predict the global mean temperature several months in advance compared to a forecast that excludes the volcanic forcing. At the regional scale, it also improves the skill during the first year of forecast, but also during several years in some areas.
5. Summary
We have investigated the climate response to volcanic eruptions in sensitivity experiments conducted with the EC-Earth model version 2.3 over the second half of the 20th century, a period when three major eruptions occurred (Agung 1963, El Chichón 1982 and Pinatubo 1991). Our findings can be summarized in five main points:
- 1.EC-Earth hindcasts initialised from observations and forced with an estimate of the observed volcanic aerosols reproduce a global cooling after the last three major volcanic eruptions that reaches a similar magnitude than the observed one. They reproduce also a regional cooling commonly observed for these eruptions in Western Pacific. The 3 year mean temperature anomaly observed elsewhere, taking heterogeneously positive and negative anomalies at the regional scale, is partially reproduced by EC-Earth. The internal variability is the main driver of the surface temperature variability at the regional scale, dominating the volcanic signal after the Agung, El Chichón and Pinatubo eruptions.
- 2.EC-Earth model simulates a lack of cooling—or a slight warming—in the Niño3.4 region during three years after volcanic eruptions, but without a clear ENSO signal induced by the volcanic forcing, indicating that such a signal, shown in millennial observations for large volcanic eruptions, either does not occur in our model or would require a larger ensemble (> 15 members) to be detected. The ENSO skill over the period 1961–2001 is significant during the initial 18 months of EC-Earth forecasts, mainly because of the initialisation, and does not depend on the volcanic forcing applied in the forecast. In terms of NAO and ENSO, the skill of forecast systems relies more on their ability to reproduce the climate internal variability than on their capacity to simulate the volcanic signal, even after a volcanic eruption.
- 3.In terms of global mean near-surface temperature, EC-Earth hindcasts show high skill the first two forecast years for the period 1961–2001. After two years the skill is smaller than in a historical simulation, since the benefits from the initialisation decrease with the forecast time, the skill becomes dominated by the external forcings. The hindcast that includes an estimate of the observed volcanic forcing has higher skill than the forecast excluding the forcing of large volcanic eruptions. The difference of skill between these two hindcasts is significant only when detrending the experiments to remove the near monotonic increase of temperature over the last decades. The forecasts based on an idealized forcing shows similar skill to predict the global temperature in comparison to those based on the observed volcanic forcing during the first two years. From the third year of forecast, its skill is similar to those of the forecast excluding the volcanic forcing.
- 4.At the regional scale, a part of the forecast skill is related to the volcanic forcing, in particular over large areas of the Western Pacific, the Western Atlantic and the Indian Ocean. The contribution to the forecast skill from the volcanic forcing becomes higher than those of the initialisation after two to three years of forecast.
- 5.Simulating the volcanic aerosol by a two-year exponential decay of the observed initial state of the stratospheric aerosol load in a real-time forecast noticeably improves its skill to predict the global near-surface temperature during one to two years. This improvement compared to a forecast excluding the volcanic forcing is statistically significant only when removing the trend related to the global warming. This idealized forcing contributes to increase the skill at the regional scale, in particular in the Western Pacific. Such idealized forcing, or the use of the forcing of a past eruption can be considered to forecast the climate response to a new eruption.
Further research using larger ensemble experiments (∼40 members) is needed to investigate and improve the prediction of the climatic response to volcanic eruptions, and in particular the dynamical response. Forecasts covering longer periods and initialised during different seasons would also allow to better assess the prediction of the climate variability related to stratospheric aerosols, during periods with large volcanic eruptions and without. Addressing the question of how to forecast a future volcanic eruption is of major interest in the climate forecasting community, given that we do not know the spatio-temporal characteristics of the stratospheric aerosol forcing in the future, and after the next eruption, we will have to wait for several months for an estimate of the observed forcing that could be used in a climate prediction. Following (Toohey et al 2016) that recently set up a way to generate idealized volcanic forcings for climate models, new protocols should be developed and tested to describe realistically the forcing of stratospheric aerosols in real-time climate forecasts.
Acknowledgments
The research leading to these results has received funding from the Ministerio de Economía y Competitividad (MINECO) as part of the VOLCADEC (ref. CGL2015–70177-R) and HIATUS (ref. CGL2015–70353-R) projects, as well as the program SPECS funded by the European Commission's Seventh Framework Research Programme under the grant agreement 308378. We thank the Met Office for providing the HadCRTU4 observational dataset. All the analysis and figures have been produced with the s2dverification R package (https://cran.r-project.org/web/packages/s2dverification/index.html) and the simulations have been launched with the Autosubmit workflow manager (http://autosubmit.readthedocs.io/en/latest/).