

Abstract
Demand for mangrove forest resources has led to a steady decline in mangrove area over the past century. Land conversions in the form of agriculture, aquaculture and urbanization account for much of the deforestation of mangrove wetlands. However, natural processes at the transition zone between land and ocean can also rapidly change mangrove spread. In this study, we applied a robust field-based carbon inventory and new structural and temporal remote sensing techniques to quantify the magnitude and change of mangrove carbon stocks in major deltas across Africa and Asia. From 2000–2016, approximately 1.6% (12 270 ha) of the total mangrove area within these deltas disappeared, primarily through erosion and conversion to agriculture. However, the rapid expansion of mangroves in some regions during this same period resulted in new forests that were taller and more carbon-dense than the deforested areas. Because of the rapid vertical growth rates and horizontal expansion, new mangrove forests were able to offset the total carbon losses of 5 332 843 Mg C by 44%. Each hectare of new mangrove forest accounted for ∼84% to ∼160% of the aboveground carbon for each hectare of mangrove forest lost, regardless of the net change in mangrove area. Our study highlights the significance of the natural dynamics of erosion and sedimentation on carbon loss and sequestration potential for mangroves over time. Areas of naturally regenerating mangroves will have a much larger carbon sequestration potential if the rate of mangrove deforestation of taller forests is curbed.
Export citation and abstract BibTeX RIS

Original content from this work may be used under the terms of the Creative Commons Attribution 3.0 licence. Any further distribution of this work must maintain attribution to the author(s) and the title of the work, journal citation and DOI.
1. Introduction
Forest growth and reforestation rates are crucial information for sustainable forest management practices and informed decision-making for restoration projects (Diaz-Balteiro and Romero 2008). There have been an increasing number of mangrove forest restoration projects because of the ecosystem's unique ability to sequester large amounts of carbon. Globally, it has the potential to stock over 1000 Mg ha−1 of carbon (Donato et al 2011), a figure almost unmatched by other ecosystems (Pendleton et al 2012). Although mangrove forests account for only 2%–3% of the global forested surface (Giri et al 2011), they provide many ecosystem benefits that have attained values in the billions of U.S. dollars (Jerath et al 2016). Unfortunately, information about the decline and expansion of mangrove areas is extremely limited, and this is combined with uncertainty and biases in estimating total ecosystem carbon stocks. Mangrove deforestation has recently been estimated at between 0.16%–0.39% per year at regional and global scales. However, the underlying datasets used capture neither the dynamic changes caused by natural processes and human disturbances, nor the local scale variability in canopy structure and vegetation biomass (Richards and Friess 2015, Hamilton and Casey 2016, Hamilton and Friess 2018) for accurate accounting of carbon and payments for ecosystem services (PES). Most recently, the dynamics of mangrove gains and losses have been captured using globally available radar imagery (Thomas et al 2017), but this still does not provide the fine-scale spatial and structural details needed for the valuing of different mangrove forest types for local management and restoration efforts (Ewel et al 1998).
The major cause of mangrove decline has been deforestation through conversion to aquaculture and agriculture (Richards and Friess 2015, Thomas et al 2017). However, natural erosional and depositional processes such as aggradation, transgression, and regression play a pivotal, and largely unreported, role in changing the extent of mangrove ecosystems (Fromard et al 2004, Thomas et al 2017). The global forest change dataset has been an extremely useful tool for determining the changes for terrestrial forests (Hansen et al 2013), particularly when measuring large drivers of change, but it can be fundamentally flawed when used for inundated forests, such as mangroves. The global forest change datasets screen the remote sensing imagery based on 'cloud/shadow/water pixels' (Hansen et al 2013). Therefore, it identifies only those forested regions that do not exhibit flooding, or where the forest canopy is sufficiently dense enough to obscure underlying water. Because of the screening process, the global forest change dataset does not perform well in many wetland forests (i.e. mangroves), and communities looking to develop PES should be aware of this when using these global data to estimate gross and net mangrove deforestation, and the subsequent upscaling of global carbon stock data or latitude- or climate-based models (Richards and Friess 2015, Hamilton and Casey 2016, Hamilton and Friess 2018).
The potential stock and flux of total ecosystem carbon has been difficult to measure because of the variety of mangrove stock estimates collected in varying environmental settings. One particular drawback, which has been acknowledged in aggregating field measurements for neotropical mangrove biomass estimates to the existing mangrove field datasets, is the often biased selection of sites, due to logistical constraints (Rovai et al 2016). In some areas, mangrove carbon density can reach mean values in excess of 1000 Mg C ha−1 (Donato et al 2011, Pendleton et al 2012). However, many of these sites are selected based on ease of access, location, or other preferential factors. Although mangrove carbon can be extremely high in certain geographic settings, this is not the case everywhere, as has been shown by case studies in Mozambique and West Africa (Stringer et al 2015, Kauffman and Bhomia 2017). Extrapolating high local carbon values can skew regional and global estimates. If PES is to facilitate mangrove restoration and deter land cover changes as a climate change mitigation strategy or other carbon inventory protocol (Siikamäki et al 2012, Alongi 2015), unbiased field inventories must be prepared and local scale height variability must be measured.
Mangrove canopy height is a strong predictor of biomass at the field scale (Mizanur Rahman et al 2014, Stringer et al 2015, Trettin et al 2016), and can be readily adapted to regional, continental, and global scales (Simard et al 2006, Fatoyinbo and Simard 2012, Shapiro et al 2015, Feliciano et al 2017). Remotely sensed canopy height has been incorporated into mangrove field inventories in East and West Africa (Stringer et al 2015, Shapiro et al 2015, Fatoyinbo and Simard 2012). Canopy height information provides an unbiased, readily accessible, and spatially explicit dataset (Fatoyinbo and Simard 2012) that has been used to stratify the forest inventory area into discrete height classes and, ultimately, carbon stocks. Canopy height measured from space has an error of ∼2 m (Lee and Fatoyinbo 2015, Lagomasino et al 2015, 2016b), but because of data access has not been used in recent global mangrove biomass calculations (Hutchison et al 2014, Rovai et al 2016). The height-based inventory approach has achieved the precision of a 95% confidence interval, equal to 6% of the mangrove carbon stock estimate and well within the REDD+ guidelines (Stringer et al 2015). Canopy height data provides local scale information that complements PES, but it can also contribute to information on regional and global changes to current and future mangrove forest resources.
The uncertainties in mangrove land cover change and changes in carbon stocks can be addressed using a combination of remote sensing and unbiased field inventory datasets. Here, we applied this approach to four major delta regions: the Rufiji (Tanzania), Zambezi (Mozambique), Ganges (Bangladesh), and Mekong (Vietnam). These river deltas present a range of human impact factors, ranging from heavily used in the Rufiji to completely protected (Ganges and Zambezi) and restored (Mekong) forests. Here, we present estimates of vertical growth and aboveground and total carbon stocks through a combination of vertical, spatial, and temporal changes in mangrove ecosystems. This approach provides a precise estimate of carbon loss and productivity in dynamic mangrove ecosystems.
2. Methods
2.1. Mangrove extent
The data used for this analysis consisted of a 30 m resolution Landsat 8 Operational Land Imager (OLI), Sentinel-1C, and Shuttle Radar Topography Mission (SRTM) elevation data. Landsat data were preprocessed, which included image resampling, conversion to top of atmosphere reflectance, cloud and shadow removal and quality assessment, and image normalization. Landsat 8 OLI bands were used as inputs for the classification, as well as the normalized band ratios of Normalized Difference Vegetation Index (NDVI), normalized water index, normalized burn ratio, and others outlined in Green et al (1997). Additionally, annual maximum 'VV' and 'VH' bands from Sentinel-1C and elevation data from SRTM were resampled to the Landsat projection and included in the classification. Data from Landsat provide information on vegetation function and the radar imagery provides information on forest structure. Areas where the SRTM elevation was over 50 m and areas where the annual maximum NDVI value were less than zero were masked out prior to analysis, to improve the classification. By doing this, areas where the elevation was too high and areas of permanent water bodies were removed, respectively. A K-means clustering algorithm was used to generate 60 land cover types using 10 000 random sample points within the area of analysis. The automatic detection of the land cover types was then merged into mangrove and non-mangrove classes using visual interpretation of the annual 2016 Landsat composite. The predominant band combination used for the visual interpretation was near infrared (1.55–1.75 μm for Landsat 5 thematic mapper (TM), 0.85–0.88 μm for OLI), shortwave infrared (SWIR) I (1.55–1.75 μm for TM, 1.57–1.65 μm for OLI), and SWIR II (2.08–2.35 μm for TM, 2.11–2.29 μm for OLI), loaded into the red-green-blue channels, as this combination allowed us to discriminate forested areas easily. Google Earth imagery was used extensively as an additional reference for the 2016 classification.
2.2. Mangrove land cover change
A NDVI anomaly was calculated for each study region, using the Landsat image archives. The reference period covered Landsat 5TM images from January 1995 to December 2000. Images were preprocessed, following similar criteria to the mangrove extent. An average reference NDVI was generated from the sum of individual pixels across all the images and divided by the total number of images used in the summation. The reference NDVI for the period 1995–2000 was then subtracted from each of the images in the observation period, which was from January 2000–December 2016. The anomaly value from each overlapping pixel was then summed across all the images in the collection to determine an overall cumulative anomaly. The cumulative anomaly values were also normalized for the total number of images with non-null values for individual pixels. Change thresholds on the anomalous NDVI values were considered to be those which fell outside the 5th and 95th percentiles over the study region. Values greater than the 95th percentile were considered areas of forested gain, while values less than the 5th percentile were characterized as forested areas that were lost. The percentiles were selected based on the manual fine-tuning of cumulative NDVI anomalies across all four study sites. We also applied conditional statements using the reference NDVI map and a mean NDVI for a two-year period from 2015–2016. For a pixel to be considered a loss, it had to have a NDVI anomaly value less than the 5th percentile, and occur within the 2000 extent map (Giri et al 2011), and have a mean reference NDVI value greater than 0.3. For a pixel to be considered a gain, it had to have a NDVI anomaly value greater than the 95th percentile, and occur within the 2016 mangrove extent as mapped for this study, and have a mean 2015–16 NDVI value equal to or greater than 0.35. The frequency distribution of the NDVI anomaly values can be seen in supplemental figure 1 (available online at stacks.iop.org/ERL/14/025002/mmedia).
2.3. Canopy height models
The TerraSAR-X add-on for Digital Elevation Measurements (TanDEM-X) mission, led by the German Space Agency (DLR), is a pair of similar Synthetic Aperture Radar (SAR) satellite instruments that enable single-pass interferometry to generate a consistent global digital elevation model (DEM) (Krieger et al 2007). The simultaneous acquisition of data from the two satellites that comprise the TDX mission greatly reduces temporal decorrelation, allowing for successful Pol-InSAR forest parameter estimation (Lee et al 2013). Single- and dual-pol spaceborne TDX data have been well-proven in estimating quantitative forest parameters over tropical, temperate, and boreal forest sites by means of the Random Volume over Ground (RVoG) model (Kugler et al 2014). The X-band wavelength may be expected to have less sensitivity for a vertical forest structure, but the single-pol TDX inversion can be applied to the forest height, if an external digital terrain model (DTM) is available for the site. To overcome these limitations, Lee and Fatoyinbo (Lee and Fatoyinbo 2015) suggested estimating the ground (water level) phase directly from the TDX interferogram, with the assumption that the underlying topography over mangroves is negligible and flat as a result of the unique environment in which mangroves grow, which is low-lying coastal areas. This assumption reduces one of the unknown variables in the RVoG model, resulting in a balanced inversion. The inversion approach has been successfully proven and has generated mangrove canopy height maps at 12 m spatial resolution over the Zambezi delta and parts of the Yucatan peninsula (Lee and Fatoyinbo 2015) and the Florida Everglades (Feliciano et al 2017), demonstrating the possibility to use TDX acquisitions to map mangrove height globally.
We used TDX-based canopy height models (CHMs) from the Zambezi delta (Lee and Fatoyinbo 2015, Lagomasino et al 2016a, Lagomasino et al 2016b), Rufiji delta (Lagomasino et al 2017) and the Ganges delta. In addition, a new canopy height model was generated over the Can Gio Reserve (Mekong delta) using the methodology previously mentioned. For more information on TDX CHM processing, see (Lee and Fatoyinbo 2015). We used the TDX CHMs to estimate the current mangrove canopy height, as the TDX images were collected between 2013 and 2014. We used SRTM elevation data to determine what the canopy height was in 2000 at each of the four sites. The gridded elevation data from SRTM was converted to canopy height using conversion models from Fatoyinbo and Simard (Fatoyinbo and Simard 2012).
The spatial resolution of the TDX CHMs are 12 m × 12 m while the SRTM spatial resolution is 3om × 30 m. There are also wavelength differences between the radar X-band of TDX and the C-band of SRTM. Both these canopy models were corrected to reflect the maximum canopy height and the TDX was reprojected to the SRTM resolution. This provided the means to make the two datasets directly comparable, to assess forest structure.
2.4. Mangrove biomass
We determined mangrove biomass using a canopy height stratification approach similar to that outlined by Shapiro et al (Shapiro et al 2015). For each of the study sites, the Zambezi, Rufiji, Ganges, and Mekong, we stratified both the contemporary TDX CHM (2014) and past SRTM CHM (2000) into similar height classes, as outlined in Stringer et al (Stringer et al 2015) and Shapiro et al (Shapiro et al 2015). Based on this height-based stratified sampling approach, the aboveground and total carbon stocks for each canopy height class were determined with a 95% confidence interval, equal to ±6% of the total. See supplemental table 3 for aboveground and total carbon values by canopy height class.
For this study, we remapped canopy height classes to reflect the aboveground biomass carbon (AGC), which accounted for overstory, understory, ground vegetation, downed woody debris, litter, and standing dead trees. Total Ecosystem Carbon (TEC), which accounted for AGC, belowground biomass, and soil carbon, was mapped in a similar approach. In order to estimate the losses and gains of both AGC and TEC, we overlaid the land cover change maps on the carbon stock maps. The 2000 canopy height and biomass maps were masked using the mangrove loss, while the 2014 canopy height map was masked using the 2016 mangrove gain mask. When remapping the canopy height classes to carbon density, in the areas where the canopy elevation was outside the canopy class criteria, we added a Class 0 and a Class 6 where these values mirror the carbon values of the closest class values, Class 1 and Class 5, respectively (see supplemental table 3).
For this approach we assumed that the carbon loss or gain, as estimated by the 16-year land cover change modeling, was based on the presence or absence of the mangrove forest on a pixel-by-pixel basis. For any gain in mangrove extent, it was assumed that the entire vertical column, of soil (2 m depth), belowground, and aboveground carbon, was accumulated. Conversely, for any loss, the entire vertical column of carbon was lost.
2.5. Comparison with global forest change map
We compared the mangrove forest change measured using the NDVI anomaly against the Global Forest Change (GFC) maps from 2000–2016 v1.5 (Hansen et al 2013). Mapped forest changes in the GFC were masked to include only the mangrove extent in 2000 (Giri et al 2011) or the 2016 extent map (this study). The number of pixels of either mangrove gain or loss was calculated for each change map dataset. Overlapping pixels between the two mangrove change models were given a value of 2 while all non-overlapping values were given a value of 1.
3. Results
Between 2000–2016 there was a total loss of 12 270 ha of mangrove forests among the four sites, representing 1.6% of the total mangrove area determined in 2000 by Giri et al (2011) (table 1). The decline in mangrove extent was offset by a gain of 5444 ha of new forest, resulting in a net loss of 6826 ha, or 0.9% of the original mangrove area. The Ganges had the largest net loss, of ∼6594 ha, followed by the Mekong with 1747 ha lost. All four sites exhibited a net loss of mangrove area (table 1). Mangrove loss primarily occurred along the landward boundary of the mangrove forests where freshwater input was high, along eroding creek banks, or at the ocean margin where wave energy was high (figures 1(A)–(D)). Mangrove gains generally occurred along prograding point bars as well as on emerging mudflats (figures 1(C) & (D)). In some regions, mangrove forests expanded over a 1 km distance during the 16-year study period (figure 1(C)).
Table 1. Total changes (gain, loss, and net) in mangrove extent, total aboveground biomass carbon (AGC) and total ecosystem carbon (TEC) for each of the four delta sites.
| Land Area (ha) | |||
|---|---|---|---|
| Gain | Loss | Net | |
| Rufiji | 587.6 | 1436.9 | −849.3 |
| Zambezi | 1280.7 | 2491.4 | −1210.7 |
| Ganges | 2343.7 | 6594.2 | −4250.5 |
| Mekong | 1231.7 | 1747.3 | −515.5 |
| TOTAL | 5443.7 | 12 269.8 | −6826.1 |
| Total AGC (Mg) | |||
| Gain | Loss | Net | |
| Rufiji | 99 532 | 261 664 | −162 132 |
| Zambezi | 175 360 | 279 951 | −104 590 |
| Ganges | 219 671 | 735 275 | −515 603 |
| Mekong | 164 936 | 145 033 | 19 903 |
| TOTAL | 659 501 | 1 421 924 | −762 423 |
| Total TEC (Mg) | |||
| Gain | Loss | Net | |
| Rufiji | 293 416 | 749 874 | −456 457 |
| Zambezi | 588 922 | 1 074 424 | −485 502 |
| Ganges | 943 570 | 2 834 829 | −1 891 258 |
| Mekong | 560 774 | 673 714 | −112 940 |
| TOTAL | 2 386 684 | 5 332 843 | −2 946 159 |
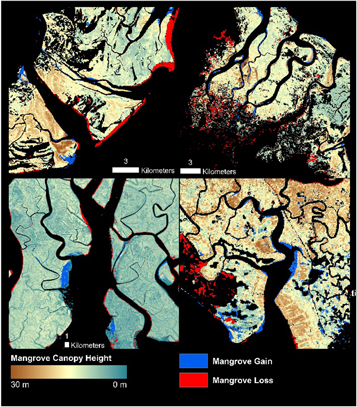
Figure 1. Examples of areas showing mangrove canopy height and area losses and gains between 2000–2016. (A) A portion of the Zambezi delta showing natural mangrove loss and gain. (B) A region of the Rufiji delta showing mangrove losses from illegal logging and mangrove gains along prograding mud banks and point bars. (C) An area of the Ganges delta in Bangladesh where loss primarily occurs as thin strips along the distributaries, while other areas show substantial gains over 1 km wide. (D) Southern region of the Can Gio Biosphere Reserve located on the eastern edge of the Mekong delta.
Download figure:
Standard image High-resolution imageThe areas of mangrove loss and gain provide important information to understand the dynamic changes of these ecosystems. By combining our estimates of canopy growth and loss, we were able to measure the change in the three-dimensional (3D) structure of the mangrove forest. Across all four study sites, the canopy heights of newly established forests (i.e. forests established between 2000–2016) were on average taller than the forests that were removed or eroded in the same period (supplemental table 1). The expansion of mangrove forests at the Mekong site resulted in a mean canopy height that was taller than what was lost (supplemental table 1). The mean canopy heights lost and gained at the Rufiji and Zambezi deltas were nearly equal, but of varying heights. The Rufiji lost a mean canopy of 13.4 m but gained a canopy of 12.1 m. For the Zambezi, there was a loss of 8.0 m and a gain of 8.9 m. Conversely, the Mekong site had newly established forests that were taller than the areas that were lost, at 8.5 m to 4.9 m, respectively. Moreover, the growth of newly established mangroves had much higher variability (standard deviations ranging from 3.6 to 8.3 m) than the forested areas that were lost (standard deviations ranging from 2.0–4.3 m) (supplemental table 1).
Combining both the change in mangrove extent and the change in the height of the mangrove canopies, we were able to estimate the gains and losses of both aboveground biomass carbon (AGC) and total ecosystem carbon (TEC) during 2000–16 using carbon values calculated in Stringer et al (Stringer et al 2015) (table 1). The Ganges site had the largest net area deficit (−6594.2 ha) which corresponded to the largest net total AGC loss of 515 603 Mg and TEC loss of 1 891 258 Mg. Mangrove loss was over four times higher at the Ganges site than at the Rufiji, but taller forests were removed in the Rufiji delta, resulting in a disproportionate loss of AGC based on area alone. The Mekong site showed a net gain of 19 903 Mg of AGC but still had a net loss of 112 940 Mg of TEC from the mangrove forest, a result of the combination of a net loss of area and the replacement of taller mangrove forests (table 1, figure 2).
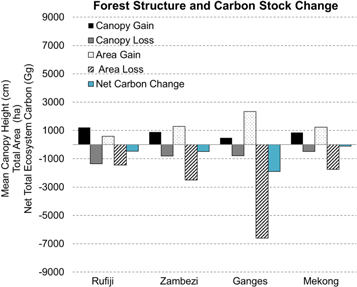
Figure 2. Structural variability of delta mangrove forests as it changed over time, from 2000–2016. Black and dark gray bars indicate the mean canopy height for gained and lost forests, respectively. White and light gray bars represent the total area of mangroves gained or lost, respectively. The blue bar represents the net total ecosystem change between 2000–2016. Changes in total net ecosystem carbon stocks are a function of both the net change in mangrove area and the forest structure of the areas that were changed.
Download figure:
Standard image High-resolution imageOur gain and loss estimates are at least one order of magnitude greater than the change detected by the GFC v.5 maps and others (Hansen et al 2013, Richards and Friess 2015, Hamilton and Casey 2016). Here, we measured the largest mangrove forest loss as being in the Ganges delta, with a total loss of 6594.2 ha, while the GFC detected a loss of only 68.1 ha. The GFC forest loss is thus only 1.0% of the actual mangrove forest loss for the Ganges (supplemental table 2). For the other delta sites, the GFC loss maps capture only 3.4%–21.8%, missing a total of 4593 ha (11 109 ha with the Ganges loss included) as measured in this study. The differences between the GFC and the results from this study were highlighted more dramatically when comparing the areas of mangrove forest gain. The maximum area overlap between the GFC gain map and our new gained area was only 0.7%. This limited overlap between the two maps results in an area of over 5430 ha that was not accounted for in the GFC.
4. Discussion
From the results presented here, the mangrove forests in these four delta regions are highly dynamic and regenerate rapidly in both the horizontal and vertical directions. The vertical growth rate estimates presented here for mangrove forests overlap with other fast-growing tropical trees (0.3–2.5 m per year (Clark and Clark 2001)). For replanted mangrove plantations in Kenya, growth rates reached an average of 0.9 m per year for mangrove less than 15 years old (Kairo et al 2008, 2009). Our results synthesize canopy height measurements acquired from a variety of mangrove environments, showing that rapid vertical growth rates are universal across the natural establishment of mangroves. The similarities between forest heights in both the gained and lost areas suggest that some pioneering mangrove species can reach a height maturity in less than 16 years.
By understanding these rapid vertical growth processes we can improve remote sensing-based classification techniques and model primary and ecosystem productivity in mangrove forests.
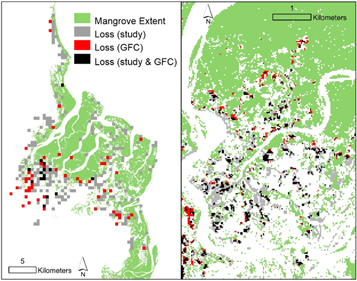
Overall, our maps show significantly more loss and gain than the GFC datasets (figure 3). Our analysis indicated that there was 11 109 ha of mangrove loss and 5430 ha of mangrove gain that was not accounted for in other change datasets. The fine-tuning of the GFC and the rigorous pixel screening process for water work well for terrestrial forests but may be the principal cause of differences with our results. Areas of overlap between our analyses and the GFC were in areas of forest clear-cutting, as seen in the Rufiji delta, but there is still only minimal overlap (figure 3, supplemental table 2). The rapid transition from forest to forest-clearing may have a greater probability of being detected by the GFC before the area becomes regularly inundated from tides and river discharge. The inclusion of flooding regions in this study can more readily capture the rapid and subtle changes that occur between vegetation and water at the coastal boundary. Deforestation will continue to be the primary cause of regional hot-spot mangrove loss (Richards and Friess 2015), although the rate of regional and global mangrove loss (Hamilton and Casey 2016, Hamilton and Friess 2018) may not be accurately representing the extent of anthropogenic and natural losses. Because of the underestimation of total mangrove forest change, mangrove loss rates may actually be higher than expected. However, mangrove forest gains through regeneration and pioneering of mudflats could significantly reduce those losses, both in area and vegetation biomass.
Figure 3. Here we compare the mangrove loss estimated in this study and the Global Forest Loss Layer (version 4) from Hansen et al 2013. (A) A comparison between the two datasets mapped at 1 km × 1 km grid cells. Gray grid cells represent mangrove loss areas detected by this present study. Black grid cells represent areas where this study and the Global Forest Loss Layer match. Red grid cells show mangrove loss areas detected by the Global Forest Loss Layer only. Each 1k m grid cell was replaced with the majority comparison loss type. (B) A region of the loss comparison map (black outline in A) shown at the original 30 m × 30 m resolution, highlighting the underestimation of the Global Forest Loss Layer in estimating losses in mangrove forests.
Download figure:
Standard image High-resolution image
Mangrove gains as observed in this study can be primarily attributed to natural processes related to sediment accumulation and mudbank development. In particular, several mangrove gain patterns were identified across the different deltas; shore-parallel banding, patch expansion, and channel closure. These development patterns are similar to mangrove gains in the Sinnamary River estuary of French Guiana (Fromard et al 2004, Proisy et al 2009). However, in the case of the four deltas, these patterns are exhibited throughout multiple river tidal channels and not just along the outer coasts. Mudflats along the river channels that were colonized quickly offered some of the most optimal growing conditions, with full sunlight, sediment supply, and proper hydrology. The rapid colonization within these regions may be related to the precociousness of some mangrove species. For example, Avicennia species can reach reproductive maturity in less than one year and, therefore, can spread rapidly around pioneering mangrove areas (Proisy et al 2009). Increasing the seedling density around mangroves has been shown to increase sediment accretion, survival rates, and aboveground dry matter production (Kumara et al 2010). Coastal landforms of mangrove ecosystems (e.g. fringing, oceanic, and basin) vary in the amount of carbon that can be sequestered in the sediments (Bouillon et al 2008, Breithaupt et al 2012, Ezcurra et al 2016). Therefore, our large-scale assessments of growth rates and extent change in mangrove forests helped to resolve the variability of carbon among different coastal landforms, by comparing young and mature forests.
The Rufiji had the tallest forests that were both lost and gained. While the gains in the Rufiji were driven by natural processes, the losses were primarily associated with illegal felling (Wang et al 2003) (supplemental figure 2). These areas of loss also overlapped with some of the taller trees that were closer to freshwater sources, as the areas have now been converted to rice paddies and have removed the higher carbon density forest, exacerbating carbon losses. The rapid vertical growth in the Rufiji may suggest more favorable hydrological and salinity conditions, but because of the anthropogenic impacts that were preferred in taller forests, the amount of mangrove carbon loss in the Rufiji was amplified (figure 2).
The Ganges and Zambezi deltas are mangrove regions relatively removed from direct anthropogenic activities. Much of the losses in these two regions can be attributed to the landward migration of the ocean–forest boundary as wind and waves eroded the shoreline. Mangroves at the Mekong site had a different response because deforested areas were limited to small and short mangrove patches within already disturbed ecosystems. Over the past three decades, this site in the Mekong (the Can Gio Biosphere Reserve) has been actively engaged in restoration to bring the forest back from degraded conditions that occurred during the Vietnam War (Hong 1996). The taller forest height gains and relatively high expansion of the reserve can be attributed to these restoration activities, management policies and enforcement, and favorable environmental conditions.
The change in carbon stocks can be estimated for each region by using a combination of the mangrove cover change map and the canopy height models. A similar technique was applied to mangrove land cover data from the Zambezi delta (Shapiro et al 2015). At the time, there were no new canopy height models available; therefore, the height of the canopy could not be determined for areas of mangrove gain. As a result, conservative estimates were used, and areas of mangrove gained were assumed to fall within the lowest height class. However, the results presented here indicate that mangrove forests can grow rapidly over just a few years and have the potential to grow taller than the conservative growth estimates. By using the new height class information, we can now estimate the carbon capture potential for mangrove aboveground and soil carbon. We do acknowledge that young and mature forests can vary in carbon stocks for a given canopy height. However, the stratification of the forest inventory by canopy height class captures the variability in carbon density across a height class. Previously, a net TEC was estimated for the Zambezi delta that indicated an increase of 691 000 Mg C, using conservative estimates of stand height (Shapiro et al 2015). In this study, we calculated a net TEC loss of 485 502 Mg C, which is in overall direct contrast to what was previously reported. There are a number of factors to be considered. We also detected a net loss of mangrove areas which was attributed to differences in the approaches used to measure change in the delta; a classification approach versus a change detection approach. Combining the changes in spatial extent along with the `before and after' height information, which accounts for mangrove growth, implies that average carbon concentrations in mangrove ecosystems are higher than previously reported for the region (Shapiro et al 2015).
The type of loss or gain that has occurred can influence the degree to which mangrove soil carbon and belowground carbon change. In this study we used the presence or absence of mangrove forests to reflect the full vertical column of mangrove carbon: aboveground, belowground, and soil. For AGC, the presence or absence is a relatively straightforward estimate of loss or gain. However, the type of loss, for example erosion or deforestation, could affect the amount of soil carbon lost. Presumably, erosion would cause a loss of significantly more soil carbon than deforestation or conversion to agriculture. The study sites presented here reflect mangrove loss from primarily natural processes, such as erosion. The Rufiji and Mekong sites do have some loss associated with mangrove conversion to aquaculture. There are opportunities to improve mangrove carbon accounting by improving the estimates of soil loss and gain for each of the various causes of change.
The four mangrove deltas can be divided into three distinct groups based on the mangrove growth characteristics: (1) Net Neutral Change; (2) Growth > Loss, and; (3) Growth < Loss. The Rufiji and Zambezi sites fall into the Net Neutral Change group, where the height of the forest that was lost was similar to the canopy height that was gained. For these two sites, even though there was a net mangrove carbon loss, the concentration of mangrove carbon that was lost was nearly equal to that which was gained, per unit of area. An additional separation could be made between the two Net Neutral Change sites, one including the consequences of human impact (i.e. Rufiji) and the other one the direct impacts from coastal transgression (i.e. Zambezi) (figure 1). The Mekong site falls into the Growth > Loss group. Here, the canopy height of the mangrove forest that was gained was, on average, nearly twice as tall as the mangrove forests that were lost (supplemental table 1). Replacement with a taller mangrove canopy plus a large increase in mangrove area in the Mekong contributed to a gain in AGC (table 1). The Ganges site falls into the last group, Growth < Loss. Here, the old forested areas that were eroded were taller than the newly established forests. Elevated salinity and sediment supply may lead to this type of condition, as much of the gains in the delta were confined to the ocean margin, where sediments are reworked and deposited by ocean processes.
Recent studies have highlighted the need to incorporate vertical growth and age into models that can predict changes in productivity and carbon concentrations (Fischer et al 2016, Hurtt et al 2016). Both the maximum and potential growth rates of mangroves would be useful for restoration and biomass estimates (Clarke and Clarke 1994, Clark and Clark 2001). The accurate measurement of vertical and horizontal growth using remote sensing can provide important information for appropriate reforestation and afforestation policies (Lewis 2005, Cormier-Salem 2017), sustainable mangrove harvesting (Goessens et al 2014, Sillanpää et al 2017), and individual ecosystem models (Chen and Twilley 1998, Berger and Hildenbrandt 2000). The results reported here are a step forward in improving the global monitoring of vegetation dynamics and mangrove blue carbon modeling across a range of geomorphology and coastal landforms.
5. Conclusion
Threats from humans, climate change, and rises in sea levels result in large uncertainties about the future of mangroves across the world. Mangrove deltas, in particular, are dynamic systems where natural processes and human development are intimately linked. For mangrove forests to meet the needs of local communities and to serve as coastal protection zones, a balance between conservation, sustainable use, and forest management is imperative. Understanding where mangrove forests are expanding and being lost is crucial to the modeling and implementation of evidence-based management and conservation. In addition to changes in mangrove extent, vertical growth is a crucial component when estimating primary production and carbon sequestration potential, and identifying areas suitable for harvesting or protecting. Mangroves are among the fastest growing forests, and we have shown here that the natural expansion of mangroves can help to offset total carbon loss by an average of 44%.
Acknowledgments
This work was supported in part by the NASA Carbon Monitoring Systems Program (N4-CMS14-0028), NASA New Investigator Program (NNX16AK79G), and the USAID/USDA Forest Service SilvaCarbon Bangladesh Program.