

Abstract
The strong sub-seasonal modulation in the atmospheric teleconnection between the North Atlantic and East Asia during boreal winter has been examined. Negative precipitation anomalies and corresponding transient eddy vorticity fluxes over the mid-latitude Atlantic induce a wave packet that leads to cold temperatures over northern China, Korea, and Japan. This relationship is significant for the anomalies averaged from mid-January to mid-February, while it is less for January or February. In mid-January segment, the transient vorticity forcing (TVF) over the mid- to high-latitude Atlantic is the strongest, and consequently, the atmospheric response strengthens the anticyclone over central Eurasia to facilitate strong development of the Siberian High as well as cold temperatures in East Asia. Model simulations support the sub-seasonal linkage modulation through amplitude change of the TVF. It is proposed that intensified atmospheric baroclinicity associated with the deepened North American trough is responsible for the pronounced TVF and downstream influences in mid-January.
Export citation and abstract BibTeX RIS

Original content from this work may be used under the terms of the Creative Commons Attribution 4.0 license. Any further distribution of this work must maintain attribution to the author(s) and the title of the work, journal citation and DOI.
1. Introduction
The recent recurring cold extremes over East Asia have caused various social and economic impacts on countries in the region (Johnson et al 2018, Ma et al 2018, Luo et al 2019a). The origin of the atmospheric teleconnections that lead to these cold events is not fully understood despite continued efforts, which reflects the complexity of the driving mechanism of the mid-latitude climate variability. While it is widely accepted that frigid temperatures over East Asia are often accompanied by quasi-stationary anticyclone over subarctic central Eurasia, which facilitates the strong development of the Siberian High through the interaction with the surface cold anomalies and East Asian trough (EAT) (Takaya and Nakamura 2005, 2013, Song et al 2016), the origin of this anomalous circulation is still under debate (Cohen et al 2012, Kug et al 2015, Mccusker et al 2016, Sung et al 2018). While some studies demonstrated that the convective anomalies over the Indo-Pacific can significantly modulate the intensity of the Siberian High (Jeong and Ho 2005, Yoo et al 2012, Song and Wu 2019), the other group of studies have highlighted the crucial role of reduced Arctic sea-ice in generating subarctic anticyclones (Zhang et al 2012, Kim et al 2014, Mori et al 2014). However, this Arctic linkage is refuted in other studies, because it is not fully supported by the global circulation model (GCM) simulations that include realistic interannual Arctic sea ice variations (Mccusker et al 2016, Blackport et al 2019, Dai and Song 2020).
In the meanwhile, increasing evidence has been found that the atmospheric teleconnections excited by the wave sources over the North Atlantic enhance both the subarctic anticyclone and Eurasian cooling (Sato et al 2014, Luo et al 2016, 2019b, Jung et al 2017, Sung et al 2018, Jin et al 2020, Wang and Tan 2020, Ye and Messori 2020). This North Atlantic origin wave trains have caused frequent and persistent growth of the subarctic anticyclone, so-called Ural blocking, thus resulted in intense cold anomalies over central Russia and Mongolia (Luo et al 2016, Sung et al 2018). However, the downstream influences of the wave trains are altered substantially by relative location of the Ural blocking (Luo et al 2016), which makes the teleconnection link with East Asian countries less significant for the seasonal time-scale (typically 3 months) (Wang et al 2011, Sung et al 2018).
One can simply think that the North Atlantic wave sources have insignificant influences on the East Asian temperature, however, it is also possible that the signal becomes blunt by taking the seasonal averaging. As the life cycles of the North Atlantic origin wave trains (i.e. approximately 2 weeks (Song et al 2016)) are relatively shorter than the seasonal time-scale, the seasonal averaging might dampen the impact of North Atlantic wave trains on East Asia, raising the necessity to examine sub-seasonal variation in the teleconnection link between the North Atlantic and East Asia, not resolved in seasonal average. This is consistent with the findings that the amplitude and structure of mid-latitude atmospheric teleconnections are largely determined by background flow conditions (Hoskins and Ambrizzi 1993, Ambrizzi et al 1995), thereby the sub-seasonal variation of climatological planetary waves alter teleconnections by modulating wave sources or energetics (Simmons et al 1983, Nakamura et al 1987, Lim et al, 2015, Sung et al 2018). For example, the North Atlantic oscillation (NAO), an important large-scale mode of atmospheric circulation over the North Atlantic, accompanies downstream wave response which becomes prominent only in February (Watanabe 2004), though its intensity is strongest from January to March (Portis et al 2001).
Given those facts, herein we suggest that the wave sources over the North Atlantic exhibit robust impacts on the East Asian climate under a particular background condition during the boreal winter season. The underlying mechanism is substantiated by two model experiments that reproduce the quasi-stationary teleconnection pattern associated with strong and persistent cold events in East Asia, which is resolved in the monthly-averaged data.
2. Data and methods
For observational analysis, we utilized the daily reanalysis data from the fifth generation of ECMWF reanalysis (ERA5) that has global coverage on 0.25 × 0.25 grids (Hersbach et al
2020). We used 2 m air temperature (T2m), precipitation, geopotential height, zonal, and meridional winds at 300 hPa after interpolating to 2.5 × 2.5 grids to focus on the large-scale variability. The linear trend in all variables were removed before analysis. We focused on a period from mid-January to mid-February (i.e. 16 January to 14 February), because a noteworthy teleconnection link and the pronounced sub-seasonal variation in the climatological planetary wave over the North Atlantic were found for this period as we shall show. To represent the temperature variation over Korea, area-averaged T2m anomalies over 122.5–132.5° E, 30–45° N were utilized. The transient vorticity forcing (TVF) which can act as an important wave source is also analyzed in this study (Hurrell 1995). The monthly TVF is calculated as  , where
  is the vorticity,
  is the horizontal wind vector, the bar denotes the monthly average, and the primes denote the 2–8 d band-pass filtered anomaly (Kug and Jin 2009). Once the monthly TVF is calculated for each year, the anomalous TVF was calculated by subtracting the climatological TVF to examine the interannual variation of the TVF. The climatological TVF at any specific month is defined as the time averages of the corresponding monthly TVF during 1979–2018.
For the GCM experiments, we utilized the two models for a different use. The Geophysical Fluid Dynamics Laboratory (GFDL) atmospheric GCM has 20 levels of sigma coordinate and horizontal resolution of T42. This dry model uses the forcing proposed in Hoskins and Jin (1991). In more detail, GFDL model experiments were performed by prescribing the observed three-dimensional meteorological states (i.e. vorticity, divergence, temperature, and surface pressure) over the mid- and high-latitude Atlantic (i.e. 60° W–10° E, 30–80° N, denoted by black box in figures 1(e) and (f)). Rayleigh drag and Newtonian cooling are applied to the vorticity, divergence, and thermodynamic equations for damping. The model simulates steady responses for prescribed forcing that are not accompanied by moisture advection. The basic-states for the model simulations were given as the time-averaged values from 1979 to 2018. This type of model simulations is often used to investigate the atmospheric responses to the given observed states (Hoskins et al 2012).
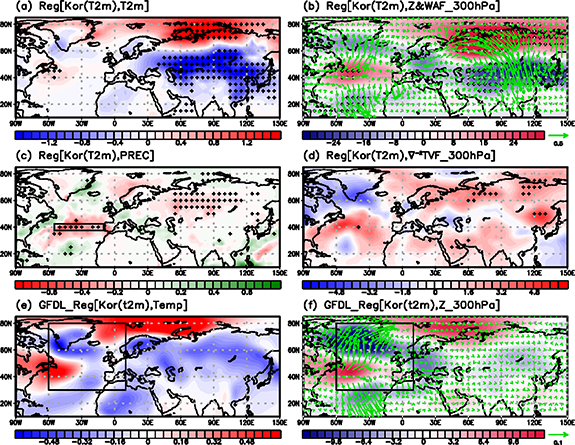
Figure 1. The regressed (a) 2 m air temperature (T2m) anomaly (unit: K K−1), (b) geopotential height (shaded, unit: m K−1) and wave activity flux (WAF) anomaly (green vector, unit: m2 s−2 K−1) at 300 hPa, (c) precipitation anomaly (unit: mm d−1 K−1), and (d) inverse Laplacian of the TVF anomaly (unit: m2 s−2 K−1) at 300 hPa onto the T2m anomalies over the Korean peninsula (122.5–132.5° E, 30–45° N) during mid-January (i.e. averaged values from 16 January to 14 February). The shaded anomalies, which are significant over a 95% confidence interval, are denoted by a black cross. The WAF is drawn only when it is over the 95% confidence interval. The simulated (e) T2m anomalies, and (f) geopotential height (shaded) and WAF anomalies (vector) at 300 hPa using the GFDL dry model by prescribing three-dimensional atmospheric variables regressed onto the Korean T2m anomalies over the Atlantic (60° W–10° E, 30–80° N, black box).
Download figure:
Standard image High-resolution imageOn the other hand, to elucidate a role of TVF on the sub-seasonal modulation of the teleconnection, the stationary wave model (SWM) was utilized (Ting and Yu 1998, Schubert et al 2011). The SWM is based on three-dimensional primitive equations in sigma coordinates. The model-generated transient disturbances are suppressed by strong damping, and it has a rhomboidal wavenumber-30 truncation in the horizontal and 14 unevenly spaced vertical sigma levels.
3. Results
Figure 1 shows the regressed meteorological variables on the T2m anomalies over Korea averaged from mid-January to mid-February. It is to be noted that the regressed field is shown after multiplying −1 in order to present a pattern that corresponds to the anomalous cold temperatures in East Asia. These cold anomalies occupy a wide range of areas covering southern Russia, Mongolia, northern and eastern China, and Japan, and are concurrent with the cold anomalies in the Korean peninsula; this reveals the involvement of a large-scale teleconnection pattern behind the temperature anomalies in Korea (figure 1(a)). Meanwhile, pronounced warm anomalies have been observed over subarctic Eurasia including Russia, the Kara Sea, and the Laptev Sea.
These temperature anomalies are closely linked to dipolar geopotential height anomalies at 300 hPa over the Eurasian continent (figure 1(b)). Northern anticyclonic anomalies over central Russia show typical atmospheric features that promote the growth of the Siberian High which governs surface air temperature over East Asia (Takaya and Nakamura 2005). This anticyclonic anomaly, which is often referred to as Ural blocking (Luo et al 2016), exerts cold advection to the center of the Siberian High located downstream surface, thus acts to intensify the surface high. Furthermore, the cyclonic counterpart in the south presents a southwestward-expanding climatological trough over the East Asia, which indicates the development of the EAT. The EAT contributes to cold air intrusion over East Asia as facilitating further growth of the Siberian High by hindering the eastward expansion of the surface high (Park et al 2011, Song et al 2016). This dipolar wave pattern in the upper troposphere leads to a strong baroclinic structure with the surface high and reinforces surface cold anomaly by extracting available potential energy from the basic state (Takaya and Nakamura 2005). This is also consistent with previous studies highlighted the role of the EAT in inducing contrasting temperature patterns over East Asia and different parts of the Northern Hemisphere by interacting with preexisting surface cold anomalies over Siberia, leading to the intensification of Ural-Siberian blocking (Song et al 2016, Bozkurt et al 2019).
Notably, the dipole pressure anomalies over eastern Eurasia are a part of wave-trains originating from the North Atlantic. The 300 hPa wave activity flux (WAF) (vectors in figure 1(b)) is northward in the Atlantic near 60° N and southward near 30° N, showing divergence. This can be interpreted as the existence of a wave source over the mid-latitude Atlantic Ocean (Takaya and Nakamura 2005). Consistently, significant precipitation anomalies with amplitude of −0.5 mm d K−1 are also observed over the North Atlantic (figure 1(c)). To support this notion, the GFDL model simulation is performed by prescribing the three-dimensional vorticity, divergence, temperature, surface pressure fields regressed onto Korean T2m anomalies as a forcing. The GFDL model simulation with forcing over the Atlantic (i.e. 60° W–10° E, 30–80° N, denoted by black box in figures 1(e) and (f)) successfully mimics the cold anomalies prevailing over Eurasia and the warming in the Arctic (figure 1(e)). The wave-train, which links the mid- to high-latitude Atlantic and East Asia, is also clearly simulated (figure 1(f)). This suggests that the near-surface temperature anomalies over Korea can be induced by the Rossby wave-trains excited by the atmospheric conditions over the North Atlantic.
To confirm the linkage between the Atlantic climate variability and East Asian temperature, we define an index to represent the wave source over the central Atlantic using the precipitation anomaly over 55–10° W, 37.5–42.5° N (boxed region in figure 1(c); hereafter CATL). The regressed fields onto this precipitation index during our study period (i.e. mid-January to mid-February) shows that the Atlantic forcing is linked to the cold temperature anomalies over East Asia through the atmospheric teleconnections (supplementary figure 1, which is available online at stacks.iop.org/ERL/16/014033/mmedia).
This result is overall consistent to Luo et al (2016) which revealed a teleconnection linkage that originates from the North Atlantic to amplify winter warm Arctic-cold Eurasia anomalies. Though exhibiting weaker cold anomalies over Korea and Japan, their observational analysis showed that anomalous circulation pattern which resembles the positive NAO can affect growth of the Ural blocking over downstream Eurasia through energy dispersion. The results of GFDL model experiments support the arguments in Luo et al (2016), as the meridional dipolar anomalies over the North Atlantic shown in figure 1(f) and downstream anticyclone over central Eurasia closely resemble the positive NAO and Ural blocking, respectively.
Notably, the relationship between this CATL precipitation and the T2m over Korea is significant for the anomalies averaged for our study period (temporal correlation: r = 0.49), but not for the anomalies averaged during January or February (r = 0.02 for January and r = 0.15 for February). This shows that the strength of the linkage between the mid-latitude Atlantic wave source and the temperature anomaly over Korea is considerably modulated on a monthly time scale. Note that, for all three periods, the lead/lag correlation between two variables are weaker than the simultaneous correlation.
This distinct sub-seasonal variability is evident in the spatial distribution of the temperature and sea-level pressure (SLP) anomalies associated with the CATL precipitation (figure 2). Consistent with the correlation coefficient, the amplitude of the T2m anomalies over East Asia is prominently different among periods; the negative T2m anomalies over northern China, Korea, and Japan in January and February are systematically weaker than those in mid-January (i.e. averaged from mid-January and mid-February). Specifically, in January, the negative T2m anomalies are confined over central Asia. Meanwhile, in February, the negative T2m anomalies are nearly zero over Korea and Japan.

Figure 2. The regressed T2m (shading, unit: K mm−1 d−1), sea-level pressure (contour, unit: Pa mm−1 d−1) and wave activity flux at 300 hPa (vector, unit: m2 s−2 mm−1 d−1) anomalies onto the mid-latitude central Atlantic (55–10° W, 37.5–42.5° N) precipitation index during (a) January (averaged from 1 January to 31 January), (b) mid-January (averaged from 16 January to 14 February), and (c) February (averaged from 1 February to 28 February). Note that we multiplied −1 to the regressed field to maintain consistency with figure 1, the WAF is drawn only when it is over a 95% confidence interval.
Download figure:
Standard image High-resolution imageIt is worthy of note that these distinct cold anomalies between periods coincide with perturbed intensity of the surface high over inland Eurasia. As denoted by figure 2(b), the stronger cold anomaly in mid-January is accompanied by stronger surface high pressure anomaly centered in central Siberia and extended towards East Asia. This zonally elongated surface pressure pattern, which shows the expanded subarctic anticyclonic branch combined with the Siberian High, results from intense vertical interaction between upper-level wave train and the surface high (Takaya and Nakamura 2005). By contrast, in January, the high surface pressure anomaly is confined only over the western Siberia (figure 2(a)), and shifted southward in February (figure 2(c)), both indicating weaker coupling between the upper- and lower-level systems, even though the circulation anomalies over the North Atlantic are not largely different from that of mid-January. The upper-level WAF supports that the intensification of the surface high is caused by the wave train excited by the wave source over the mid-latitude central Atlantic. The WAF is northward from the mid-latitude to north Atlantic, and it is southeastward over Eurasia continent. The positive SLP anomalies are located along those WAF over Russia which indicates the enhancement of the Siberian high. This suggests that slight differences in the upper-tropospheric circulation can significantly alter the downstream influence.
We find one of the reason for this month-to-month difference from the activity of transient eddies along the North Atlantic storm track. Horizontal pattern of the TVF associated with the T2m over the Korean peninsula shows a significant negative TVF anomaly at 40° N over the Atlantic, where a distinct negative precipitation anomaly is observed, and a positive value over north Atlantic over 50–65° N (supplementary figure 2; See Methods for details of calculating the TVF). The negative TVF anomaly is dynamically consistent with the positive geopotential height (streamfunction) anomalies shown in figures 1(b) and (d), which suggests that the quasi-stationary atmospheric waves over the Atlantic might be a result of the TVF anomaly (Lim 2015, Luo et al 2016, Sung et al 2018). The month-to-month difference of the TVF anomaly over the 300 hPa Atlantic (averaged over 60–30° W) is shown in figure 3(a), in which TVF anomalies regressed onto the CATL precipitation index for each month. A marked negative TVF anomaly over 40° N contrasts with the positive TVF anomaly around 60° N. It is worth noting that these components are the greatest in mid-January (See supplementary figure 2 for the horizontal pattern of TVF anomalies for each period). It is presumed, therefore, that remote energy propagation from a region of strong transient wave sources could intensify atmospheric teleconnections, especially in mid-January.

Figure 3. (a) The longitudinally-averaged (60–30° W) TVF anomalies (unit: s−2 mm−1 d−1) regressed onto the mid-latitude central Atlantic precipitation index. Note that we multiplied −1 × 10⁻⁵ to the regressed field to maintain consistency with figure 1. The gray, and light green area denotes the 95% confidence level of the regressed TVF anomalies using the bootstrap method of 1000 resampling during January and February, respectively. (b)–(d) Responses of the 300 hPa stream function (shading) to the observed TVF over 60–30° W, 40–65° N (contours) in (b) mid-January, (c) January, and (d) February. The difference of the 300 hPa streamfunction anomalies between (e) January and mid-January (i.e. January–mid-January), and (f) February and mid-January (i.e. February–mid-January). Note that the SWM results show the averaged response for first 20 d since the steady forcing is exerted. Solid (dashed) contours denote anticyclonic (cyclonic) circulations.
Download figure:
Standard image High-resolution imageTo demonstrate this point, we performed idealized SWM model experiments forced with observed TVF over the north Atlantic (60–30° W, 40–65° N) during different monthly periods (contours over the North Atlantic in figures 3(b)–(d) denote TVF forcing). To focus on the role of TVF, the background basic state is set to be identical for all experiments, using the conditions of mid-January. However, we note that the results were not sensitive to the background flow changes, indicating that the difference in the ray path of the stationary waves between different monthly period is ignorable (data not shown). Notably, the overall wave-train response is quite similar to the observed pattern over the Atlantic and Eurasia (shading). The anticyclonic wave branch over subarctic central Eurasia and cyclonic downstream branch to the southeast, which promote the development of the Siberian high and the EAT, are clearly shown. This substantiates that the teleconnection link can be understood using simple wave dynamics in the SWM, supporting the notion that teleconnection patterns over the North Atlantic are driven by transient eddy vorticity fluxes (Franzke and Feldstein 2005, Lim 2015, Luo et al 2016).
It should be noted that the anticyclonic and cyclonic circulation anomalies centered over subarctic Eurasia and northern China, respectively, exhibit a prominently stronger intensity in mid-January (figure 3(b)) than those in January and February (figures 3(c)–(f)). For more detailed understanding on the role of TVF, we performed additional SWM experiments with identical pattern of the bell-type forcing with different amplitude (supplementary figure 3). When forced by the bell-type TVF with different amplitude, the results show the strongest atmospheric responses with the stronger TVF forcing. This supports the aforementioned inference that the stronger TVF anomaly over the Atlantic is one of the reason for the clearer remote influence across Eurasia reaching East Asia in mid-January.
The distinct sub-seasonal variability of the TVF anomalies seems to be closely linked with the sub-seasonal evolution of climatological planetary waves over the North Atlantic. As demonstrated by the SWM experiments, the atmospheric teleconnection pattern that modulates East Asian winter temperatures originates from narrow bands of wave source, which is regulated by atmospheric baroclinicity over the North Atlantic (Sung et al 2018). The strongest TVF in mid-January, thus, would imply that there is robust energy conversion from the background flow to the synoptic-scale system during this particular period. To verify this relation, it is imperative to investigate the sub-seasonal evolution of the background flow.
As shown in figure 4(a) (shading), the climatological flow in the upper troposphere illustrates a slope that corresponds to a pressure trough over the North Atlantic, which is often called the North American (NA) trough (Wang et al 2009). It has been proposed in a previous study that the intensity variation of the NA trough can be captured by the mean meridional wind at the eastern border of the trough (60–30° W, 45–75° N) (Sung et al 2018). We observe that intensity of the climatological NA trough peaks during mid-January to mid-February (black curve in figure 4(b)), which is the period when the teleconnection link to East Asia maximizes. To further demonstrate the sub-seasonal variation of the baroclinic instability associated with the NA trough, we calculated Eady growth rate defined as 0.31( f/N)d|V|/dz, where f is the Coriolis parameter, N is the static stability, z is the vertical coordinate, |V| is a horizontal wind speed (Eady 1949, Song et al 2016). The climatological Eady growth rate over the North Atlantic shows a similar time evolution with the amplitude of the NA trough which exhibits a maximum amplitude during mid-January segment. This intrinsic sub-seasonal variation explains why synoptic disturbance activity can be intensified over the North Atlantic during the study period by increasing the baroclinic instability (Orlanski and Sheldon 1995). This eventually favors the growth of the wave train to allow for a downstream teleconnection link to East Asia.
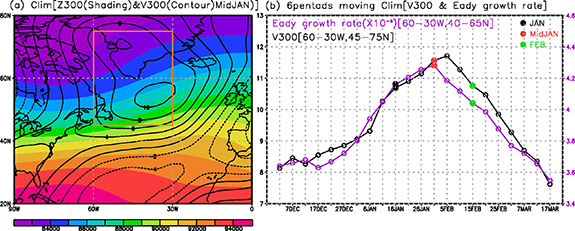
Figure 4. (a) Climatological geopotential height (shading, unit: m) and meridional wind (contour, unit: m s−1) at 300 hPa from mid-January and mid-February. (b) Six-pentads moving average of the meridional wind climatology at 300 hPa averaged over 60–30° W, 45–75° N (black) and Eady growth rate at 850 hPa over 60–30° W, 40–65° N (purple, unit: 10−6 s−1). The segment corresponding to the January, mid-January, February are denoted as black, red, and green dots, respectively. Note that the Eady growth rate is firstly calculated using daily data, then, time-averaged for six-pentads to obtain the six-pentads moving climatology.
Download figure:
Standard image High-resolution imageTo further demonstrate that the amplitude of the TVF anomalies is dependent on the intensity of the NA trough, we firstly divided total monthly periods into three groups according to NA trough. That is, among total 120 cases (i.e. January-, mid-January-, and February-averaged data from 1979 to 2018), 40 cases whose meridional wind over the North Atlantic (60–30° W, 45–75° N) are strongest, and weakest are defined as a strong, and weak NA trough cases, respectively. And, the remaining 40 cases are defined as a modest NA trough case. Then, the regressed TVF anomalies onto the CATL precipitation is calculated. Among three cases, the area-averaged TVF anomalies over the North Atlantic exhibits strongest amplitude in the strong NA trough case (figure 5(a)). Consistently, the spatial distribution of the regressed TVF anomalies shows that the negative streamfunction tendency anomalies over the North Atlantic is strongest during strongest NA trough cases (figures 5(b)–(d)). This supports the notion that the intensified NA trough can contribute to enhance the synoptic scale variability, which serves as a wave source responsible for the atmospheric teleconnection pattern from the North Atlantic to the East Asia.
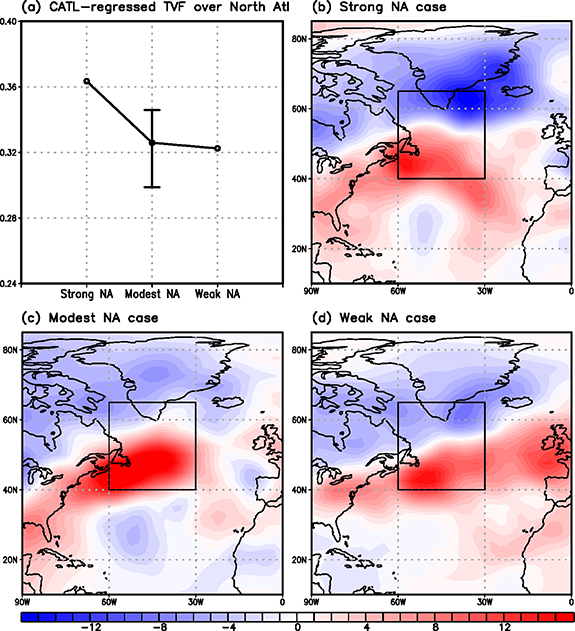
Figure 5. (a) The area-averaged (60–30° W, 40–65° N) absolute value of the TVF anomalies (unit: 10−10 s−2 mm−1 d−1) regressed onto the CATL precipitation index in 40 monthly cases with strongest, modest, and weakest meridional wind value over north Atlantic (60–30° W, 45–75° N) among total 120 cases (= 40 years × 3 monthly segments (i.e. January, mid-January, and February)). The spatial distribution of the regressed inverse Laplacian of the TVF anomalies (unit: m2 s−2 mm−1 d−1) onto the CATL precipitation with (b) strong, (c) modest, and (d) weak NA trough cases. The error-bar in panel (a) denotes the 95% confidence range using the bootstrap method.
Download figure:
Standard image High-resolution image4. Conclusions and discussions
In this study, the strong sub-seasonal variation of the atmospheric teleconnection between the North Atlantic and East Asia was examined. The transient eddy vorticity flux that corresponds to negative precipitation anomalies over the central North Atlantic can induce a wave packet that propagates from the North Atlantic to East Asia across Eurasia, leading to cold temperatures over northern China, Korea, and Japan. This linkage significantly varies from month to month; namely, the relationship becomes significant for the anomalies averaged from mid-January to mid-February, while it is not for January- or February-averaged anomalies. These strong month-to-month variations are due to distinct sub-seasonal variations in the TVF, which result from changes in the climatological trough. The climatological intensity of the NA trough reaches its peak in mid-January and the consequent intensification of the atmospheric baroclinicity increases the TVF anomalies. This enables a strong wave response in mid-January that accompanies strengthened anticyclonic circulation to branch over subarctic central Eurasia to promote the intensification of the Siberian High as well as cold temperatures in East Asia. Those mechanisms are schematically drawn in figure 6.

Figure 6. The schematic diagram of the Atlantic-originated teleconnection pattern during mid-January. In the upper panel, the blue line denotes the climatological North American trough which exhibits maximum amplitude during mid-January segment. The black circles denote the upper-level circulation, and red and green hatched circles denote the negative and positive TVF (or precipitation) anomalies, respectively. In the low panel, red, and blue circles denote the positive, and negative surface temperature anomalies, respectively. The intensification of the Siberian surface high is denoted by black circle.
Download figure:
Standard image High-resolution image
The atmospheric teleconnection pattern reported in this study shows a distinct horizontal structure of teleconnection that is similar, to some extent, to the East Atlantic/Western Russia (EA/WR) pattern (Barnston and Livezey, 1987, Lim 2015), and also resembles the NAO (e.g. pattern correlation between NAO and figure 1(b) is 0.56 over the Atlantic with a 95% confidence interval). Therefore, one may regard the teleconnection pattern identified herein as a statistical artifact that arises from the co-existence of EA/WR and NAO patterns. However, observational results show that this teleconnection pattern is frequently observed while the NAO decays during winter (Luo et al 2016). As confirmed by the TVF analysis and SWM experiments, besides, the wave pattern has a specific dynamical source, which becomes dominant particularly for mid-January which denotes it is likely a real physical mode. Regarding this issue, a continuum perspective, which finds various intermediate patterns resembling both EA/WR and NAO over the North Atlantic, may provide a useful point of view (Franzke and Feldstein 2005, Johnson et al 2008). This perspective explains that teleconnection continuums can be manifested under various background conditions and forcing. In this regard, our results reveal that a certain type of teleconnection pattern, whose influence is efficiently conveyed in East Asia, is favored under the background condition of mid-January.
One may be curious about the role of Atlantic Ocean in generating the dipolar TVF anomalies and the CATL precipitation. The sea surface temperature (SST) anomalies regressed onto the CATL precipitation exhibits the tripolar structure (supplementary figure 4), which is one of dominant SST modes over the Atlantic (Czaja and Frankignoul 2002). At the northern edge of the negative tropical SST loading, the meridional SST gradient is weakened to reduce the baroclinic instability. As a result, the amplitude of the synoptic-scale disturbances over the CATL region, which is closely linked to the local convective activities, can be also weakened. On the other hand, the meridional SST gradient is intensified around 50–60° N Atlantic to increase the TVF anomalies. This denotes that the dipolar TVF anomalies (shown in figure 3(a)) can be affected by the tripolar SST anomalies over the Atlantic. This coupling between the SST and TVF is dependent on the intensity of the NA trough, as the intensity of the NA trough is a proxy for the instability to determine the overall transient eddy activities and the resultant TVF intensity. In addition, the oceanic influence is not totally independent from the NA trough as the diabatic heating from the ocean plays a role in shaping the stationary waves (Held et al 2002, Garfinkel et al 2020). Therefore, the anomalous precipitation and TVF responses that are pronounced for a month are attributable to both the NA trough and the SST anomalies.
Though this study highlights that the impact of the atmospheric teleconnections can be quite selective about the amplitude of atmospheric responses to monthly variation at the climatological state, the same strong sensitivity of teleconnection response to background conditions has also been identified on a decadal time scale (Sung et al 2018). This means that the suggested mechanism in our study works for various time scales. It also implies that a detailed climate analysis using sub-seasonal anomalies would increase our understanding of the mid-latitude atmospheric teleconnection patterns and its resultant climate impacts.
Acknowledgments
Y-G Ham is supported by the National Research Foundation of Korea (NRF) under Grant No. NRF-2020R1A2C2101025. S-G Lee are supported by the Korea Meteorological Administration Research and Development Program under Grant No. KMI2018-03214. M-K Sung is supported by the National Research Foundation of Korea (NRF) under Grant No. NRF-2018R1A5A1024958. The European Centre for Medium-Range Weather Forecasts (ECMWF) provided the fifth generation of ECMWF reanalysis (ERA5).
Data availability statement
The data that support the findings of this study are openly available at the following URL/DOI: www.ecmwf.int/en/forecasts/datasets/reanalysis-datasets/era5.