


Abstract
Carbon neutrality has been proposed due to the increasing concerns about the consequences of rising atmospheric CO2. Previous studies overlooked the role of lost particle organic carbon (POC) and excreted dissolved organic carbon (DOC) from seaweed cultivation in carbon sequestration, that is to say, long term carbon storage in the oceanic sediments and in the water. This study assessed the potential of seaweed cultivation to achieve carbon neutrality of China by 2060 using a new method that included lost POC and excreted DOC. Based on the seaweed production in the years 2015–2019 in China, harvested seaweed removed 605 830 tonnes of carbon, 70 615 tonnes of nitrogen and 8 515 tonnes of phosphorus from seawaters annually; farmed seaweed sequestrated 344 128 tonnes of carbon and generated 2533 221 tonnes of oxygen annually. Among the seven farmed seaweeds, Gracilariopsis lemaneiformis has the highest capacities for carbon removal (9.58 tonnes ha−1 yr−1) and sequestration (5.44 tonnes ha−1 yr−1) and thus has the smallest cultivation area required to sequestrate 2.5 Gt CO2 that is annually required to achieve China's carbon neutrality goal by 2060. The O2 generated by seaweed cultivation could increase dissolved oxygen in seawaters (0–3 m deep) by 21% daily with gas exchange excluded, which could effectively counteract deoxygenation in seawaters. Gracilariopsis lemaneiformis also has the highest N removal capacity while Saccharina japonica has the highest P removal capacity. To completely absorb the N and P released from the fish mariculture, a production level or a cultivation area two and three times larger (assuming productivity remains unchanged) would be required. This study indicates that seaweed cultivation could play an important role in achieving carbon neutrality and mitigating deoxygenation and eutrophication in seawaters. Cultivation cost could be offset to some extent by increased sales of the harvest parts of the seaweed for food and biofuel.
Export citation and abstract BibTeX RIS

Original content from this work may be used under the terms of the Creative Commons Attribution 4.0 license. Any further distribution of this work must maintain attribution to the author(s) and the title of the work, journal citation and DOI.
1. Introduction
Due mainly to human activities, the atmospheric CO2 increased to 419 ppm in April 2021, which is 50% above pre-industrial levels and the highest level ever recorded in human history (NOAA 2021). The rapid increase in atmospheric CO2 levels has caused a series of consequences. Since 1993, the rate of ocean warming has more than doubled (IPCC 2019). As the ocean continues to absorb more CO2, the pH decreases and the ocean becomes more acidic, termed ocean acidification. The pH in global surface seawater has decreased by 0.1 units compared to the pre-industrial levels. Ocean warming and acidification are disturbing ecosystems and leading to severe ecological risks. For instance, ocean warming and acidification can lead to the bleaching of coral (Anthony et al 2008), shorten the life cycle of bloom-forming macroalgae (Gao et al 2017a), increase the competitive advantage of red-tide algae (Gao et al 2019) and the accumulation of toxic compounds across trophic levels (Jin et al 2015).
The impacts of climate change have raised considerable concerns from scientists to policy-makers. The 2015 Paris Agreement states the importance of the global response to climate change, and the urgency of maintaining global warming below 2 oC, with aspirations toward 1.5 oC (United Nations 2015). To achieve the 2015 Paris goals, CO2 emissions must be reduced. Accordingly, many countries made pledges to reduce CO2 emissions. As the largest CO2 emitter, China has promised to reach peak emissions by 2030 and carbon neutrality by 2060. To implement carbon neutrality, negative carbon technologies (NETs) that remove greenhouse gases from the atmosphere by deliberate human activities must be employed in addition to reducing carbon emissions. Ocean-based NETs including marine bioenergy with carbon capture and storage, restoring and increasing coastal vegetation, ocean fertilization, enhancing weathering and alkalization have been proposed recently (Gattuso et al 2021). Meanwhile, there is very little information on using macroalgae to achieve carbon neutrality, although there are some assessments of carbon sequestration of wild macroalgae (Krause-Jensen and Duarte 2016).
In addition to CO2 emissions, eutrophication is another challenge for the sustainability of ecosystems. It can lead to harmful algal blooms and anoxia, impairing aquatic ecosystems and the involved goods and services supply and even human health (Le Moal et al 2019). In some countries and areas, the environmental crises caused by eutrophication have become an urgent societal issue, referring to a wide variety of stakeholders with contrasting values and interests (Smetacek and Zingone 2013). It is commonly considered that anthropogenic nitrogen and phosphorus pollutions including agricultural and industrial discharge are the main drivers of eutrophication (Khan and Mohammad 2014). Seaweed bioremediation is considered as an ideal way to combat aquaculture effluent and coastal eutrophication (Roleda and Hurd 2019).
Due to the combination of ocean warming, oceanic overturning slow-down (e.g. slowing of the Gulf Stream) and an increase in biological consumption, the global oceanic oxygen content has decreased by 2.1% during the past five decades (Schmidtko et al 2017). It is predicted that the dissolved oxygen inventory of the global ocean will decrease by 1%–7% by the year 2100 due to ocean warming and the reduced ventilation of the deep ocean (Keeling et al 2010). Coastal deoxygenation shows more rapid rates due to eutrophication and ocean circulation shift (Rabalais et al 2014, Claret et al 2018). Ocean deoxygenation would cause severe ecological impacts, including mass mortality of habitat-forming seagrass and corals, and declines in fisheries catches since many organisms live with oxygen (Laffoley and Baxter 2019).
Seaweeds play a crucial role in sustaining coastal ecosystems, servicing as refuge, foraging and nursery habitats for marine animals, and supplying food, medicine and biofuels for humans (Gao et al 2018, 2020, Krause-Jensen et al 2018). Due to the rising demand, seaweed cultivation is expanding globally (Ferdouse et al 2018). There are studies investigating the potential of seaweed farming for carbon sequestration (long term storage of carbon in the sea) and climate change mitigation (Chung et al 2011, Duarte et al 2017, Chen and Xu 2020); however the lost POC and excreted DOC during seaweed farming have usually been overlooked in previous studies, although they account for considerable proportions of net primary productivity (NPP) (Zhang et al 2012, Krause-Jensen and Duarte 2016). China is the biggest country for seaweed production as well as CO2 emissions and it also suffers from eutrophication and deoxygenation due to population bloom and the rapid development of the economy. However, little is known about the contribution of seaweed cultivation to long-term carbon sequestration and deoxygenation. In addition, the potential for using seaweed cultivation to achieve carbon neutrality of China by 2060 is unclear. In this study, we analyzed the contribution of seaweed cultivation in China to carbon, nitrogen and phosphorus removal, carbon sequestration and deoxygenation, and evaluated the potential for using the seven main seaweed species to achieve carbon neutrality based on the NPP that includes lost POC and excreted DOC. This study supplies new insights into using seaweed cultivation to facilitate carbon neutrality and sustainable development.
2. Materials and methods
2.1. Seaweed productivity
The data on seaweed production and cultivation area are from the China Fishery Statistical Yearbook for the years of 2000–2020. Annual productivity of seaweeds was calculated by dividing production by cultivation area. Only cultivated seaweeds are involved in these data. Seaweeds are cultivated in coastal seawaters along the coastline of China from Liaoning Province in the North of China to Hainan Province in the South of China. The culture period varies with different species (table S7 available online at stacks.iop.org/ERL/17/014018/mmedia). The census method is used to estimate the production and cultivation area of seaweeds in China, in which data are collected from each local farmer and then compiled (Gao 2015). Although there may be some errors during the data collection and compilation, census is considered to a reliable statistical method because all the items are taken into account (Baffour et al 2013). It is very difficult to know the uncertainties of such Statistical Yearbook data because the 'real' data are unavailable. The parameter that would affect the assessment of seaweed potential to achieve carbon neutrality and mitigate deoxygenation and eutrophication is annual productivity. The highest annual productivity (18 tonnes DW ha−1 yr−1 in 2019) of U. prolifera documented by the Statistical Yearbook is close to that (20 tonnes DW ha−1 yr−1 in 2019) of U. prolifera, the same species, cultivated in Japan (Hiraoka and Oka 2008). Based on this comparison, the data from the Statistical Yearbook seem reliable.
2.2. C, N, and P removal
The combination of published data and data measured by ourselves on tissue C, N and P content was used (tables S1–S3). The published data were obtained through a search of ISI Web of Science, CNKI and Scholar Google on 11 May 2021, using the terms 'carbon, nitrogen, phosphorus, seaweed and China' as keywords, and hence all literature published before 11 May 2021 was screened. Twenty seven papers were finally selected after double-checking whether the reported seaweeds were from Chinese seas.
In terms of the data from the present study, Pyropia haitanensis (January 2021) and Gracilariopsis lemaneiformis (March 2021) were collected in Sansha Bay in Fujian Province, China, Betaphycus gelatinum was collected in a seaweed farm in Changjiang, Hainan Province, China in March 2021, and Ulva prolifera was from Xiangshan Bay, Zhejiang Province, China in March 2021. Content of tissue carbon and nitrogen was measured by an Elementar Vario EL Cube (Elementar, Germany). Tissue phosphorus content was determined according to the method in Solórzano and Sharp (1980).
Mean C, N and P contents of seven farmed seaweeds were calculated based on the published data and our own data. To better represent the current status of cultivated seaweeds, the average seaweed annual production (harvested biomass, P) during 2015–2019, rather than 1999–2019, combined with the mean C, N and P contents (CC/N/P), was used to calculate the removal amount of C, N and P (RAC/N/P) from coastal waters. The removal capacity of C, N or P (RCC/N/P) for each seaweed species is calculated by dividing removal amount of C, N or P by the cultivation area (A). The corresponding formulas are as follows:


The removed carbon will be released into the atmosphere if seaweeds are used for food. However, it can be sequestered if the negative emission technology of BECCS (bioenergy with carbon capture and storage) is deployed (Hanssen et al 2020).
2.3. Carbon sequestration
Carbon sequestration is defined as the amount of carbon that could be stored in the ocean in the long-term (>100 years). Carbon sequestration by seaweed cultivation occurs because a large part of the plant matter is not extracted (harvested) but disintegrates in the ocean, breaking up into particle organic carbon (POC) that falls to the ocean floor and is stored in sediment, or remaining as refractory organic carbon dissolved in the water. The amount of sequestration can be calculated based on the following formulas:
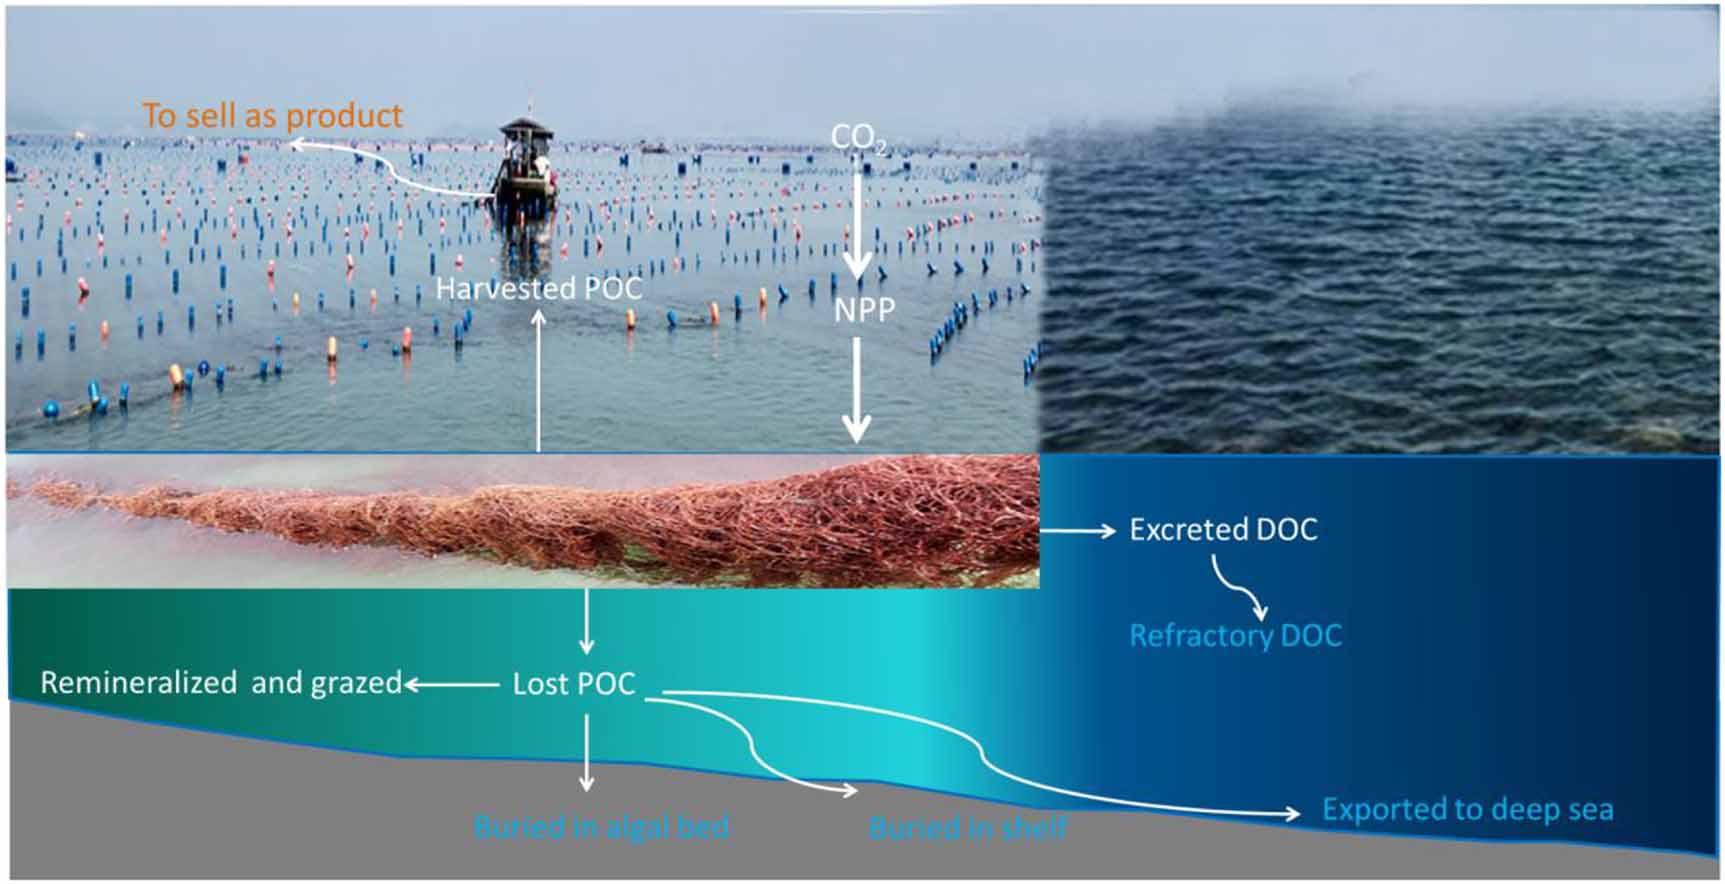
The formulas (3) and (4) are based on the integration of Krause-Jensen and Duarte (2016) and Zhang et al (2017), where POCb 1 = POC buried in the algal bed, POCb 2 = POC buried in the shelf, POCe = POC exported to the deep sea, rDOC = refractory DOC (dissolved organic carbon), POCh = harvested POC, POCl = lost POC due to remineralization, grazing, detachment, breakoff, etc, equal to the sum of the remineralized and grazed POC, POCb 1, POCb 2 and POCe , DOCe = excreted DOC by seaweeds. Please see figure 1 for the whole picture of the carbon pathways of cultivated seaweeds and the sequestrated carbon is marked in blue. According to Krause-Jensen and Duarte (2016), the ratios of POCb 1, POCb 2 and POCe to NPP are 0.004, 0.009, 0.023, respectively; according to Wada et al (2008) and Watanabe et al (2020), the ratio of rDOC to DOCe is 0.562; according to Zhang et al (2012), the ratio of harvested POC to lost POC is 0.622; according to Krause-Jensen and Duarte (2016), the ratio of DOCe to NPP is 0.233. Therefore, it can be calculated that the ratio of harvested POC to NPP is 0.294 and the ratio of carbon sequestration to harvested POC is 0.568. It is worth noting that these ratios are generalized and different seaweeds would have different values. The specific ratios for each seaweed species are unavailable and we have to use the generalized ones in this study for now.
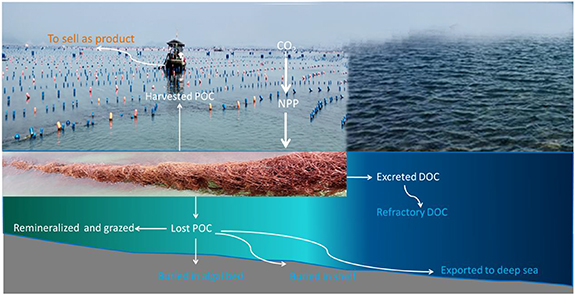
Figure 1. Carbon pathways of cultivated seaweeds. Sequestrated carbon is marked in blue. NPP means net primary productivity, POC means particle organic carbon, and DOC means dissolved organic carbon.
Download figure:
Standard image High-resolution image2.4. Required area to achieve carbon neutrality and sensitivity analysis
The required area (ACi) to achieve carbon neutrality for each seaweed species was calculated according to the formula of

where TC is the total CO2 amount that is needed to be sequestrated annually to achieve the China carbon neutrality goal by 2060, which is 2.5 Gt CO2 according to Fuhrman et al (2020); Csi is the carbon sequestration capacity (Cs in formula (3)) for each seaweed species.
A sensitivity analysis was undertaken to identify which component of the seaweed cultivation contributes most directly to the required area to achieve carbon neutrality of China. For this analysis, every input factor had a ±30% change from its baseline value that was shown in section 2.3, while all other input factors remained constant, to detect its effect on the required area.
2.5. Oxygen release
The amount of oxygen released by seaweed cultivation was calculated according to the photosynthesis equation:

when every tonne of carbon is fixed, 2.67 tonnes of O2 are generated. Here the carbon that is involved includes harvested carbon and sequestrated carbon.
2.6. N and P release by fish mariculture
Released N and P by fish mariculture were calculated by the following formulas:


The formulas (7) and (8) are based on Lazzari and Baldisserotto (2008), where Nr and Pr are released N and P, F = feed amount, C = content of N or P in feeds, R = retention rate of feed N or P in fish, P = fish production, and Fc = feed coefficient, the feed consumption per unit weight increase of fish. Here, the assumption is that half of the fish increase in weight is from artificial feeds and the other half is from wild feeds (fresh trash fish) based on recent investigations (Wang 2016, Li et al 2021). The contents of N and P in artificial feeds are 6.85% and 1.40%, respectively (table S4) and for wild feeds they are 2.68% and 0.48% respectively (table S5). The retention rate of feed N or P in fish is set at 30% based on previous studies (Xu et al 2007, Lazzari and Baldisserotto 2008, Herath and Satoh 2015). The fish average annual production is 1392 435 tonnes based on the China Fishery Statistical Yearbook 2016–2020. The feed coefficient is 1.52 and 6.49 for artificial and wild feeds, respectively (table S6).
2.7. Required area to bioremediate fish mariculture
The areas required to remove N (AN) and P (AP) released by fish mariculure were calculated by the formulas

and

where TN and TP are the total N and P amounts released by fish mariculture, respectively; Ni and Pi are the N and P removal capacities for each seaweed, respectively. The amounts of N and P released by fish mariculture could be calculated using formulas (7) and (8).
3. Results
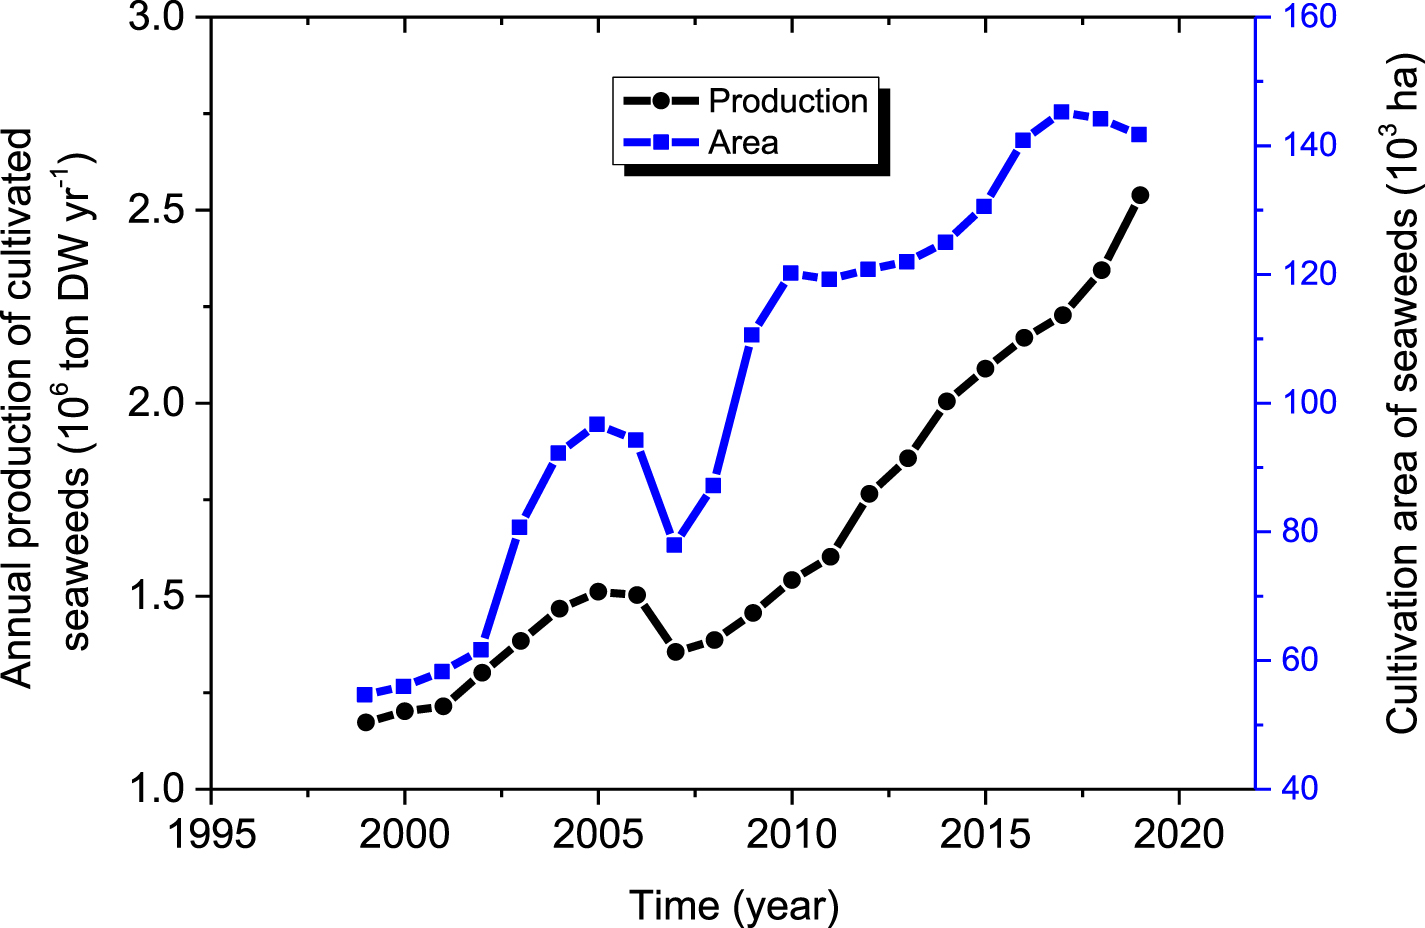
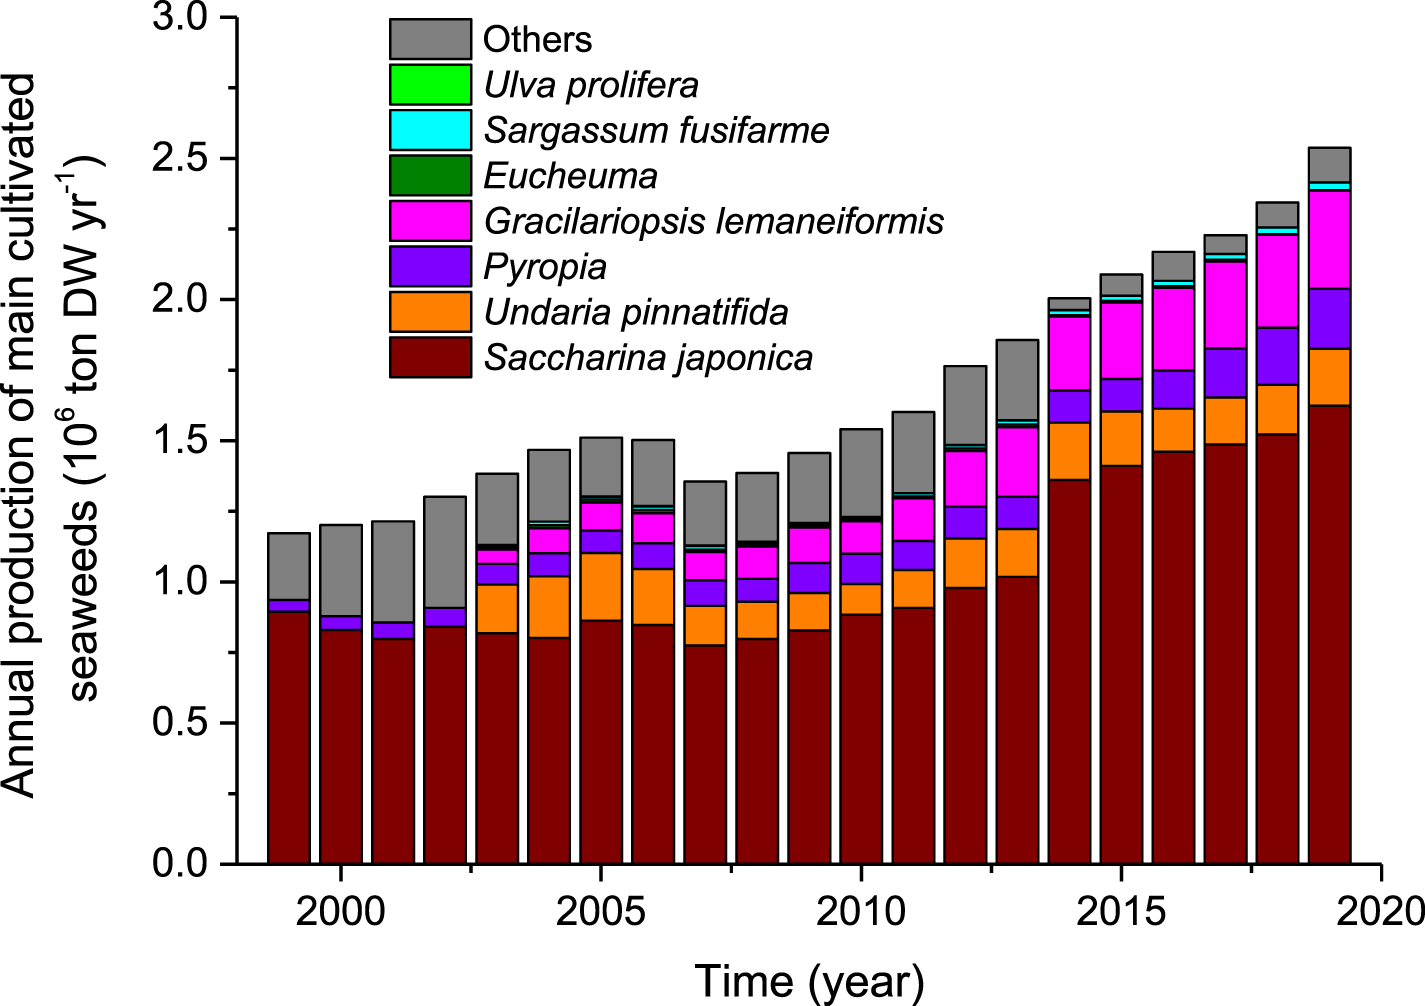
The changes in the production and the area used for cultivating seaweeds in China from 1999 to 2019 were monitored (figure 2). The annual production of cultivated seaweeds in China showed a fast increase trend although there was a decrease in 2007. Overall, the annual production of farmed seaweeds in China more than doubled during the past 21 years. The cultivation area for seaweeds in China also more than doubled during the past 21 years although there were big fluctuations and it has tended to decrease in recent years (figure 2). In terms of specific species or genus farmed in China (figure 3), the annual production of Saccharina japonica maintained a rising trend and ranked number one every year. The annual production of Gracilariopsis lemaneiformis showed a rapid increase and reached 0.35 Mt in 2019, making it the second largest seaweed production. Compared to S. japonica, Pyropia, U. pinnatifida and G. lemaneiformis, the annual production of Eucheuma, Sargassum fusifarme, and Ulva prolifera is very small.
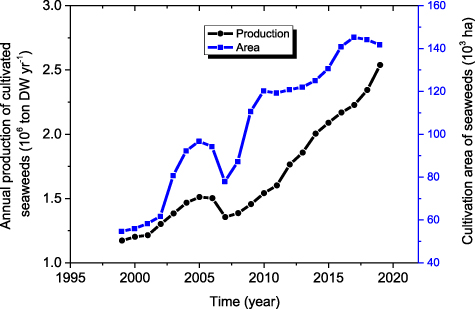
Figure 2. Annual production and area of all cultivated seaweeds in China during the period of 1999–2019.
Download figure:
Standard image High-resolution image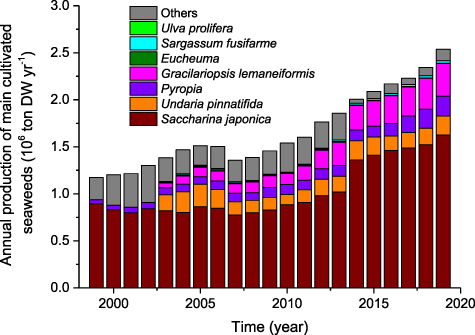
Figure 3. Annual production of main cultivated seaweeds in China during the period of 1999–2019.
Download figure:
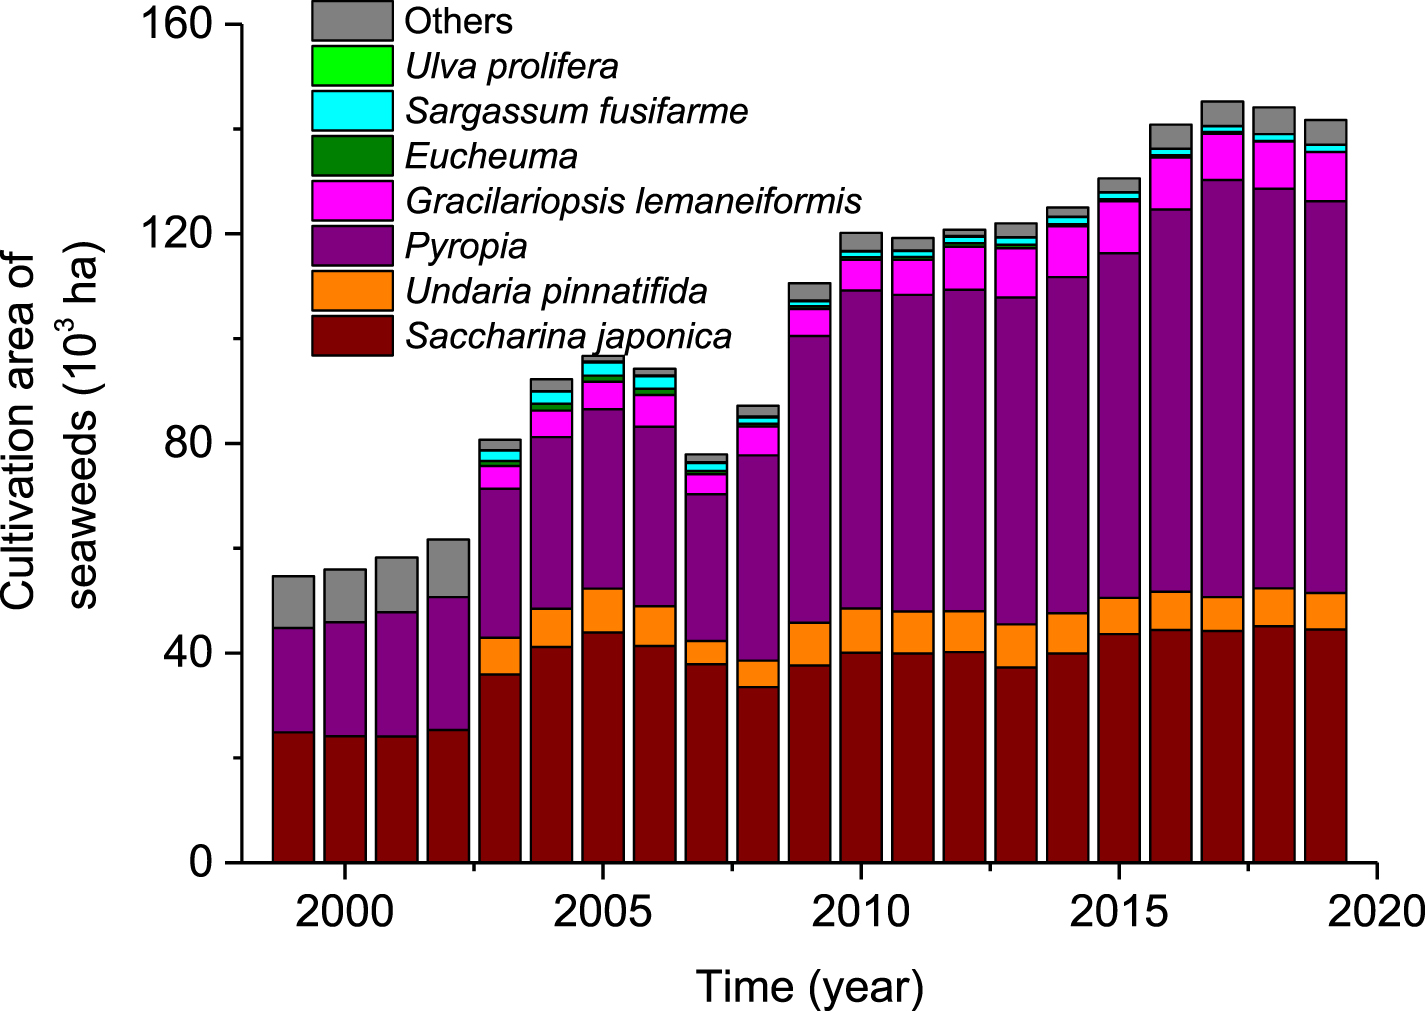
Standard image High-resolution imageCultivation area of S. japonica showed a moderate increase, from 24.86 × 10³ ha in 1999 to 44.49 × 10³ ha in 2019 (figure 4). In contrast, the cultivation area of Pyropia in 2019 is about four times larger than 21 years ago, replacing Saccharina japonica as the largest one. The cultivation area of U. pinnatifida has remained relatively stable during the period in which it has been recorded. The cultivation area of G. lemaneiformis showed a significant increasing trend, from 4.32 × 10³ ha in 2003 to 9.39 × 10³ ha in 2019.
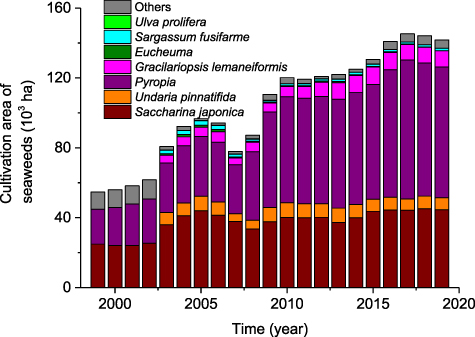
Figure 4. Cultivation area of main cultivated seaweeds in China during the period of 1999–2019.
Download figure:
Standard image High-resolution imageThe annual productivity of S. japonica ranged from 19.46 to 36.50 tonnes DW ha−1yr−1, with the lowest value in 2004 and the highest value in 2019 (figure 5). The annual productivity of U. pinnatifida fluctuated between 12.92 and 30.07 ton DW ha−1yr−1, with the lower productivity occurring between 2009 and 2011. Compared to S. japonica and U. pinnatifida, Pyropia had much lower productivity (1.70–3.23 tonnes DW ha−1yr−1). Differing from the former three seaweeds, the productivity of G. lemaneiformis, Eucheuma and S. fusifarme showed an increasing trend, although there was a sudden decrease for Eucheuma in 2019. The productivity of U. prolifera had a big fluctuation with the minimum of 2.56 tonnes DW ha−1yr−1 in 2014 and the maximum of 17.00 tonnes DW ha−1yr−1 in 2017.
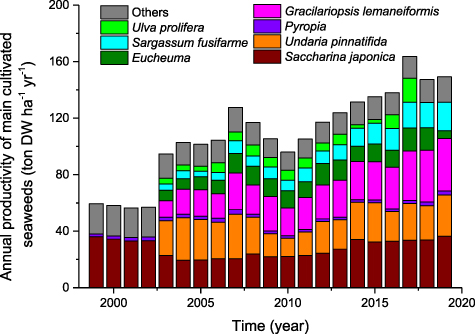
Figure 5. Annual productivity of main cultivated seaweeds in China during the period of 1999–2019.
Download figure:
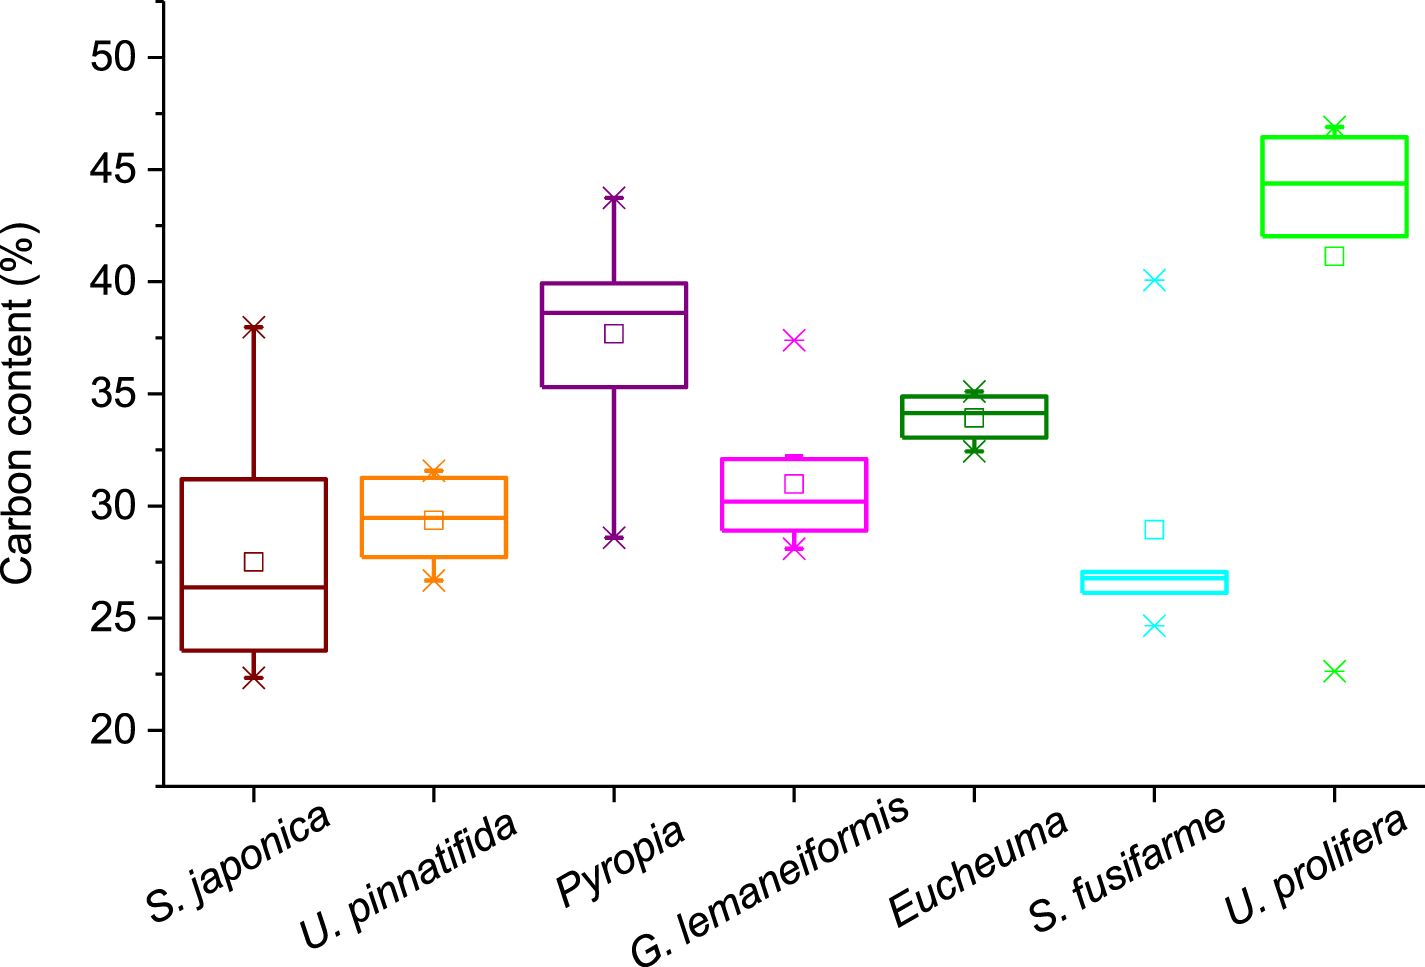
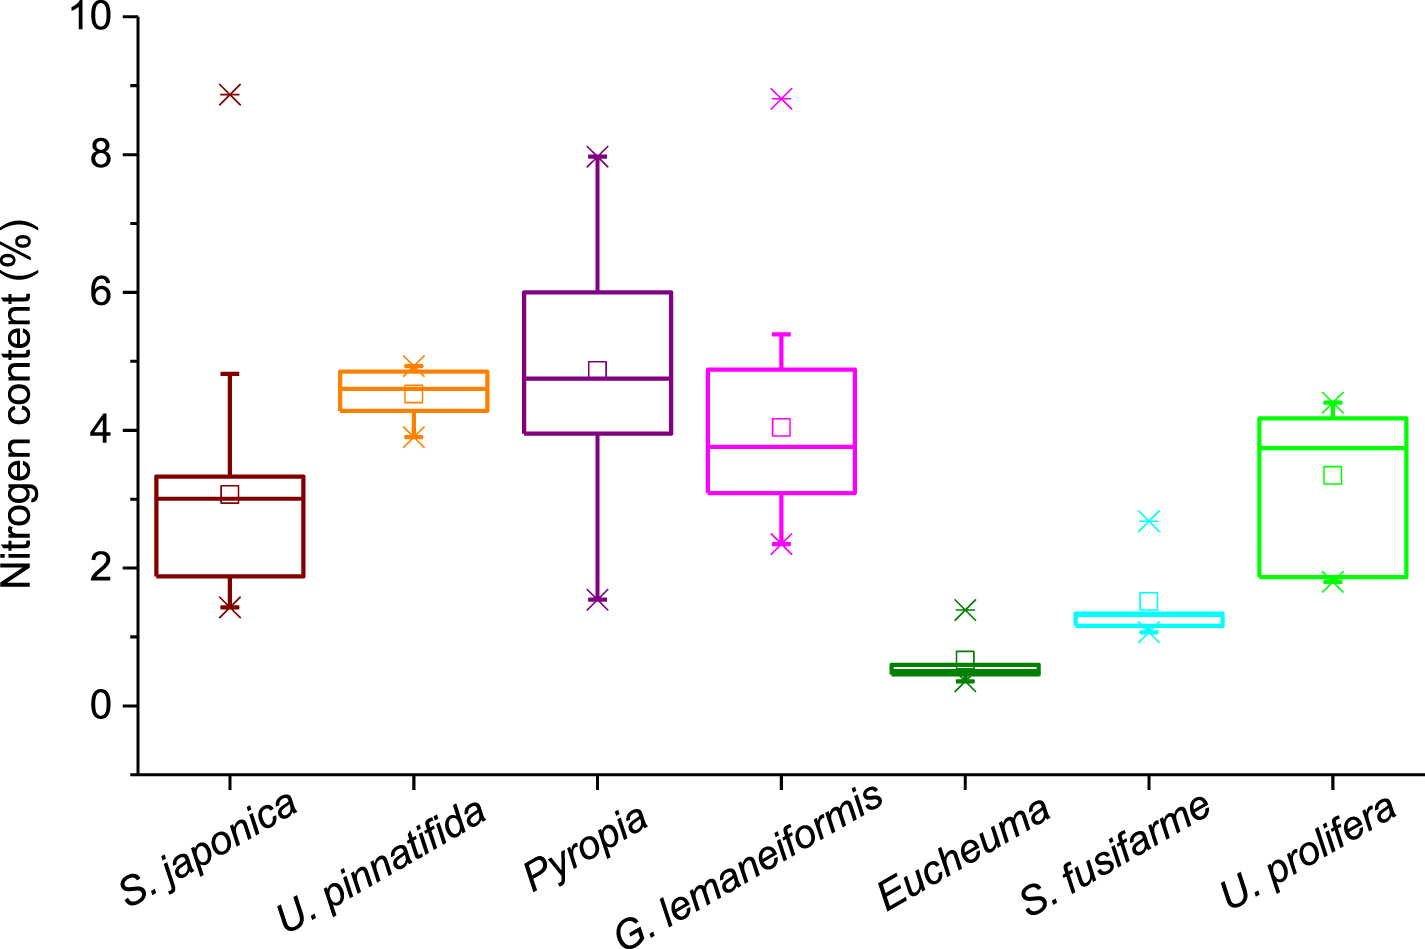
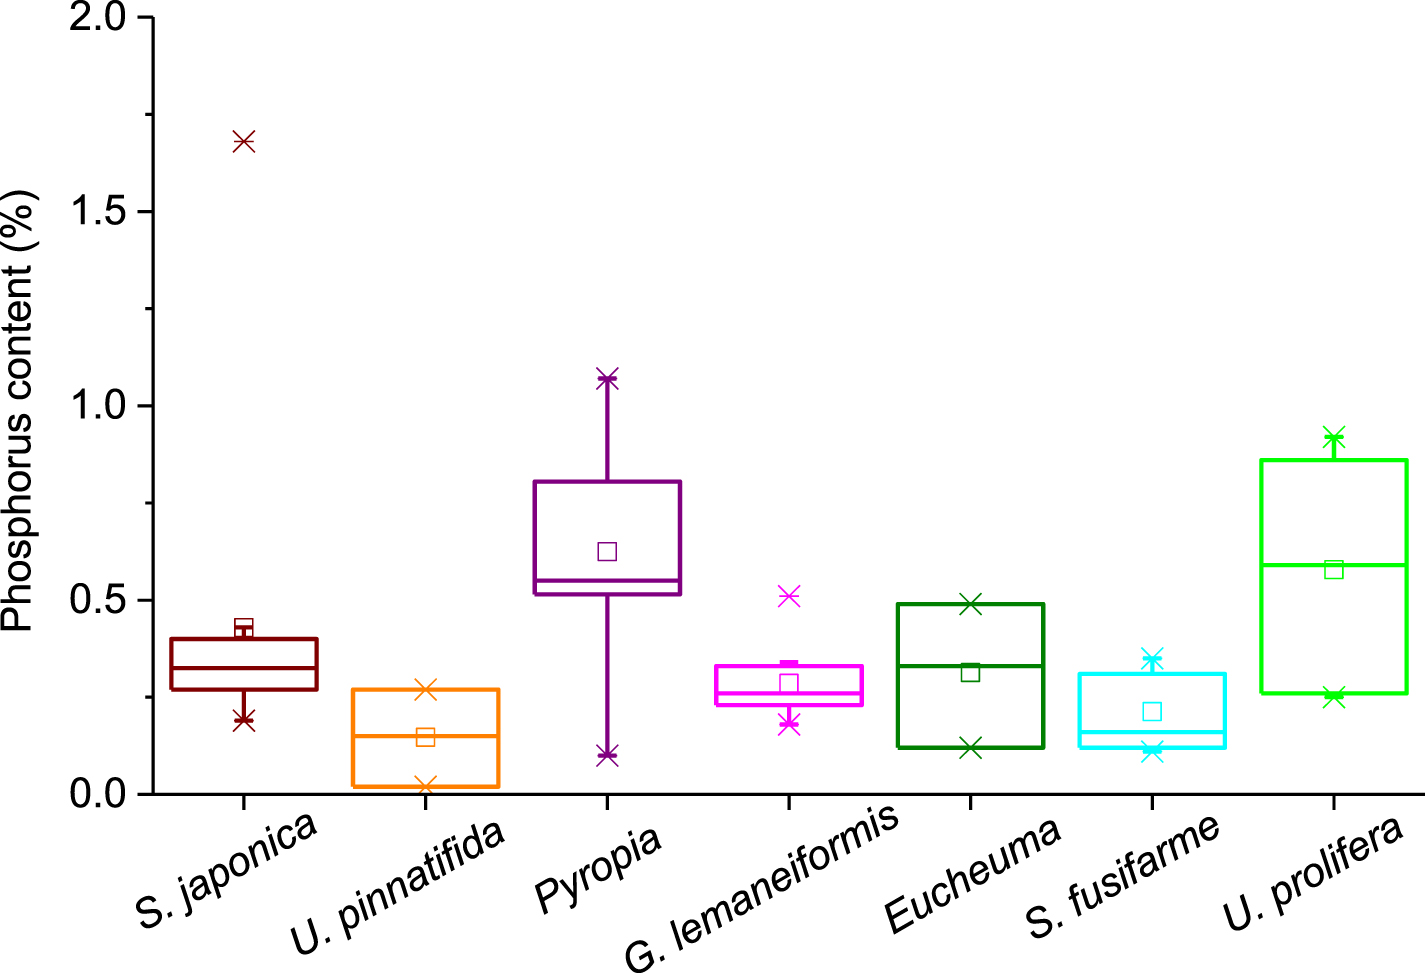
Standard image High-resolution imageThe carbon content of the seven main seaweeds cultivated in China was pooled (figure 6). The range for all seaweeds is 22.34%–46.90%. The lowest and highest contents were found in S. japonica and U. prolifera, respectively. In terms of the median for carbon content, the order is S. japonica (26.38%) < S. fusifarme (26.79%) < U. pinnatifida (29.48%) < G. lemaneiformis (30.20%) < Eucheuma (33.93%) < Pyropia (38.70%) < U. prolifera (44.39%). Seaweeds also had a big range for their nitrogen content (figure 7). It varied from 0.36 to 8.87% and Eucheuma had the lowest value while the highest content was in S. japonica. The order for the median nitrogen content is Eucheuma (0.55%) < S. fusifarme (1.32%) < S. japonica (2.99%) < U. prolifera (3.74%) < G. lemaneiformis (3.76%) < U. pinnatifida (4.60%) < Pyropia (4.78%). The phosphorus content in seaweeds is usually below 1% and S. japonica had an extremum of 1.68% (figure 8). The lowest value (0.02%) was reported in U. pinnatifida. The order for median of phosphorus content is U. pinnatifida (0.15%) < S. fusifarme (0.16%) < G. lemaneiformis (0.26%) < S. japonica (0.325%) < Eucheuma (0.33%) < Pyropia (0.55%) < U. prolifera (0.59%).
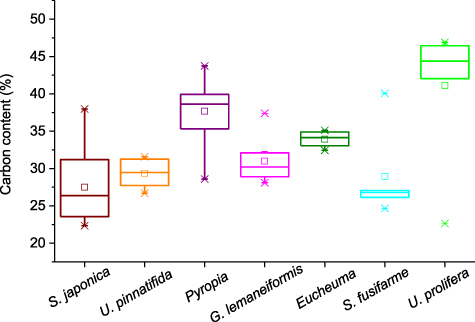
Figure 6. Carbon content of main cultivated seaweeds in China. The sample numbers of S. japonica, U. pinnatifida, Pyropia, G. lemaneiformis, Eucheuma, Sargassum fusifarme, and Ulva prolifera are 13, 6, 54, 9, 5, 5, and 6. Please see table S1 for details.
Download figure:
Standard image High-resolution image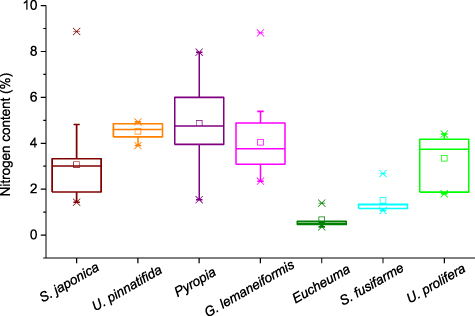
Figure 7. Nitrogen content of main cultivated seaweeds in China. The sample numbers of S. japonica, U. pinnatifida, Pyropia, G. lemaneiformis, Eucheuma, Sargassum fusifarme, and Ulva prolifera are 18, 6, 69, 19, 5, 5, and 7. Please see table S2 for details.
Download figure:
Standard image High-resolution image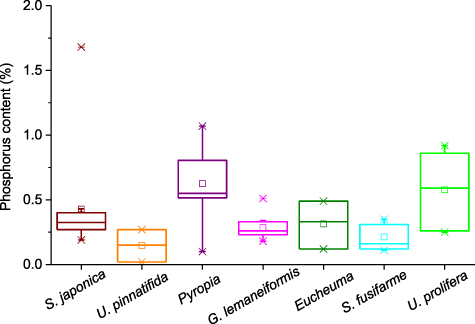
Figure 8. Phosphorus content of main cultivated seaweeds in China. The sample numbers of S. japonica, U. pinnatifida, Pyropia, G. lemaneiformis, Eucheuma, Sargassum fusifarme, and Ulva prolifera are 12, 3, 20, 9, 3, 7, and 6. Please see table S3 for details.
Download figure:
Standard image High-resolution imageTo better present the current status of cultivated seaweeds, the average annual production of farmed seaweeds during 2015–2019 rather than 1999–2019 was used to calculate carbon removal by cultivated seaweeds in China (table 1). S. japonica contributed the largest carbon removal, being 66% of the total amount. The contribution order of seaweeds to oxygen generation is the same as for their carbon removal: Saccharina japonica > G. lemaneiformis > Pyropia> U. pinnatifida > S. fusifarme > Eucheuma > U. prolifera. Compared to carbon removal amount, carbon removal capacity had a different order. G. lemaneiformis had the highest carbon removal capacity, followed by S. japonica and U. pinnatifida. The orders for carbon sequestration capacity and oxygen release capacity were the same as for their carbon removal capacity.
Table 1. Carbon sequestration capacity of seven cultivated seaweeds and required areas to achieve carbon neutrality. Carbon removal means removed carbon by harvested biomass. Carbon seq. means carbon sequestration according to equation (3).
| Species | Carbon content a (%) | Carbon removal (tonne yr−1) | Carbon seq. (tonne yr−1) | Oxygen release (tonne yr−1) | NPP (g C m−2 yr−1) | Carbon removal capacity (tonne ha−1 yr−1) | Carbon seq. capacity (tonne ha−1yr−1) | Oxygen release capacity (tonne ha−1yr−1) | Required area b (107ha) | Required area c (107 ha) |
|---|---|---|---|---|---|---|---|---|---|---|
| S. japonica | 27.51 | 398 486 | 226 351 | 1666 231 | 3119 | 9.17 | 5.21 | 38.35 | 13.09 | 4.74 |
| U. pinnatifida | 30.04 | 53 499 | 30 389 | 223 703 | 2560 | 7.53 | 4.28 | 31.47 | 15.95 | 5.78 |
| Pyropia | 37.68 | 55 795 | 31 693 | 2333 02 | 265 | 0.78 | 0.44 | 3.25 | 154.35 | 55.92 |
| G. lemaneiformis | 30.99 | 90 775 | 51 562 | 379 566 | 3260 | 9.58 | 5.44 | 40.08 | 12.52 | 4.54 |
| Eucheuma | 33.93 | 1483 | 842 | 6201 | 1497 | 4.40 | 2.50 | 18.40 | 27.27 | 9.88 |
| S. fusifarme | 28.95 | 5714 | 3245 | 23 891 | 1546 | 4.55 | 2.58 | 19.01 | 26.41 | 9.57 |
| U. prolifera | 41.13 | 78 | 44 | 327 | 699 | 2.06 | 1.17 | 8.60 | 58.37 | 21.14 |
| Total | 605 830 | 344 128 | 2533 221 |
a Mean values of the data in table S1. b Required area to achieve carbon neutrality based on carbon sequestration capacity. c Required area to achieve carbon neutrality based on carbon sequestration + removal capacity. This was calculated because the carbon in harvested seaweeds can be sequestered if the negative emission technology of BECCS is deployed with seaweeds (Hanssen et al 2020).
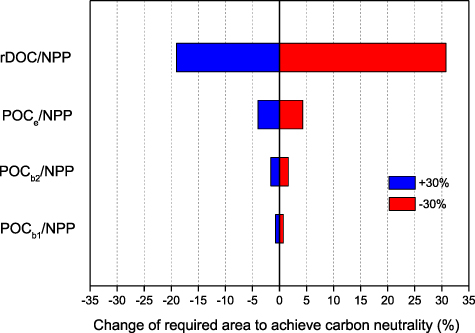
To assess the potential for seaweed cultivation to enable carbon neutrality to be achieved, we calculated the area required to achieve carbon neutrality for China by 2060 (table 1). If this is based on the carbon sequestration capacity, that is to say, harvested seaweeds being excluded, the smallest required area is for G. lemaneiformis cultivation. S. japonica cultivation requires the second smallest area. The largest required area is for Pyropia. When the calculation is based on carbon removal + sequestration capacity, much smaller areas are needed. Sensitivity analysis shows that the change of rDOC/NPP has the largest influence on the required cultivation area, followed by POCe /NPP and POCb 2/NPP, while POCb 1/NPP has the smallest effect (figure 9). For instance, a 30% decrease in rDOC/NPP can lead to a 31% increase in the required cultivation area whereas the same decrease in POCb 1/NPP results in only a 0.7% increase in the required cultivation area.
Figure 9. Sensitivity analysis of required area for seaweed cultivation to achieve China carbon neutrality. Tornado plot demonstrated the extent to which required area changes with ±30% of input parameters. The center line represents the baseline case shown in the section 2.3.
Download figure:
Standard image High-resolution image
The cultivated seaweeds in China removed a large amount of N and P yr−1 during 2015–2019 (table 2). S. japonica contributed most for both N (63.0%) and P removal (73.1%). G. lemaneiformis was second for N removal (16.8%) and third for P removal (10.0%). Pyropia was third for N removal (10.2%) and second for P removal (10.8%). Undaria pinnatifida was fourth for both N (9.6%) and P (5.4%) removal. In terms of N removal capacity, G. lemaneiformis had the highest value, followed by S. japonica and U. pinnatifida, while Eucheuma had the lowest value. S. japonica heads the list for P removal capacity, followed by G. lemaneiformis and U. pinnatifida. Pyropia had the lowest P removal capacity.
Table 2. Nitrogen and phosphorus removal of seven cultivated seaweeds and required areas to bioremdiate fish aquaculture.
| Species | N content a (%) | P content b (%) | N removal (tonne yr−1) | P removal (tonne yr−1) | N removal capacity (tonne ha−1 yr−1) | P removal capacity (tonne ha−1 yr−1) | Required area c (103ha) | Required area d (103 ha) |
|---|---|---|---|---|---|---|---|---|
| S. japonica | 3.07 | 0.43 | 44 469 | 6229 | 1.02 | 0.14 | 132 | 178 |
| U. pinnatifida | 3.80 | 0.26 | 6768 | 463 | 0.95 | 0.07 | 142 | 392 |
| Pyropia | 4.87 | 0.62 | 7211 | 918 | 0.10 | 0.01 | 1348 | 1997 |
| G. lemaneiformis | 4.04 | 0.29 | 11 833 | 849 | 1.25 | 0.09 | 108 | 285 |
| Eucheuma | 0.66 | 0.31 | 29 | 14 | 0.09 | 0.04 | 1583 | 636 |
| S. fusifarme | 1.51 | 0.21 | 298 | 41 | 0.24 | 0.03 | 572 | 775 |
| U. prolifera | 3.35 | 0.58 | 6 | 1 | 0.17 | 0.03 | 809 | 881 |
| Total | 70 615 | 8515 |
a Mean values of the data in table S2. b Mean values of the data in table S3. c Required area to remove N (135 509 tonnes) released by fish mariculture per year. d Required area to remove P (25 553 tonnes) released by fish mariculture per year.
To assess the contribution of seaweed cultivation to alleviating eutrophication, the amount of N and P released by fish mariculture were calculated. Due to the low retention rate (30%) of feed N and P in fish, huge amounts of N (135 509 tonnes) and P (25 553 tonnes) were released into waters annually through fish mariculture, equal to about 9.7% and 1.8% of farmed fish biomass. Seaweed cultivation could offset about half of the N and one-third of the P released by fish mariculture. Therefore, two times more and three times more seaweed production is needed to completely remove N and P released by fish mariculture, respectively. In terms of specific seaweed species, G. lemaneiformis needs the smallest area to completely remove released N and S. japonica needs the smallest area to completely remove released P (table 2).
4. Discussion
4.1. Carbon sequestration and neutrality by seaweed cultivation
Blue carbon plants (mangroves, salt marshes and seagrasses) have a NPP of 817–1100 g C m−2 yr−1 (Duarte et al 2013). Compared to them, wild seaweeds have lower NPP, being in the range 420–750 g C m−2 yr−1 (Duarte et al 2013, Krause-Jensen and Duarte 2016), which may be related to their seasonal fluctuations in biomass. However, this study shows that farmed seaweeds usually have a higher NPP (265–3260 g C m−2 yr−1) compared to wild ones. The NPP of some farmed seaweeds are even higher than those of blue carbon plants. It was reported that Macrocystis pyrifera farmed in the USA had a productivity of 38–62 tonnes DW ha−1 yr−1 (Chynoweth 2002), equal to 1140–1860 g C m−2 yr−1 assuming that the carbon content is 30% DW (Stewart et al 2009). The annual productivity of U. lactuca cultivated in Denmark could achieve 45 ton DW ha−1 yr−1 (Bruhn et al 2011), equal to 2214 g C m−2 yr−1 using the carbon content of 41% DW (table 1). These values are lower than the highest productivity (3260 g C m−2 yr−1 for G. lemaneiformis) shown in the present study. The key reason for a higher NPP in our study is that the calculation includes lost POC and excreted DOC while previous studies exclude these two portions. According to Zhang et al (2012) and Krause-Jensen and Duarte (2016), the lost POC and excreted DOC can account for 47% and 23% of NPP, respectively. Therefore, Macrocystis pyrifera and U. lactuca in previous studies would have higher NPP than seaweeds reported in this study if lost POC and excreted DOC are taken into account. It is worth noting that G. lemaneiformis has the highest NPP among the seven cultivated seaweeds. This may not be due to high net photosynthetic rates since Ulva species have higher growth rates (Gao et al 2016, Ji et al 2019). Therefore, its high NPP could instead be attributed to its year-round cultivation period in some areas of China while U. prolifera is cultivated for only 2–4 months (table S7). On the other hand, the low growth rates (0.63–4.60% d−1) of Eucheuma result in a lower NPP although they are cultivated all year round in China (Liang 2010). Therefore, the NPP of cultivated seaweeds depends on their both growth rate and cultivation period.
In spite of the lower NPP compared to other blue carbon plants, wild seaweeds have a very high total net primary production (173 Tg C yr−1). Despite this, their contribution to blue carbon has been controversial because how much carbon can be sequestration by seaweeds has been uncertain (Macreadie et al 2019). Recently, Ortega et al (2019) confirmed that seaweeds can be exported to the open ocean and the deep sea. Seaweeds can reach to 5000 km from coastal areas worldwide and 24% of seaweeds available at the surface can be transported to the seafloor at a depth of 4000 m, indicating that the carbon fixed by seaweeds can be sequestrated for a long time in the deep ocean. Krause-Jensen and Duarte (2016) evaluated the amount of carbon sequestration by seaweeds as being 173 g C m−2 yr−1, which is much higher than any other blue carbon plant (11–44 g C m−2 yr−1), suggesting the importance of seaweeds in global carbon sequestration.
In terms of farmed seaweeds, it was assessed that an upper limit to the CO2 capture potential of seaweed cultivation can be calculated at 0.68 Tg C per year (Duarte et al 2017). In this study, the total carbon removal of seven farmed seaweeds in China during 2015–2019 is 0.61 Tg year−1. The reason that carbon removal of farmed macroalgae in China has so higher a proportion of the global amount may be due to two aspects. Durate et al (2017) assumed that all of the 27.3 million tonnes of fresh weight farmed in 2014 were dedicated to carbon capture with an average carbon content of 24.8% of dry seaweed and a fresh weight: dry weight ratio of 10. We used the total dry weight of 2.09 million tons recorded by the China Fishery Statistical Yearbook 2016–2020 and the actual carbon content of the seven farmed seaweeds. The average carbon content of seven farmed seaweeds is 32.9% (median of 31.0%), noticeably higher than 24.8%. While, to the best of our knowledge, previous studies focused on short-term carbon fixation and removal, no data has been reported about the amount of long-term carbon sequestration by farmed seaweeds. By integrating previous studies (Wada et al 2008, Zhang et al 2012, Krause-Jensen and Duarte 2016, Watanabe et al 2020), we used the ratio of sequestrated carbon to removed carbon (0.568) by harvested seaweeds to calculate the carbon sequestration of farmed seaweeds. The total carbon sequestration of farmed seaweeds in China is 344 128 tonnes per year. G. lemaneiformis has the highest carbon sequestration capacity and thus requires the smallest area to achieve carbon neutrality, due mainly to its high carbon content and productivity. The required areas for G. lemaneiformis to achieve carbon neutrality based on carbon sequestration and carbon sequestration + removal capacities are 12.52 × 10⁷ and 4.54 × 10⁷ha, respectively. The marine area of China is ∼3 × 10⁸ ha, which means that about one-seventh of Chinese seas will be occupied to achieve carbon neutrality if harvested seaweeds are transformed to recalcitrant carbon or BECCS is deployed. The cultivation area will be further reduced if productivity is enhanced and other NETs are employed. In terms of the availability of suitable cultivation areas, it was reported that the distance to coastline could be as far as 20 km for kelp cultivation in China (Liu et al 2019). Therefore, the rough estimate for a suitable cultivation area is 3.94 × 10⁷ ha if the length of 19.7 × 10³ km is used for the coastline of China (Hou et al 2016), which is less than the required areas for G. lemaneiformis. Therefore, it seems that seaweed cultivation by itself is not enough to achieve the carbon neutrality target of China. Meanwhile, we have to admit that this is a very rough estimate. Although different seaweed species can be cultivated in areas with different temperatures along the coastline in China, seaweed productivity would be inhibited when nutrient availability is low in offshore waters. Therefore, species selection, environmental (temperature, nutrient, currents, etc) and socioeconomic aspects of the sites must be carefully assessed before conducting the cultivation.
The cost for large-scale cultivation is another issue that should be considered. The current cost for kelp cultivation in China is about $85 per tonnes dry weight (Liu et al 2019), which is much higher than the current carbon price of $8–15 per tonnes of CO2. Therefore, it is economically unfeasible to cultivate seaweeds to achieve carbon neutrality without subsidies. An obvious solution is to sell the harvested parts of the seaweeds to cover the cultivation cost. The market price of kelp for food is ∼$3000 per tonne dry weight, but current consumption is only 1.62 × 10⁶ tonnes DW, far less than the 4.32 × 10⁹ ton DW that would be available under our model. A possible solution is therefore to combine its use in food, feed, medicine and biofuel. Bioenergy uses in particular would seem to be hopeful. The use of bio-methane from seaweeds is very close to profitability (Gao et al 2020). Therefore, the combination of low-volume high-value (food, medicine) and high-volume lower-value (biofuel) use could be considered. It is worth noting that climate change and the changes it will bring to seaweed productivity may influence carbon sequestration capacity and the required cultivation areas. Although market demand has been driving the increase in seaweed production and cultivation area, improved techniques and strains contribute to increased productivity for most seaweed species (Ferdouse et al 2018), resulting in a general rising trend during the past 21 years. However, there are different rates of productivity increase for each species, which may be related to environmental changes. It has been documented that climate-driven changes including warming and marine heatwaves have led to a 0.45 Tg C loss of standing stock and a 0.06 Tg C reduction in sequestration annually in Australian kelp forests during the past decades (Filbee-Dexter and Wernberg 2020). On the other hand, ocean acidification increased the biomass yield of Saccharina japonica and Ulva prolifera (Gao et al 2017b, Zhang et al 2021), which may increase the carbon sequestration of these seaweeds. Therefore, the impacts of climate change on the carbon sequestration of seaweeds are complex and need to be further illuminated by future studies.
4.2. Contribution to deoxygenation
Ocean deoxygenation is raising considerable concerns because of its potential ecological impacts on marine ecosystems (Laffoley and Baxter 2019). There are faster deoxygenation rates in coastal seawaters due to the combination of eutrophication and ocean circulation shift (Claret et al 2018). The present study demonstrates that, apart from carbon sequestration, seaweed cultivation also contributes to oxygen enrichment in seawaters. Our study shows that seaweed cultivation generates 2532 221 tonnes oxygen annually, which is equivalent to increasing the dissolved oxygen in aquaculture waters (3 m in depth) by 21% daily if the current dissolved oxygen (DO) level is 8.16 mg L-1 and the gas exchange is excluded. Rising nutrient loads coupled with climate change are causing oxygen decline in the global ocean and coastal waters, impacting processes ranging from biogeochemistry to food security (Breitburg et al 2018). Therefore, it is extremely important to be aware that seaweed cultivation seems to be able to compensate for the DO loss due to ocean warming and supply enough DO for the survival of marine organisms, contributing importantly to the health of the marine ecosystem.
4.3. N and P removal and fish mariculture
Seaweeds are known to be good bioremediators particularly for N and P removal (He et al 2008, Xiao et al 2017). He et al (2008) reported that farmed Porphyra yezoensis in the open sea reduced the concentrations of NH4–N, NO2–N, NO3–N and PO4–P by 50%–94%, 42%–91%, 21%–38% and 42%–67%, respectively and had N and P removal capacities of 0.049 and 0.008 ton ha−1 yr−1. In the present study, the N (0.10 ton ha−1 yr−1) and P (0.01 ton ha−1 yr−1) removal capacity of Pyropia was higher. Apart from different cultivation scales and N and P contents in algal tissues, the gap may be due to different productivity. In the present study, cultivated Pyropia includes both P. haitanensis and P. yezoensis, with P. haitanensis in a dominant position. P. haitanensis has higher growth rates and productivity compared to P. yezoensis (Xu et al 2016). Xiao et al (2017) assessed the nutrient removal of Chinese seaweed cultivation and found approximately 75 000 t nitrogen and 9500 t phosphorus were removed annually from Chinese coastal waters. In this study, it is shown that seven seaweeds remove 70 615 t nitrogen and 8515 t phosphorus annually. The lower values in this study are probably due to lower N and P contents being used since the seaweed production in both studies are very close (2.09 vs 2.00 million t DW). N and P contents in Xiao et al (2017)'s study are based on published data on seaweeds both in China and other countries until December 2015 while our study integrated recent studies by May 2021 and all data are from Chinese seaweeds. For instance, the extremely high P content of 4.87% in Kappaphycus striatus from Indonesia was used in Xiao et al (2017).
Fish aquaculture is a major pollution source because most N and P in the feeds are finally released to the environments (Xu et al 2007, Herath et al 2015). Fish production from mariculture reached 1605 802 tonnes in 2019 in China. To show the bioremediation capacity of farmed seaweeds in China, we compared the N and P removed by farmed seaweeds and released by fish mariculture and calculated the gap for the first time. Although seaweed cultivation could remove a large amount of N and P, it is not enough to offset the N and P released by fish mariculture. One important cause of this is that a considerable proportion of N and P in the feeds is released into the seawater through the decomposition of uneaten feeds and the discharge by fish after digestion (Xu et al 2007, Herath and Satoh 2015). To completely bioremediate the N and P released by fish mariculture, two times and three times higher production of seaweeds than the current one are required, respectively. To reduce fish mariculture or improve the feed utilization efficiency is another approach to solve the gap apart from increasing cultivation area and productivity of seaweeds. Coculturing seaweeds with fish would be an effective way to enhance seaweed productivity and reduce the cultivation area. This study supplies essential data for adjusting aquaculture structure and developing sustainable and green mariculture.
5. Conclusions
To achieve carbon neutrality, it is critical to employ carbon negative technologies apart from reducing CO2 emissions. For the first time, we have assessed the potential of seaweed cultivation to contribute to carbon neutrality. Long-term carbon sequestration is distinguished from short-term carbon fixation and removal. We found that offshore seaweed cultivation could play an important role in achieving carbon neutrality target of China, particularly using the species of G. lemaneiformis and S. japonica, although other carbon negative technologies must be employed at the same time. In addition, seaweed cultivation has shown its potential in mitigating deoxygenation and eutrophication. More species that could be cultivated in summer are needed to be identified or obtained through genetic engineering in future studies because the extension of the cultivation period in summer could significantly enhance the annual productivity of seaweeds and thus their capacities for C, N and P removal (Hwang et al 2019). Offshore cultivation techniques need to be improved in China, as well as in other areas in the world, and meanwhile species selection, environmental constraints and cultivation costs must be carefully assessed.
Acknowledgments
This work was supported by the National Key Research and Development Program of China (2018YFD0900703), the National Natural Science Foundation of China (42076154), the Fundamental Research Funds for the Central Universities (20720200111), and the MEL Internal Research Program (MELRI2004). We thank Dr Yahe Li for collecting seaweeds and Bill Gibson for his help in language.
Data availability statement
All data that support the findings of this study are included within the article (and any supplementary files).