

Abstract
Since 2013, China has taken a series of actions to relieve serious PM2.5 pollution. As a result, the annual PM2.5 concentration decreased by more than 50% from 2013 to 2021. However, ozone pollution has become more pronounced, especially in the North China Plain. Here, we review the impacts of anthropogenic emissions, meteorology, and atmospheric processes on ambient PM2.5 loading and components and O3 pollution in China. The reported influence of interannual meteorological changes on PM2.5 and O3 pollution during 2013–2019 ranged from 10%–20% and 20%–40%, respectively. During the same period, the anthropogenic emissions of NOx, SO2, primary PM2.5, NMVOC and NH3 are estimated to decrease by 38%, 51%, 35%, 11% and 17%, respectively. Such emission reduction is the main cause for the decrease in PM2.5 concentration across China. However, the imbalanced reductions in various precursors also result in the variation in nitrate gas-particle partitioning and hence an increase in the nitrate fraction in PM2.5. The increase of ozone concentration and the enhancement of atmospheric oxidation capacity can also have substantial impact on the secondary components of PM2.5, which partly explained the growth of organic aerosols during haze events and the COVID-19 shutdown period. The uneven reduction in NOx and NMVOC is suggested to be the most important reason for the rapid O3 increase after 2013. In addition, the decrease in PM2.5 may also have affected O3 formation via radiation effects and heterogeneous reactions. Moreover, climate change is expected to influence both anthropogenic emissions and atmospheric processes. However, the extent and pathways of the PM2.5-O3 interplay and how it will be impacted by the changing emission and atmospheric conditions making the synergetic control of PM2.5 and O3 difficult. Further research on the interaction of PM2.5 and O3 is needed to provide basis for a scientifically-grounded and effective co-control strategy.
Export citation and abstract BibTeX RIS

Original content from this work may be used under the terms of the Creative Commons Attribution 4.0 license. Any further distribution of this work must maintain attribution to the author(s) and the title of the work, journal citation and DOI.
1. Introduction
Through efforts in recent years, China has made significant advances in alleviating fine particulate matter (PM2.5) pollution (Wang et al 2017a, Zheng et al 2018, Zhou et al 2021). According to observational data, the PM2.5 concentration decreased by more than 50% from 2013 to 2021 (Bulletin of China Ecological Environment 2013 and Bulletin of China Ecological Environment 2021, available on www.mee.gov.cn/hjzl/sthjzk/zghjzkgb/, in Chinese). However, ozone concentration has shown an increasing trend. According to Lu et al (2020), the proportion of sites with mean daily maximum 8-h average (MDA8) O3 concentration during the warm season (April–September) over 60 ppb increased from 11.1% in 2013 to 49.2% in 2019. The synergistic control of PM2.5 and ozone pollution in China has become a major challenge and subject of high research interest. In the past few years, the number of articles on this topic has steadily increased. The number of related articles published in 2021 (569 articles) is more than five times that in 2013 (104 articles) according to the search results on the Web of Science with theme as ['PM2.5' or 'particle' or 'aerosol', 'O3' or 'ozone', and 'China'] (as of 10th March 2022). Some studies have focused on the trends and characteristics of PM2.5 and O3 pollution (Chu et al 2020, Kuerban et al 2020, Wei et al 2021a). More has attempted to explain the change in terms of variations in atmospheric processes and anthropogenic emissions. Numerical model analysis found that the contribution of interannual meteorological changes was 10%–20% and 20%–40% for PM2.5 and O3, respectively (Ding et al 2019b, Chen et al 2020b, Li et al 2020a). The impacts of anthropogenic emissions changes are greater but more complex (Zhang et al 2019b, Wang et al 2020b, 2021a). The changes in precursor emissions not only changed the PM2.5 and O3 concentrations, but also affected the chemical composition of PM2.5 as well as the interactions between PM2.5 and O3. Previous reviews have mostly focused on PM2.5 or O3 (Wang et al 2017b, An et al 2019, Lu et al 2019a, Chen et al 2020e), but neglected the synergistic effects between the two pollutants. It is necessary and imperative to summarize the current understanding of how the synergy in anthropogenic emissions and atmospheric processes affects PM2.5 and O3 pollution, and provide ground for scientifically-informed air pollution control policymaking.
In this article, we first briefly review the spatial and temporal characteristics of PM2.5 and O3 pollution and the correlation between PM2.5 and O3 concentrations in China based on literature review and observation data analysis. Next, we review the synergistic effects between PM2.5 and O3 as influenced by three different factors: (a) the impact of anthropogenic emissions; (b) the interaction between PM2.5 and O3 through atmospheric processes; (c) the impact of climate change.
2. Methods
2.1. Data source and processing
This review is mainly based on two sets of data:
- (a)The surface observation data of PM2.5 and O3 in China from 2013 to 2021
We obtained the surface observation data from the China National Environmental Monitoring Center network (https://air.cnemc.cn:18 007/). Data processing of PM2.5 and O3 concentration was conducted according to National Ambient Air Quality Standards (GB3095-2012) (available on www.mee.gov.cn/ywgz/fgbz/bz/bzwb/dqhjbh/dqhjzlbz/201 203/W020120410330232398521.pdf, in Chinese) and China's Technical Regulation for Ambient Air Quality Assessment (tentative) (HJ 633-2013) (available on www.mee.gov.cn/ywgz/fgbz/bz/bzwb/jcffbz/201 309/W020131105548549111863.pdf, in Chinese). It should be noted here the standard state data were used before 2019, and the actual state data were used starting in 2019 for the assessment of ambient air quality. The O3 concentration depended significantly on this modification. We multiplied the O3 observation data for 2019, 2020, and 2021 by 1.09 for consistent conversion (1.09 was calculated according to difference between the Bulletin of China Ecological Environment 2019 and Bulletin of China Ecological Environment 2018, available on www.mee.gov.cn/hjzl/sthjzk/zghjzkgb/, in Chinese).
- (b)The anthropogenic air pollutants emissions inventory of China
We obtained anthropogenic air pollutants emissions data from five databases, including ABaCAS-EI (Zhao et al 2013, Wang et al 2014, Cai et al 2017, Zheng et al 2019; www.abacas-dss.com/abacas/), Community Emissions Data System (CEDS, O'Rourke et al 2021), Emissions Database for Global Atmospheric Research (EDGARv5.0, https://edgar.jrc.ec.europa.eu/overview.php?v=50_AP), Multi-resolution Emission Inventory for China (MEIC, Zheng et al 2018, 2021; http://meicmodel.org/?page_id=560), and Regional Emission inventory in Asia (REASv3.1, Kurokawa and Ohara 2020). ABaCAS-EI and MEIC also provided the emissions data of each province in China.
2.2. Literature search and selection strategy
The literature cited in this study was obtained by searching in the Web of Science (www.webofscience.com/) database. The latest search date is 10 June 2022. The search terms are included in table S1 of the supplementary materials. We need to uncover suitable literature from many research domains because just a few papers have provided a thorough grasp of the synergy between PM2.5 and O3. When choosing the literature, we followed the following rules: (a) literature which receives a lot of citations or is extensively discussed; (b) literature which focuses on China or typical locations; and (c) literature that proposes novel phenomena and arguments for their explanations. Additionally, in order to track the most recent advancements in adjacent fields of research, we primarily focused on literature released after 2017 (152 references). Also a number of classic works of literature released before 2017 are included (18 references).
3. PM2.5 and O3 pollution across China
3.1. Spatial and temporal distribution of PM2.5 and O3
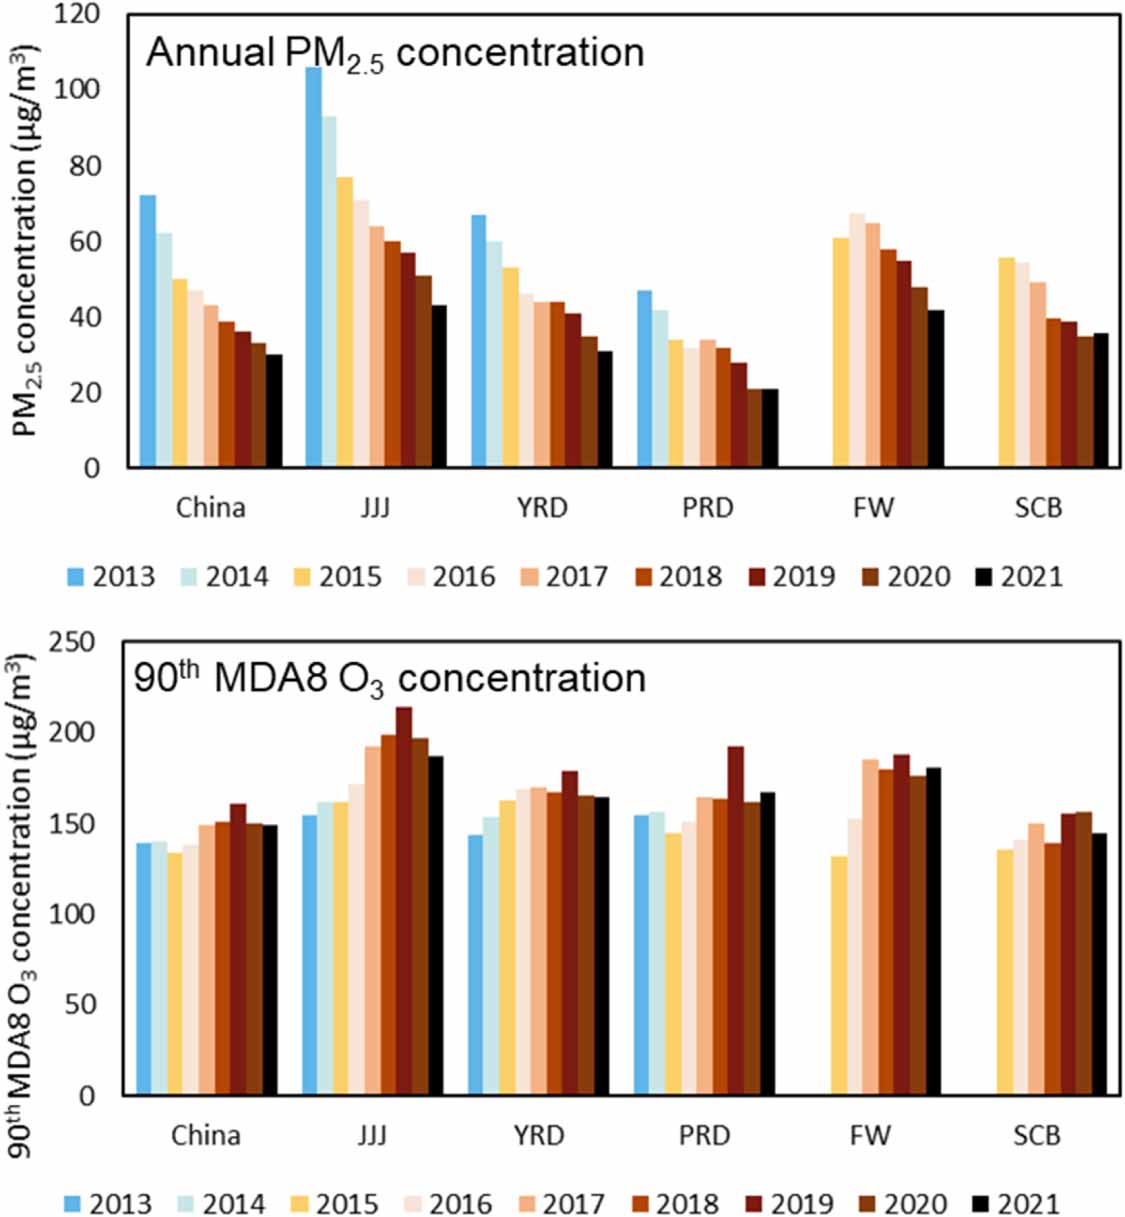
Based on air quality observation data in China, we analyzed spatial and temporal distribution of PM2.5 and O3 from 2013 to 2021. Annual evaluation values of PM2.5 (average PM2.5 concentration in one year) and O3 (the 90th percentile of daily maximum 8-hour average O3 in one year) in China and five key regions are shown in figure 1 (annual evaluation values of PM2.5 and O3 of all sites are shown in figure S1 in supplementary materials).
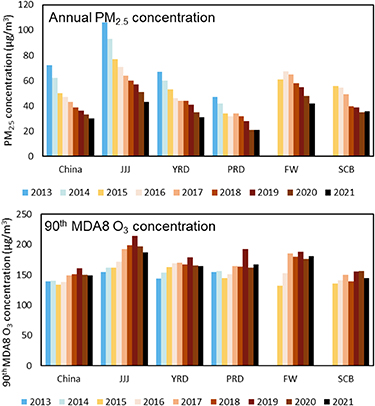
Figure 1. Annual evaluation values of PM2.5 (average PM2.5 concentration in one year) and O3 (the 90th percentile of daily maximum 8-hour average O3 in one year) in China and five key regions from 2013 to 2021. Here, observation data of some cities in FW and SCB are absent in 2013 and 2014.
Download figure:
Standard image High-resolution imageGenerally, the annual PM2.5 concentration in China continuously decreased from 72 μg·m−3 to 30 μg·m−3 from 2013 to 2021. The annual PM2.5 concentrations of the Jing-Jin-Ji (JJJ), the Yangtze River Delta (YRD) and the Pearl River Delta (PRD) regions decreased by 63 μg·m−3 (59%), 36 μg·m−3 (54%), and 26 μg·m−3 (55%), respectively. The annual PM2.5 concentrations in Beijing, Shanghai and Guangzhou all met the national standard level 2 in 2021, according to the National Air Quality Standards (GB3095-2012). The spatial pattern of PM2.5 is remained similar from 2013 to 2021, with higher PM2.5 concentrations in eastern and northern China and lower PM2.5 concentrations in western and southern China (Wang et al 2017a, Xu et al 2020). The North China Plain (NCP) is typically a polluted region in China. Seasonal variation of PM2.5 has been described in many previous studies (Zhao et al 2016, Li et al 2017c, Chen et al 2018, Zhao et al 2018, Ye et al 2018b, Ma et al 2019b). As shown in figure 2(a), PM2.5 is higher in winter and lower in summer. During 2013–2021, the averaged PM2.5 concentration in winter was 2–3 times that in summer in China. In spring and autumn, the PM2.5 concentration has different variation characteristics for different regions. In JJJ, the Fenwei Plain (FW) and the PRD, PM2.5 in autumn is typically higher than that in spring, while the trends in the YRD and Sichuan Basin (SCB) are the opposite, as shown in figure S2 in the supplementary materials.
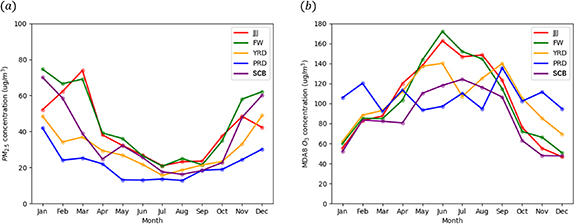
Figure 2. Monthly (a) averaged PM2.5 and (b) MDA8 O3 concentrations in JJJ, YRD, PRD, FW and SCB in 2021.
Download figure:
Standard image High-resolution imageFor O3, as shown in figure 1, the 90th MDA8 O3 in China, JJJ, YRD, PRD, and FW were the highest in 2019. The highest 90th MDA8 O3 in SCB appeared in 2020. Compared with 2013, the 90th MDA8 O3 in 2019 in JJJ, YRD, and PRD increased by 59 μg·m−3 (38%), 35 μg·m−3 (24%), and 37 μg·m−3 (24%), respectively. In terms of spatial distribution, eastern China is more polluted than western China, which is similar to the spatial distribution of PM2.5. Due to higher volatile organic compounds (VOCs) emissions and stronger radiation, O3 is higher in the warm season (Zhang et al 2015, Cheng et al 2017, Wang et al 2018, Yang et al 2020). Figure 2(b) shows the monthly averaged MDA8 O3 concentrations of JJJ, YRD, PRD, FW and SCB in 2021. For JJJ and FW, the peak of monthly averaged MDA8 O3 appears in June. For SCB, O3 is highest in July or August. For YRD, O3 is the highest in June or September. PRD has a distinct pattern, with the highest O3 in September or October. Thus, the warm season of China is usually considered to be April to September or April to October.
3.2. Correlation between PM2.5 and O3 pollution
Many studies have analyzed the correlation between PM2.5 and O3 by calculating the Pearson correlation coefficients based on monitoring data, as shown in table 1. From the spatial distribution, as pointed out in many studies, PM2.5 and O3 tend to be negatively correlated in North China and positively correlated in South China. In addition, Chen et al (2019a) found that PM2.5 and O3 in coastal areas tend to be positively correlated but negatively correlated in inland areas. In this study, we also analyzed the correlation between the daily PM2.5 and MDA8 O3 concentrations in JJJ, YRD, PRD, FW and SCB in 2021, as shown in figures S3 and S4 (remove seasonal cycle of PM2.5 and O3). It can be seen that the correlation between PM2.5 and O3 is more positive in PRD than in other regions, which is consistent with the conclusion above. From the temporal characterization, there is an obvious seasonal variation in that PM2.5 and O3 tend to be more positively correlated in the summer but tend to be more negatively correlated in the winter, as shown in both previous studies and our results. The daily variation shows that the peak value of the Pearson correlation coefficient appears at approximately 16:00 (Chen et al 2019a).
Table 1. Summary of studies on the Pearson correlation coefficient between PM2.5 and O3 over China.
| Region | Data | Period | Pearson correlation coefficient | References |
|---|---|---|---|---|
| China | Hourly and daily PM2.5 and O3 concentration | 1 March 2013–28 February 2017 | Lower in the northwestern China; higher in the southeastern China Negative in the winter; Positive in the summer Lower at around 10:00; Higher at around 16:00 | Chen et al (2019a) |
| China | Daily PM2.5 and MDA8 O3 | 2013–2018 | Generally positive across NCP, YRD, PRD and SCB | Li et al (2019c) |
| China | Daily PM2.5 and MDA8 O3 | 2016 | Strong negative in Northern China during January; Strong positive in Southern China during July | Zhu et al (2019) |
| China | Hourly PM2.5 and O3 concentration | 2013–2018 | Negative in the North; Positive in the South −0.13, −0.21, −0.14, and 0.13 for China, JJJ, YRD and PRD, respectively | Chu et al (2020) |
| NCP | Monthly PM2.5 and O3 concentration | 2016-early 2019 | −0.6389 | Tian et al (2020) |
| YRD | Daily PM2.5 and MDA8 O3 | April–October in 2013–2019 | 0.2–0.6 | Dai et al (2021) |
| YRD (Shanghai, Nanjing) | Daily PM2.5 and MDA8 O3 | January, April, July and October in 2017 | Independent when AOC | Qin et al (2022) |
| PRD | Monthly PM2.5 and O3 concentration | 2006–2019 | −0.02 on average; −0.21, 0.38, −0.16 and −0.01 for spring, summer, autumn and winter, respectively | Hu et al (2021) |
| Lanzhou | Daily PM2.5 and O3 concentration | Spring-summer period in 2014–2017 | −0.335 | Filonchyk et al (2018) |
The secondary generation of PM2.5 and O3 is the key to explain the spatial-temporal variation of PM2.5 and O3 correlations. Qin et al (2022) associated atmospheric oxidizing capacity (AOC) with the correlation between PM2.5 and O3 in YRD. They found that the daily PM2.5 and O3 were highly correlated at moderate to high AOC levels. The promoted formation of secondary pollutants by AOC is the main reason (Liu et al 2020, Zhu et al 2020, Chen et al 2020c, Wang et al 2022a). We analyzed the correlation between daily Ox (O3 + NO2) and PM2.5 (figure S5). The result showed that Ox and PM2.5 is positively correlated in almost all key regions and seasons in 2021, indicating promoted production of secondary components of PM2.5 by AOC. Chu et al (2020) suggested that the correlation between PM2.5 and O3 would become positive with the decrease of PM2.5 in China due to the influence of PM2.5 on solar radiation and heterogeneous reactions of HO2. In summer or south China, where PM2.5 concentration is relatively low, PM2.5 has little impact on solar irradiation and HO2 radicals, thus PM2.5 and O3 tend to have a positive correlation with secondary generation from NOx and VOCs emissions. Chen et al (2019a) suggested similar causes for regional differences. Besides, they reported the climate and meteorological conditions would cause the regional differences by influencing the formation and removal of PM2.5 and O3. Lei et al (2022) revealed that the Spearman correlation coefficients between PM2.5 and O3 in key regions (JJJ, YRD, PRD, SCB and FW) were much higher in 2020 than in 2019. They emphasized the urgent demand for the co-control of PM2.5 and O3 as the primary emissions decreased steadily. We therefore discuss the synergy of PM2.5 and O3 as influenced by three factors: (a) the impact of emissions; (b) interactions between the two pollutants; (c) future challenges under climate change in the following sections.
4. Changes of anthropogenic emissions and their influence on PM2.5 and O3
4.1. Anthropogenic emissions change in China
A large number of studies have been conducted to analyze the emission changes in China in recent years. Researchers have provided detailed reviews of both pollutants separated and sectors separated emissions (Wang et al 2014, Li et al 2017b, Li et al 2021a); thus, we briefly discuss the emissions change to provide support for later sections. Figure 3 shows the emission trends of SO2, primary PM2.5, NOx , non-methane volatile organic compounds (NMVOC), and NH3 from different studies and databases (Zhao et al 2013, Wang et al 2014, Crippa et al 2018, Zheng et al 2018, 2019, Kurokawa and Ohara 2020, O'Rourke et al 2021, Zheng et al 2021). The trends of SO2 emissions and PM2.5 emissions were similar. From 2000 to 2005, SO2 emissions and PM2.5 emissions increased by 32%–70% (EDGARv5.0, REASv3.1, CEDS) and 15%–21% (EDGARv5.0, REASv3.1), respectively, and then decreased from 2006 to 2010. Wide application of flue-gas desulfurization devices and end-of-pipe dust collectors in power plants is reported as one of the most effective measures (Lu et al 2010, Li et al 2017b). Small increases of SO2 and PM2.5 emissions appeared from 2011 to 2013. After 2013, SO2 and PM2.5 emissions decreased rapidly as a result of the implementation of the 'Air Pollution Prevention and Control Action Plan' (Cai et al 2017, Zheng et al 2019). Pollutant control strategies in industry, including strengthening industrial emission standards and removing pollutant emissions, were recognized as the main drivers of this reduction (Zheng et al 2018, Zhang et al 2019b). NOx emissions increased by 80%–128% (EDGARv5.0, REASv3.1, CEDS) from 2000 to 2013. From 2013 to 2017, rapid implementation of an effective NOx emissions control strategy (e.g. application of selective catalytic reduction (SCR) and selective non-catalytic reduction (SNCR) in power plants and industry) caused a 20%–37% (ABaCAS-EI, MEIC, CEDS) decrease of NOx emissions in China. However, the emissions of NMVOC increased slowly and NH3 emissions were stable from 2000 to 2017, due to the lack of effective control policies.
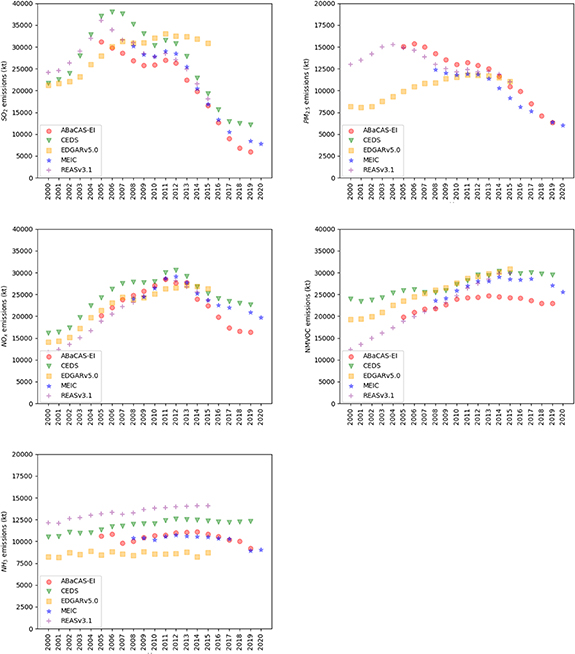
Figure 3. Emission trends of SO2, primary PM2.5, NOx , NMVOC and NH3 from 2000 to 2020 according to different studies and databases.
Download figure:
Standard image High-resolution imageHerein, we also analyzed the emissions variation in key regions from ABaCAS-EI, as shown in figure 4. Compared to 2007, the trends of SO2 and primary PM2.5 were consistent in different regions, decreasing by 73%–88% and 57%–73% in 2019, respectively. However, the emissions of NOx were highest in 2013 in all 5 regions. Compared to 2013, the emissions of NOx in JJJ, YRD, PRD, FW and SCB decreased by 42%, 41%, 27%, 52%, and 33%, respectively, in 2019. In contrast, the emissions of NMVOC varied less from 2013 to 2019, by −33%, −6%, −5%, −10% and +5% in JJJ, YRD, PRD, FW, and SCB, respectively. The emission of NH3 was more stable from 2007 to 2019.
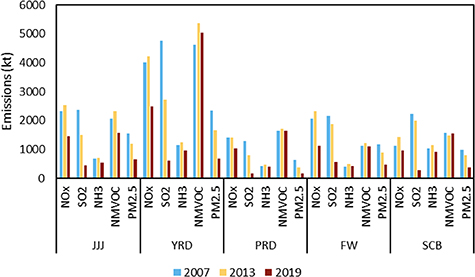
Figure 4. Emissions of NOx, SO2, NH3, NMVOC and primary PM2.5 in key regions.
Download figure:
Standard image High-resolution image4.2. Anthropogenic emissions driven PM2.5 change
As listed in table 2, the changes of anthropogenic emissions is the major driver of PM2.5 change in recent years in China. Ding et al (2019b) revealed that the variation of anthropogenic emissions contributed 70.8%, 95.6% and 99.7% to the total decrease of annual PM2.5 concentration in JJJ, Guangdong and Sichuan-Chongqing region from 2013 to 2017. Control measures on industry were evaluated as the largest source of PM2.5 decline across China, which was consistent with the anthropogenic emissions change (Zheng et al 2019, Cheng et al 2019a, Zhang et al 2019b).
Table 2. Summary of studies on drivers of PM2.5 and O3 variation.
| Period | Pollutants | Pollutants changes (if provided) | References | |
|---|---|---|---|---|
| Impact of anthropogenic emissions | Impact of meteorological conditions | |||
| 2013–2017 | PM2.5 | 70.8% of PM2.5 decrease in JJJ 95.6% of PM2.5 decrease in Guangdong 99.7% of PM2.5 decrease in Sichuan-Chongqing | Ding et al (2019b) | |
| 2013–2018 | PM2.5 | −4.6 μg·m−3·a−1 across China −8.0 ± 1.1 μg·m−3·a−1 in JJJ −6.3 ± 0.9 μg·m−3·a−1 in YRD −2.2 ± 0.5 μg·m−3·a−1 in PRD −4.9 ± 0.9 μg·m−3·a−1 in SCB −5.0 ± 1.9 μg·m−3·a−1 in FW | Zhai et al (2019) | |
| 2013–2017 | PM2.5 | −18.1 μg·m−3 in China −28.7 μg·m−3 in JJJ −18.6 μg·m−3 in YRD −8.9 μg·m−3 in PRD | Zhang et al (2019b) | |
| 2013–2017 | PM2.5 | 87.9% of PM2.5 decrease in Beijing (local emissions reduction contributed 65.4%) | Cheng et al (2019a) | |
| 2014–2017 | PM2.5 | More than 70% of PM2.5 decrease in JJJ | Dong et al (2020) | |
| 2013–2015 | PM2.5 | −23.9 μg·m−3 in 2014 in 31 capital cities in China −43.5 μg·m−3 in 2015 in 31 capital cities in China | +11.5 μg·m−3 in 2014 in 31 capital cities in China +24.6 μg·m−3 in 2015 in 31 capital cities in China | Wang et al (2019c) |
| O3 in summer | +16.7 ppb in 2014 in 31 capital cities in China +18.3 ppb in 2015 in 31 capital cities in China | |||
| 2014–2018 | PM2.5 | −23.5 μg·m−3 in NCP −18.0 μg·m−3 in YRD −18.4 μg·m−3 in FW | −8.7 μg·m−3 in NCP −2.6 μg·m−3 in YRD −3.5 μg·m−3 in FW | Chen et al (2020b) |
| O3 | +13.6 μg·m−3 in NCP +11.2 μg·m−3 in YRD +22.1 μg·m−3 in FW | +1.8 μg·m−3 in NCP +1.3 μg·m−3 in YRD +3.8 μg·m−3 in FW | ||
| 2013–2017 | O3 in warm season | +2.1 ± 1.0 ppb in North China +2.2 ± 0.8 ppb in North-east China +2.6 ± 1.2 ppb in East China +2.7 ± 0.7 ppb in Central China +1.5 ± 1.0 ppb in South China +0.9 ± 1.3 ppb in South-west China +1.1 ± 0.9 ppb in North-west China | +0.2 ± 1.1 ppb in North China +0.3 ± 0.8 ppb in North-east China +2.0 ± 1.7 ppb in East China +0.5 ± 1.5 ppb in South China | Ding et al (2019a) |
| 2013–2017 | O3 in summer | +1–3 ppbv·a−1 in megacity clusters of eastern China (Rapid decrease PM2.5 was the major factor by slowing down the uptake of HO2 radicals) | Li et al (2019b) | |
| 2003–2015 | O3 in July | +3.5 ± 1.4 ppbv over the central part of central eastern China +5.6 ± 1.8 ppbv over the eastern part of central eastern China | +5.8 ± 3.9 ppbv over the central part of central eastern China −0.8 ± 3.5 ppbv over the eastern part of central eastern China | Sun et al (2019) |
| 2005–2016 | O3 | Large decrease of PM2.5 in Beijing was the main driver of increased O3 production. | Wang et al (2020a) | |
| 2013–2019 | O3 in summer | +1.2 ppb·a−1 in China +1.9 ppb·a−1 in NCP +0.9 ppb·a−1 in YRD +0.3 ppb·a−1 in PRD +1.0 ppb·a−1 in SCB | +0.7 ppb·a−1 in China +1.4 ppb·a−1 in NCP +0.7 ppb·a−1 in YRD +0.8 ppb·a−1 in PRD −0.2 ppb·a−1 in SCB | Li et al (2020a) |
| 2013–2017 | O3 in summer | Increase ozone (∼2 ppbv) in urban areas Decrease ozone (<1 ppbv) in rural areas +8 ppbv in Beijing and Shanghai in 2017 +5 ppbv in Guangzhou and Chengdu in2017 (estimated according to figure 4 in the Liu and Wang (2020b)) | −12.7 ppbv to +15.3 ppbv over China in 2014–2017 relative to 2013 Little impact in Beijing and Chengdu Comparable with the impact of anthropogenic emissions in Shanghai Increase more than 10 ppbv in Guangzhou in 2014 and 2016 | Liu and Wang (2020a), Liu and Wang (2020b) |
| 2012–2017 | O3 in summer | +39% in NCP +13% in YRD | +49% in NCP +84% in YRD | Dang et al (2021) |
| 2015–2019 | O3 | +68% in JJJ | +32% in JJJ Major factor in YRD and PRD | Mousavinezhad et al (2021) |
| 2016–2018 | 90th O3-h in May | (compared to 2017) | (compared to 2017) −17.5 μg·m−3 in 2016 in Shandong Province −33.8 μg·m−3 in 2018 in Shandong Province | Li et al (2021b) |
| +0.6 μg·m−3 in 2016 in Shandong Province | ||||
| −0.3 μg·m−3 in 2018 in Shandong Province | ||||
| 2013–2020 | O3 in summer | Increase O3 in eastern and central China | Comparable to or greater than the impact of anthropogenic emissions in eastern, central and southern China | Lin et al (2021) |
| +11.3 ppbv in Beijing | ||||
| +4.8 ppbv in Chengdu | ||||
| +3.7 ppbv in Shanghai | ||||
| +4.9 ppbv in Wuhan | ||||
| −6.2 ppbv in Guangzhou | ||||
In addition to the PM2.5 concentrations, the chemical compositions and source apportionment of PM2.5 changed significantly due to the changes of anthropogenic emissions. Dong et al (2020) and Cao et al (2022) stated that the local contribution to PM2.5 of Beijing decreased largely for strict pollutant control measures from 2013 to 2017, reflecting the uneven emissions reduction in different cities. Chen et al (2019b) reported that compared with the pollution episode in March 2013, the relative contribution of coal combustion decreased by 29%, while the relative contribution of vehicle exhaust increased by 35% in the pollution episode in March 2018 in Beijing. They suggested that different emissions control measures on emission sources were the main cause. Li et al (2021c) also found an increased contribution of vehicles and a decreased contribution of coal combustion to PM2.5 in Heze (a city in the central NCP) from 2017 to 2019.
In addition, more studies have focused on the chemical composition of PM2.5. Sulfate decreased markedly due to the large reduction of SO2 emissions in the past decade. For JJJ, YRD, PRD and SCB, the sulfate decreased by 51.1%, 40.8%, 37.5% and 36.2%, respectively, as reported by Cao et al (2021). However, nitrate showed different trends. Geng et al (2019) claimed that the proportion of nitrate in PM2.5 increased by 5%, 7%, 4% and 3% in eastern China, JJJ, YRD and PRD from 2013 to 2017, respectively, even if NOx emissions had been reduced. Explosive growth of nitrate during haze events was also observed (Kong et al 2018, Li et al 2018, 2019a, Zhou et al 2019, Xu et al 2019a, Fu et al 2020, Sun et al 2020, Zhang et al 2020). A simple explanation for the phenomenon was that a large reduction of SO2 left more NH3 available to form nitrate. However, some studies reported that the North China Plain was in an ammonia-rich atmosphere (Xu et al 2019b, Bhattarai et al 2020), contradicting the above explanation. The second explanation was that photochemical oxidants increased due to the reduction of NOx emissions and constant VOCs emissions in NCP, so that most regions were VOC-limited in winter (Xing et al 2019, Lu et al 2019a, Fu et al 2020, Leung et al 2020), increasing the conversion efficiency of NOx to HNO3. Fu et al (2020) reported ∼30% increase of O3 and OH and 38.7% increase of conversion efficiency of NOx to HNO3 from 2010 to 2017 in NCP. Leung et al (2020) showed that the above two explanations both accounted for high NO3 − concentrations in eastern and central China. Another explanation was proposed by Zhai et al (2021). A large reduction of SO2 emissions, smaller reduction of NOx emissions (compared to SO2 emissions), and stable NH3 emissions were conducive for the transformation of gas-phase nitrate to particle-phase nitrate. By simulation with the Goddard Earth Observing System (GEOS)-Chem model, they found that the deposition of the total nitrate (gas + particle) decreased as the particulate fraction of total nitrate approached unity. As a result, nitrate sometimes showed a weak response to NOx emissions reduction and an increase in haze events.
4.3. Anthropogenic emissions drive O3 change
Unlike PM2.5 which is influenced by a multitude of precursor emissions, the O3 concentration is primarily affected by NOx and VOCs emissions. However, the anthropogenic emissions driven O3 change varied in different studies, as shown in table 2. Ding et al (2019a) showed that changes of anthropogenic emissions decreased O3 in China and key regions from 2013 to 2017, while Liu and Wang (2020b) found that anthropogenic emissions increased O3 in urban areas and decreased O3 in rural areas. Lin et al (2021) projected that anthropogenic emissions changes caused O3 to rise in eastern and central China, but meteorological conditions played the opposite role in the area from 2013 to 2020. Studies also showed that both radiative effect of particles and aerosol chemistry have significant effects on O3 pollution (Li et al 2019b, Wang et al 2020a), which will be discussed in the next section. There are many factors that may cause different results, such as model selections, mechanism settings, amount and distribution of emissions. One of the most important factors is the definition of the temporal and spatial scope. Due to distinctive regional and temporal characteristics of O3, same change of anthropogenic emissions may cause different variation of O3 in different regions and times.
Herein, we mainly focused on the influence of anthropogenic emissions on the O3 formation regime, which is closely associated with the control strategy, and has been considered in many studies as listed in table 3. As NOx plays a dual role in O3 formation, the O3 formation regime is classified as VOC-limited regime (VOC-sensitive regime), transition regime and NOx -limited regime (NOx -sensitive regime) (Sillman 1995, Wang et al 2019b). Lu et al (2019a) reviewed the spatial-temporal characteristics of the O3 formation regime across China. O3 formation during high O3 seasons in most urban areas was in the VOC-limited regime due to large amounts of anthropogenic emissions, while rural areas were in the NOx -limited regime (Xing et al 2019, Yu et al 2020). In the VOC-limited regime, a reduction of NOx emissions may lead to an increase of ozone. Thus, a rapid decrease of NOx was identified as one of the reasons for ozone increases in urban areas in recent years and during COVID-19 (Sicard et al 2020, Xing et al 2020a, Chen et al 2020c, Huang et al 2021). With the change of anthropogenic NOx and VOCs emissions, the formation mechanism of ozone changes dynamically, especially after 2013. In JJJ, the proportion of VOC-limited regime areas varied from 8.4%–44.2% to 5.6%–33.3% from 2014 to 2018 (Wei et al 2021b). Urban areas changed from VOC-limited regime to transitional regime, and rural areas were always in transitional regime or NOx -limited regime (Cheng et al 2019b, Li et al 2021e). In YRD, the transitional regime accounted for more than half, and rural areas tend to be NOx -limited (Wang et al 2019a). In PRD, more than half of urban areas belonged to the transitional regime, and most rural areas were NOx -limited (Chen et al 2020d).
Table 3. Summary of studies on O3 formation regime change in China.
| Region | Period | Method | Major result | References |
|---|---|---|---|---|
| Beijing | 2006–2017 | Statistic method based on observation data | The ozone formation regime tended to be VOC-NOx -limited regime due to NOx-oriented emissions reduction. | Cheng et al (2019b) |
| Eastern China | 2012–2016 | WRF-CMAQ simulation | O3 formation has changed from VOCs sensitive regime to the mix sensitive (transition) regime due to NOx reductions. | Wang et al (2019a) |
| Guangdong-Hong Kong-Macao Greater Bay Area | 2012–2016 | Analysis based on OMI remote sensing data | Ozone formation sensitivity tended to be NOx -limited due to 33.1% decrease of NOx emission and 35.2% increase of VOCs emission. | Chen et al (2020d) |
| China | 2005–2019 | Polynomial simulation; convergent cross-mapping (CCM) based on observation data | The ozone formation regime has changed to the transitional and NOx -limited regime all over China according to the reverse trends of HCHO and NO2. | Li et al (2021e) |
| China | 2016–2019, COVID-19 lock down | Observation data and Chemistry Land-surface Atmosphere Soil Slab model | As rapid reduction of NOx emissions, some cities changed from VOC-limited regime to transitional regime. | Wang et al (2021c) |
| JJJ | 2014–2018 | Brute-force method based on WRF-Chem simulation | VOC-sensitive regimes had changed from 8.4%–44.2% to 5.6%–33.3% with the rapid reduction of NOx emissions. | Wei et al (2021b) |
| Shanghai | 2008–2019 | Statistic method based on observation data | Ozone formation regime transformed from VOCR-limited to NOx -limited with the NOx emissions reduction. | Yang et al (2021b) |
4.4. Coordinated control strategy of PM2.5 and O3
In terms of synergistic effects between PM2.5 and ozone, joint control becomes possible. Based on empirical kinetic modeling approach (EKMA) curve, a reduction of VOCs emissions was proven to conduct under the current emission situation (Wang et al 2019a, Huang et al 2021). Studies conducted by Xiang et al (2020) and Ding et al (2021) revealed that earlier VOCs emission reductions were more cost-effective in reducing both PM2.5 and O3 in JJJ and surrounding regions. For further improvement of air quality in China, reduction of NOx emission is still essential (Xing et al 2019, Li et al 2019c, Ding et al 2021). Based on the response surface model, Dong et al (2022) suggested that the emissions of NOx , SO2, NH3, VOCs and primary PM2.5 should be reduced by 50%, 26%,28%,28% and 55%, respectively, to achieve the National Ambient Air Quality Standard (NAAQS) in YRD region. Huang et al (2020) suggested that emissions of NOx , VOCs and primary PM2.5 should be reduced by 22%, 12% and 30%, respectively, to achieve NAAQS in PRD region.
Furthermore, many studies focused on control policies aimed at both carbon and air pollution reduction (Xing et al 2020b, Yang et al 2021a). Note here that there is a special issue for China referred to as achieving carbon neutrality by 2060. Several studies proposed a strategy to achieve carbon neutrality and evaluated the influence on air quality. Shi et al (2021) projected SO2, NOx , primary PM2.5 and NMVOCs in China to reduce by 93%, 93%, 90% and 61% in 2060, respectively, compared to 2019, decreasing more than 70% PM2.5 and 25% 90th MDA8 O3. They expected PM2.5 concentrations and O3 concentrations in more than half of 337 cities to meet the World Health Organization (WHO) guidance (2006) in 2060. Cheng et al (2021) and Zhang et al (2021a) also highlighted that emission mitigations to achieve China's carbon neutrality goal could improve PM2.5 exposure to below 10 μg·m−3 for the majority of China's population.
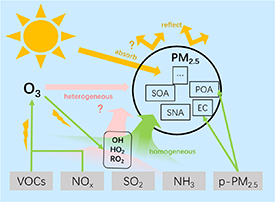
5. Interaction of PM2.5 and O3 through atmospheric processes
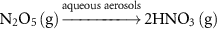
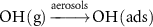
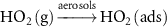
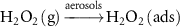
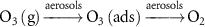
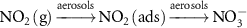
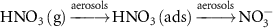
Both secondary pollutants, PM2.5 and O3, have an impact on one another through various atmospheric processes. In this section, we discuss three dominant pathways: atmospheric oxidation capacity, heterogeneous reactions, and aerosol radiative effects, as shown in figure 5.
Figure 5. Interactions between PM2.5 and O3.
Download figure:
Standard image High-resolution image
5.1. Atmospheric oxidation capacity
AOC refers to the ability of atmospheric chemical processes to oxidize primary pollutants. Oxidants (HOx , NO3 −...) concentrations and reaction rates are always used to characterize AOC. AOC plays an important role in the formation of both PM2.5 and O3. As one of the important atmospheric oxidants, O3 concentration is often positively correlated with AOC (Zhu et al 2020). In clear air, O3 is generated by NO2 photolysis, and consumed in the oxidation of NO, without the accumulation of O3 in the process. However, when OH oxidizes VOCs and generates HO2 or RO2 radicals, they replace O3 to oxidize NO, leading to an increase of the O3 concentration. Another product of VOCs oxidized by OH is oxygenated compounds, leading to the formation of secondary organic aerosol (SOA). At the same time, the increase of atmospheric oxidants also accelerates the formation of secondary inorganic aerosol (SNA). SOA and SNA are reported to account for more than 50% of the PM2.5 concentration in most cities in China (Yin et al 2020). Wang et al (2021b) analyzed simulation and observation data of oxidants in 2013 and 2020. The results showed that the level of AOC did not decrease significantly (Chen et al 2020c), and even increased slightly in NCP and PRD, causing an increase of secondary pollutants. The importance of AOC was again evident in studies on COVID-19. Zhu et al (2021b) revealed that enhanced AOC during COVID-19 contributed 40% and 53% of O3 in NCP and YRD, respectively. Wang et al (2021d) reported that the changes of AOC and O3 concentrations in YRD were consistent during the COVID-19 lockdown. Huang et al (2021) found that an increase of AOC due to large decreases of NOx emissions promoted the formation of secondary particles. Moreover, Chen et al (2020a) revealed that the stratosphere-to-troposphere (STE) exchange of O3 would increase PM2.5 by 2.289 μg·m−3 in winter and 2.034 μg·m−3 in spring by enhancing AOC.
Several studies analyzed the nonlinear relationship between AOC or oxidants and precursors, and then proposed a control strategy for NOx and VOCs to avoid the increase of secondary pollutants. On the basis of O3, OH and NO3 − isopleths, Kang et al (2021) found that NOx emission reduction was beneficial for O3 and PM2.5 in summertime. Wang et al (2021b) found that NOx emission reduction would decrease the AOC in summer, but increase the winter AOC in NCP and YRD. Both studies also proposed that the emission reduction of VOCs were beneficial for the further control of O3 and PM2.5. Furthermore, the effects of some other species on AOC have also been found. Ge et al (2019) showed that NH3 could enhance AOC by accelerating the formation of gas-phase nitrous acid (HONO). Li et al (2021d) demonstrated that halogens increased PM2.5 by 21% in northern China, and the enhancement of AOC was the main reason (Li et al 2020b).
5.2. Heterogeneous reactions
Heterogeneous chemistry refers to reactions on the surface of aerosols, including reactions and uptake of gases. Thus, it can lead to changes in both the size and components of particles (Farmer et al 2015). For example, Tian et al (2021) reported that heterogeneous reactions (including the uptake of SO2, NO2, HNO3 and H2SO4 on CaCO3 and mineral oxides) contributed 20%–30% to sulfate formation over northern China during a dust pollution event. Wang et al (2017c) showed that heterogeneous reactions promote both fine mode and coarse mode nitrate and sulfate to be internally mixed with dust particles.
Heterogeneous reactions related to sulfate formation have been a concern since the end of the last century. Early studies revealed that SO2 could be oxidized by oxidants (H2O2, OH, O3...) and NO2 on mineral dust (Zhang and Carmichael 1999, Ye et al
2018a), and by dissolved oxidants in the aqueous phase (Cheng et al
2016, Li et al
2017a). Recently, Gen et al (2019) proposed NO2 and OH radicals produced from the photolysis of particle nitrate could oxidize aqueous-phase SO2, which was a less explored pathway for sulfate formation. Song et al (2019) proposed that heterogeneous reactions of hydroxymethanesulfonate (HMS) might be important and could account for up to 1/3 of unexplained sulfate formation in an air quality model. In addition, many studies have focused on heterogeneous reactions of HONO. HONO, as an important source of OH radicals, is highly related to the secondary components of particles. Cui and Wang (2021) found that in polluted regions (JJJ, YRD, and PRD), the HONO concentration in winter was highest. However, the HONO concentration was typically underestimated in chemical transport models (CTM), particularly during haze events (Xue et al
2020). By considering heterogeneous reactions of HONO, the performance of HONO, OH, O3, and secondary components in particles was improved significantly. Zhang et al (2019a) found that heterogeneous reactions ( contributed approximately 85% of the daytime HONO concentration and improved the SOA concentration by more than 40% in Beijing. Fu et al (2019) reported that heterogeneous reactions of HONO on the surfaces (
 ) were the major source (72%) of HONO concentration during a severe pollution in PRD. Compared to the simulation without any HONO sources, the daytime averaged O3 and mean concentration of TNO3 (HNO3 and fine particle NO3
−) increased 70% and 67%, respectively. Zhang et al (2021b) revealed that heterogeneous reactions on ground contributed nearly 70% of total HONO production. In Beijing, heterogeneous reactions of HONO increased the OH concentration and SOA concentration by 98% and 50%, respectively. Heterogeneous reactions were proven to effectively improve the simulation of HONO and SOA, but there still exists a gap between simulations and observations, and more studies are needed.
) were the major source (72%) of HONO concentration during a severe pollution in PRD. Compared to the simulation without any HONO sources, the daytime averaged O3 and mean concentration of TNO3 (HNO3 and fine particle NO3
−) increased 70% and 67%, respectively. Zhang et al (2021b) revealed that heterogeneous reactions on ground contributed nearly 70% of total HONO production. In Beijing, heterogeneous reactions of HONO increased the OH concentration and SOA concentration by 98% and 50%, respectively. Heterogeneous reactions were proven to effectively improve the simulation of HONO and SOA, but there still exists a gap between simulations and observations, and more studies are needed.
In addition, heterogeneous reactions were proven to influence ozone concentration by impacting the production and loss of nitrogen oxides (NO2, NO3 and N2O5), hydrogen radicals (HO2, OH, and H), ozone and halogen radicals (Jacob 2000), as shown in table 4. Li et al (2019b) projected that a 40% decrease of PM2.5 was the most important driver of the O3 increase in the North China Plain from 2013 to 2017, by slowing the uptake of HO2. However, another study by Qu et al (2018) proved that effect of heterogeneous reactions of Hx Oy (OH, HO2, H2O2) was less than that of heterogeneous reactions of nitrogen oxides and ozone. Based on field campaign measurements of radicals and trace gases, Tan et al (2020) conducted a sensitivity test of HO2 uptake by using different uptake coefficients. The results showed that the performance of all radicals (OH, HO2, and RO2) was poor when using an uptake coefficient value of 0.2 (same as Li et al 2019b). When using an uptake coefficient of 0.08, the difference between the simulation and observation was much smaller, and the influence of aerosol uptake on HO2 concentration was only 17%. Tan et al (2019) also found that the ROx and HO2 budgets of the PRD closed without aerosol characterization, indicating that heterogeneous reactions of HO2 were not important. In summary, the impact of heterogeneous reactions on ozone is subjected to much debate. Both comprehensive field measurement and modeling studies are suggested.
Table 4. Heterogeneous reactions related to ozone concentration.
| Reactions | Uptake coefficients | References |
|---|---|---|
| 0.2 (range 0.1–1) | Jacob (2000) |

| 10−4 (range 10−6–10−3) | |
| 10−3 (range 2 × 10⁻⁴–10−2) | |
| 0.1 (range 0.01–1) | |
| Dust: 0.1 (range 0.01–0.2) Sea salt: 0.04 BC: 0.1 | Deng et al (2010) |
| Dust: 0.1 (range 0.01–0.2) Sea salt: 0.01 BC: 0.1 | |
| Dust: 10−4 (range 10−5-2 × 10⁻⁴) Sea salt: 10−4 BC: 10−4 | |
| Dust: 10−4 (range 10−5–2 × 10⁻⁴) Sea salt: 5 × 10⁻⁵ BC: 4.5 × 10⁻⁵ | |
| Dust: 4.4 × 10⁻⁵ (range 10−5–10−4) Sea salt: 1.36 × 10⁻⁶ BC: 10−4 | |

| Dust: 0.1 (range 0.01–0.2) Sea salt: 0.046 BC: 0.5 | |
| Dust: 0.01 (range 0.001–0.1) Sea salt: 9 × 10⁻⁵ BC: 0.001 |
5.3. Aerosol radiative effects
Aerosol was proven to have direct effects on radiative forcing by absorbing or scattering radiation and indirect effects by participating in cloud formation (Bond et al 2013, Hong et al 2017, Liu and Matsui 2021). Gao et al (2022) reported anthropogenic aerosols decreased shortwave radiative force at the bottom of the atmosphere by 0.45–140.00 Wm−2 in Asia. Thus, the radiative effect can influence ozone formation via its impact on thermal and photolysis reactions. Previous studies revealed that aerosol direct effects lead to a lower photolysis rate and less ozone. (Xing et al 2017, Mukherjee et al 2020, Qu et al 2021, Zhao et al 2021). Mukherjee et al (2020) reported that the direct radiative effects of black carbon reduced more than 30% ozone concentrations by changing the photolysis rate in South Asia during a heavy dust and biomass burning event. Besides, aerosol direct effects can change meteorological factors, such as the temperature, wind speed, humidity, planetary boundary layer height, by influencing the energy balance in atmosphere (Li et al 2017d, Wu et al 2020, Wang et al 2022b). Li et al (2022) estimated that aerosol radiative effect decreased 2 m air temperature and planetary boundary layer height by 0.4 °C–1.8 °C and 30.9–183.6 m, respectively, during severe winter haze events in the North China Plain. Impact of aerosol radiative effects on meteorological factors is proven to influence O3 concentration. Xing et al (2017) found that changes of atmospheric dynamics caused by aerosol radiative effect decreased the daily maximum 1 h O3 in January by up to 39 μg·m−3 but increased the peak ozone in July by up to 4 μg m−3 in China. Moreover, Qu et al (2021) found that aerosol direct effects also influenced ozone concentration through the vertical transmission of water vapor. They projected that the annual ozone concentration decreased by 14.9%, 8.7%, 4.3% and 7.1% in JJJ, YRD, PRD and SCB, respectively, due to the combined impact of aerosol direct effects.
Regarding the impact of aerosol radiative effects on ozone, some studies have pointed out that rapid aerosol reduction in China may tend to enhance ozone production. According to Zhao et al (2021), from 2005 to 2019, the photolysis rate of nitrogen dioxide in Beijing increased by 5 × 10⁻⁵ s−1 per year, while the annual aerosol effect decreased in this period. Wang et al (2020a) got the similar conclusion that the decrease of particles enhanced solar radiation and thus led to an increase in the photolysis rate of nitrogen dioxide of 3.6 ± 0.8% per year. However, whether the aerosol radiative effects play an important role in ozone variation is contentious. Ma et al (2021) showed that aerosol radiative effects contributed 23% of the summertime ozone change in the NCP from 2013 to 2019. Zhu et al (2021a) proved aerosol radiative effects contributed to a 7.8% ozone rise over the NCP during COVID-19. However, Li et al (2019b), Liu and Wang (2020b), and Li et al (2021f) all showed that the influence of aerosol radiative effects on ozone was weak, generally less than 1 ppb MDA8 O3 from 2013 to 2017 across China. The varied mechanism of aerosol radiative effects in different methods and models was an important reason for the difference between studies, which should be set more carefully and accurately.
6. Influence of climate change on PM2.5 and O3
As one of the important components of the earth's ecosystem, human activities have been proven to significantly influence climate. According to AR6 by the IPCC, the total anthropogenic driving effective radiative forcing (ERF) increased by 2.72 (very likely (5%–95%) range is 1.96–3.48) W m−2 from 1750 to 2019. Among the contributing forcing agents, ozone and aerosols contributed 0.47 (0.24–0.71) W·m−2 and −1.1 (−1.7 to −0.4) W·m−2 to ERF, respectively. Climate change could in turn affect the production, transport, and deposition of PM2.5 and O3 (Neu et al 2014, von Schneidemesser et al 2015, Xu et al 2017, Fu and Tian 2019, Lu et al 2019b, Cao and Yin 2020, Chen et al 2020e). The impact of a future warming climate without anthropogenic emissions change on air quality is defined as the 'climate change penalty' (Fiore et al 2012). Previous studies have shown that increasing regional stagnation enhances PM2.5 and O3 concentrations (Zhang et al 2018, Liu et al 2021a, Liu et al 2021b). For ozone, increasing contributions from biogenic CH4 and soil NOx emissions were expected (Xie et al 2017, Ma et al 2019a). Moreover, STE was likely to increase in the future. Meul et al (2018) reported that the global mean annual influx of STE would increase by 53% from 2000 to 2100 under the Representative Concentration Pathway 8.5 (RCP8.5) scenario. For PM2.5, the influence of meteorological variables (e.g. mixing depth and precipitation) cannot be neglected (Jacob and Winner 2009, Fiore et al 2015) (in contrast to O3). The impacts of climate-sensitive processes and meteorological variables on PM2.5 and O3 were discussed in detail by Jacob and Winner (2009), Fiore et al (2012) and Fu and Tian (2019).
Many studies forecasted PM2.5 and O3 concentrations under climate change scenarios (Special Report on Emission Scenarios (SRES), RCPs, and Shared Socioeconomic Pathways (SSPs)) proposed by the Intergovernmental Panel on Climate Change (IPCC, O'Neill et al 2013, 2017). Turnock et al (2020) estimated that PM2.5 and O3 would decrease across all regions globally by up to 12 μg·m−3 and 15 ppb in the late 20th century under SSP126 scenario, but would increase in most regions by up to 8 μg·m−3 and 12 ppb under the SSP370 scenario. Hong et al (2019) found that compared with 2006–2010, climate change (air pollutant emissions were fixed) increased the mean annual PM2.5 concentration and ozone season (April to September) averages of MDA1 O3 by up to 9 μg·m−3 and 2–8 ppb across eastern China in 2046–2050 under the RCP4.5 scenario. However, studies on climate change always exhibit large uncertainties, due to dependence on model and scenario assumptions (Rao et al 2017, Tokarska et al 2020). Even if anthropogenic pollutant emissions are expected to decrease in China to in the context of climate change (Xing et al 2020b), climate change would result in additional challenges for air quality management.
7. Conclusion and outlook
In this study, we summarize the spatiotemporal distribution and correlation of PM2.5 and O3, and review the synergistic effects between PM2.5 and O3 as influenced by three factors: (a) anthropogenic precursor emissions; (b) the interaction between PM2.5 and O3 through atmospheric processes; (c) the impact of climate change.
According to surface observation data, PM2.5 concentration in China has decreased by more than 50% since 2013, however the O3 concentration, particularly in urban areas, has increased. According to literature review, the main factor influencing changes in PM2.5 and O3 is the evolution of anthropogenic emissions. Sources and components of PM2.5 also have shown great changes. We mainly focus on the increase of secondary components and nitrate in NCP. For O3, change of anthropogenic emissions have an impact on O3 formation regime, which tend to be more sensitive to NOx . The studies on co-control of PM2.5 and O3 generally point to the importance of VOC emissions reduction in the future. Furthermore, we review three important atmospheric processes related to interactions between PM2.5 and O3. Numerous studies suggest that increased atmospheric oxidation capacity is crucial for the growth of secondary components as well as O3. Many studies have suggested the significance of heterogeneous reactions and the radiative effect when considering how PM2.5 affects ozone. Finally, we review how climate change affects China's PM2.5 and O3 levels. The co-control of PM2.5 and O3 is challenging due to the high level of uncertainty in this field.
Overall, the following gaps exist and need to be explored in the future:
- (a)Despite of the rapid increase of air pollutants monitoring sites in China, there still lack the observation data of PM2.5 components, key oxidants and VOC species. We expect future studies based on monitoring to provide basis for mechanistic understanding.
- (b)Though the heterogeneous reactions and aerosol radiative feedback are significant, relevant mechanism and parameterization scheme are missing or unclear in three-dimensional air quality model. We recommend the development of models based on solid experiments.
- (c)Influence of climate change on PM2.5 and O3 is hard to be clarified by limited observation data and field measurements, which makes research on pertinent mechanisms more challenging. Considering the synergistic effect of PM2.5 and O3 through atmospheric processes, we look forward to the progress of research on how these atmospheric processes change and influence PM2.5 and O3 in the future. We also advise the research focusing on China with various climate models and scenarios.
- (d)As the common precursors of PM2.5 and O3, a coordinated control strategy of NOx and VOCs is crucial, but with lots of limitations in past research. Based on advanced models, we propose that a control strategy should take into account different meteorological conditions, regional emission characteristics, and the feasibility of implementing actual control measures.
Acknowledgments
We thank Dr Yicong He for language improvement and Dr Haotian Zheng for data collection of anthropogenic emissions. This research was supported by National Natural Science Foundation of China (22188102), the FRIEND (Fine Particle Research Initiative in East Asia Considering National Differences) Project through the National Research Foundation of Korea (NRF) funded by the Ministry of Science and ICT (2020M3G1A1114621), and Tsinghua-Toyota Joint Research Institute Inter-disciplinary Program. Dr Shuxiao Wang is supported by Tencent Foundation through the XPLORER PRIZE.
Data availability statement
All data that support the findings of this study are included within the article (and any supplementary files).
Conflict of interest
The authors declare that they have no known competing financial interests or personal relationships that could have appeared to influence the work reported in this paper.
Supplementary data (1.2 MB PDF)