
Abstract
Tin dioxide nanoparticles (SnO2 NPs) are synthesized by using Buxus wallichiana (B. Wallichiana) leaf extract. To determine the surface area (138.2 m2 g−1) and pore size of the SnO2 NPs, the nitrogen adsorption-desorption method used. The average crystallite size was determined to be 38 nm using x-ray diffraction (XRD). Scanning electron microscopy (SEM), diffuse reflectance spectroscopy (DRS), were used to investigate the structural and optical properties of SnO2 NPs with a band gap of 3.69 eV. Fourier transform infrared (FTIR) spectroscopy was used for the chemical analysis. In this experiment, methyl orange (MO) was deteriorated in the presence of artificial sun light for 140 min, where 97.50 percent of the dye decolorized. A 15 ppm solution of MO with the pH 6, was treated in the presence of 20 mg of the catalyst, resulting in the highest photocatalytic activity.
Export citation and abstract BibTeX RIS

Original content from this work may be used under the terms of the Creative Commons Attribution 4.0 licence. Any further distribution of this work must maintain attribution to the author(s) and the title of the work, journal citation and DOI.
1. Introduction
Environmental protection and safety is becoming the most critical subject for the scientific community these days as there is abrupt increase in the usage of severely damaging organic pollutants in industries and agriculture (Huang et al 2018). Major percentage of the water contamination comes from the untreated dyes released from the textile industries thus causing water scarcity. Almost 15% of the dyes used in industries are released untreated while they require proper processing. These dyes can remain in the environment for longer periods as they are highly stable. Most of them possess carcinogenic and teratogenic affects for humans. The traditional technologies for wastewater treatment include biological chemical and physical methods for dye removal (Bai et al 2019). Physical methods include extraction, membrane separation and adsorption while biological methods include decomposition of dyes using bacteria. Chemical oxidation, wet catalytic oxidation, chemical coagulation, electrolysis and Fenton reagent oxidation are included in the chemical methods (Hassan et al 2019). Comparatively, photocatalytic technology is easy to operate, produces no secondary pollutants and is regarded as promising technology for the dyestuff treatment of waste water as it possess strong oxidizing capacity (Sun et al 2019). Methyl orange is an azo based dye and is considered as an environmental pollutant as it can severely damage the ecosystem. It hardly decomposes in water and thus causing serious problems (Gawade et al 2017). Azo dyes are extensively used in the pharmaceutical industries, research laboratories, printing and textile industries. MO can enter the human body via skin and can cause tissue death in lungs, vomiting and fast heart rate (Basahel et al 2015). During the decomposition MO uses dissolved oxygen in water resultantly producing toxic intermediates that are seriously threatening the aquatic flora and fauna. In this study MO was considered as a model dye for photocatalytic degradation (Hirthna et al 2018, Kazazi et al 2019, Nguyen et al 2019).
The metal oxides play an important role in synthetic conversions in the industries as the heterogeneous catalysts. Recently, they have been manipulated for environmental protection to degrade the pollutants produced from the industrial waste that are considerably damaging both the human beings and the aquatic flora and fauna (Hassan et al 2019). The metal oxide semiconductors possess a considerable range of applications in hydrogen production, gas sensing, photovoltaics, biomedical and biological sensing and water purification. Tin dioxide (SnO2), among various metal oxides, an n-type semiconductor material have been an attractive material used for gas sensing, in solar cells, lithium based batteries, and in super capacitors (Aziz et al 2013). It has a tetragonal rutile structure having a lot of advantages in nanometre range than bulk material comparatively. Owing to its unmatchable properties like transparency, stability, non-toxicity, cheap availability, photo stability and eco-friendly low cost production make it an effective photocatalysts (Gaber et al 2014, Paramarta et al 2017). Various methods have been applied in previous years or the synthesis of SnO2 such as laser ablation, evaporative decomposition of the solution, sol-gel method, gas-phase methods and the wet chemical route (Han et al 2009, Ho et al 2009, Haq et al 2020a). But the requirement of toxic chemicals and solvents, expensive operational equipment's and the additives is diverting the attention toward an inexpensive and eco-friendly non-toxic method for the production of nanoparticles (Singh et al 2019).
In this project SnO2 NPs have been synthesized using and eco-friendly and non-toxic biological method using B. Wallichiana plant leaves extract. The N2 adsorption-desorption, XRD, SEM, DRS and FTIR techniques were used to study the physicochemical properties. The photocatalytic efficacy will be evaluated against MO and at different pH, initial concentration and catalyst dose.
2. Materials and methods
2.1. Materials
In this study, analytical-grade compounds were used. Sigma Aldrich provided the SnCl4.5H2O and methyl orange, which were used for further purification. All of the needed working solutions were prepared with distilled water. In this study, leaves of B. Wallichiana were taken from the village of Parshali in the Buner district.
2.2. Extract preparation
The B. Wallichiana leaves were picked and washed carefully with distilled water to remove any dust particles before being dried in the shade. In an airtight jar, 50 g of dried leaves were added to 1000 ml of heated deionized water and left for 4 h. The crude extract was filtered before being centrifuged at 4000 rpm and the upper layer was saved for further testing.
2.3. Green synthesis of SnO2 NPs
1.75 g of SnCl4.5H2O was dissolved in distilled water to make a 5 mM stock solution, and 50 ml of this solution was combined with 20 ml of the produced extract. After heating and stirring the reaction mixture for 30 min, a white gel was generated, which was then aged for 12 h at room temperature. The solid product was rinsed with distilled water, dried at 100 °C, and kept in a plastic bottle for further use.
2.4. Instrumentation
The crystallographic study of SnO2 NPs was conducted through XRD in the range of 20 to 80 using Panalytical X-pert pro, where copper is used as radiation source. The texture parameters were investigated via N2 adsorption-desorption method using micromeritics analyser model GeminiVII2390i. The surface morphology was examined through SEM model FEI NOVA nano SEM 450 whereas the optical study was performed through DRS UV–vis/NIR spectrometer lambda 950with integrated sphere of 200–2500 nm. The chemical analysis of the sample was done through FTIR 8400S Shimadzu in the range 4000–400 cm−1.
2.5. Photocatalytic activity
In the presence of simulated solar light, the synthesized SnO2 NPs were utilized as a photocatalysts for the degradation of the MO. The 15 mg of SnO2 NPs were added to 50 ml of MO solution (15 ppm) for each experiment. To achieve desorption-adsorption equilibrium, the reaction mixture was agitated in the dark for 30 min. The experiment was then subjected to the light source, and the changes in absorbance maxima were observed as a function of time using a double beam spectrophotometer at a set interval. The % deterioration and degradation rate constant were calculated using equation (1) where Co is initial concentration, Ct is final concentration and equation (2), where Co is initial concentration, C is final concentration, t is time and k is constant (Shoukat et al 2019). The whole experimental procedure was summarized in a flow sheet diagram shown as figure 1.


(Position for figure 1)
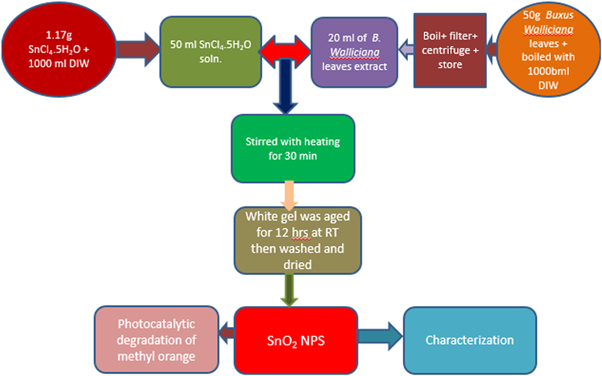
Figure 1. Flow sheet diagram of the experimental section.
Download figure:
Standard image High-resolution image3. Results and discussion
3.1. XRD analysis
The figure 2 exhibits the x-ray diffractograms of SnO2 NPs samples calcined at 100 °C. The diffractogram exhibits distinct peaks at 2 theta positions, 26.56 (110), 33.81 (101), 44.10 (210), 51.62 (211), and and 64.80 (112) which validate the cassiterite crystal phase with tetragonal geometry when matched with reference code no. 00–001–0625. With 0.185 percent of lattice strain, the average crystallite size was found to be 38 nm. The degree of crystallinity determined through origin software (V9.0.SR2) is 82.56 percent. This low crystallinity is attributed to the broadness of the diffraction peaks, which shows that along with crystalline phase, amorphous content is also present in the sample.
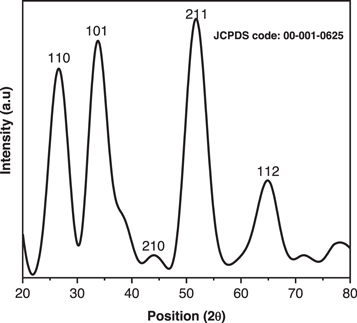
Figure 2. XRD pattern of SnO2 NPs.
Download figure:
Standard image High-resolution image3.2. Surface area analysis
The specific Brunauer Emmett and Teller (BET) and pore size distribution of the as-fabricated SnO2 NPs was determined by using N2 adsorption/desorption isotherm (Sergent et al 2002). The type II isotherm (figure 3) with a steady cavitation at the lower limit suggest the unrestricted adsorption and this type of isotherm is obtained for non-rigid aggregates of plate-like particles. The specific surface area was found to 138.20 m2 g−1 with pore size of 18.73 Å with pore volume of 0.0180 cm3 g−1.

Figure 3. N2 adsorption-desorption isotherm of SnO2 NPs.
Download figure:
Standard image High-resolution image3.3. SEM analysis
The SEM analysis was done to scrutinize the morphology of SnO2 NPs and the low and high magnification micrographs are shown in figure 4. Both the images shows the formation of irregular shaped small size particles with visible boundaries, which are tightly held together forming crowded structures. It is seem that the agglomeration rate is high as compared to the growth rate and at the start the hydrolysis produces small nucleated particles with a very low growth rate (Yu et al 2003). The varied size agglomerates are formed and their sizes are depending upon the number of agglomerated particles.
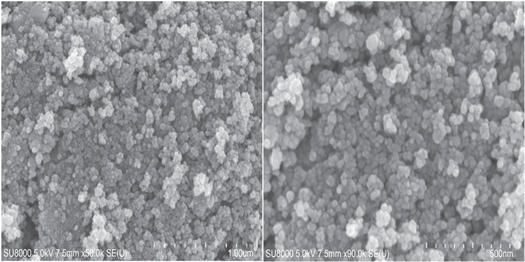
Figure 4. The low and high magnification SEM images of SnO2 NPs.
Download figure:
Standard image High-resolution image3.4. DRS analysis
The UV–vis reflectance spectrum of SnO2 NPs given as inset in figure 4, shows that maximum absorption was occurred in UV region. The steady increase is seen in the percent transmittance of light with increasing wavelength. A slight increase absorption was evident due to small peak around 440 nm, which might be due to some surface defect (Haq et al 2021b). The band gap energy calculated on basis of Tauc plot (figure 5) is 3.69 eV, which is almost similar with that reported earlier (Bibi et al 2020).
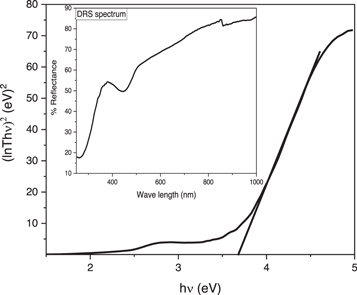
Figure 5. Tauc plot (Inset: DRS spectrum) of SnO2 NPs.
Download figure:
Standard image High-resolution image3.5. FTIR analysis
The FTIR spectra of SnO2 NPs synthesized by green method displayed in figure 6, possess as broad band centred at 3401 cm−1 and another band at 1641.82 cm−1 assigned to stretching and bending vibration of water molecules (El Radaf and Abdelhameed 2018). The hydroxyl tin bonds vibrations were confirm by the set of peaks in the range of 1550 to 921 cm−1 (Haq et al 2021a). The peaks at 663.90 and 560.85cm−1 are due the O–Sn–O and terminal Sn–OH vibration respectively (Amininezhad et al 2015).

Figure 6. FTIR spectrum of SnO2 NPs.
Download figure:
Standard image High-resolution image3.6. Photocatalytic activity
The photocatalytic activity of SnO2 NPs made utilising the green synthesis process was tested as catalyst for the mineralization of methyl orange under the full light spectrum. In distilled water, a stock 15 ppm solution was prepared, and 50 ml of this solution was transferred to a reaction vessel, where 20 mg of the catalyst (0.4 g l−1) was added. To establish the adsorption-desorption equilibrium, the reaction mixture was agitated in the dark for 30 min. A double beam UV–visible spectrophotometer was used to monitor the reaction process, and the maximum absorbance for MO was noted at 464 nm. The liquid samples were then spectrophotometrically evaluated after a specific time period (5, 15, 30, 50, 75, 105, and 140 min) and a decrease in absorbance maxima at 464 nm was seen as a function of time. The MO solution turned colorless after 140 min and in the same time span, the 97.50 percent of the MO was degraded a shown figure 7(b).

Figure 7. (a) Degradation profile; (b) percentage degradation; (c) Kinetic plot and (d) schematic representation of photo-degradation mechanism.
Download figure:
Standard image High-resolution imageThe photo-induced mineralization of MO in the presence of SnO2 NPs was depicted in figure 7(d), which shows that the charges were generated after the illumination of the reaction with artificial sunlight. The light interaction with the catalyst surface led to the excitation of electrons from the valance band (VB) to the conduction band (CB), leaving a positive hole in the VB. Both of these charges are the driving forces for oxidation and reduction reactions. The superoxide radicals were formed by the reaction of dissolved oxygen with excited electrons, and this superoxide radicals reacts with hydrogen ions to form hydrogen peroxide, which then reacts with excited electrons to form hydroxyl radicals. The positive hole reacts with the surface hydroxyl group/water, leading to the formation of hydroxyl radicals. The hydroxyl radicals generated in different ways mineralized the MO into CO2 and H2O (Shah et al 2019, Haq et al 2020b).
3.7. Factors affecting photocatalytic activity
Several factor are reported that effect the photocatalytic activity of the metal oxide nanoparticles. Herein, the effect of catalyst dose, initial concentration of dye and pH of the solution on photodegradation of the MO in the presence of SnO2 NPs has been studied as shown in figures 7(a)–(d).
3.7.1. Effect of catalyst dosage
Under simulated solar light, different amounts of SnO2 NPs (5, 10, 15, 20, 25, and 30 mg) were utilised to degrade MO. The results showed that the percent degradation increases with increasing catalyst dose and with the 20 mg of catalyst, maximum activity was observed (figure 8(a)). This decrease in percent degradation can be attributed to the fact that a higher catalyst dosage causes light blockage, which affects photocatalytic activity (Yuan and Xu 2010).

Figure 8. Graphical representation of the factors (i.e. catalyst dose (a), initial concentration (b), pH (c) and reusability (d)) effecting the photocatalytic degradation of MO.
Download figure:
Standard image High-resolution image
3.7.2. Effect of initial concentration
To test the photocatalytic activity of SnO2 NPs, 5, 10, 15, 20, 25, and 30 ppm solutions of MO were applied to them. The photocatalytic activity was shown to be significantly affected by dye concentration. A rise in activity was found up to 15 ppm, after which further increases in concentration resulted in a gradual decline in photocatalytic activity as shown in figure 8(b). The most noticeable photocatalytic activity was found at 15 ppm. The reason for the decrease in activity as the dye concentration rises is that at first, there is more interaction between the light and the photocatalyst due to maximum light penetration, but as the dye concentration rises, the dye molecules block the penetrating light, lowering the photocatalysts efficiency (Kansal et al 2007).
3.7.3. Effect of pH
The photocatalytic activity was tested by increasing the pH from 4 to 9 while keeping the rest of the reaction conditions constant as shown in figure 8(c). There was an increase in response rate up to pH 6, but additional increases slowed the rate of deterioration. To investigate the influence of pH, the 15 ppm MO solution was exposed to 20 mg SnO2 NPs, and the highest degradation was obtained at pH 6, indicating that acidic media promotes degradation more effectively than alkaline media. When organic chemicals interact with dissolved oxygen in the presence of sunshine, they dissociate into the acidic medium and cause photo-oxidation. As the pH of the particle surface changes, a scattered situation develops. Because there is no charge on SnO2 NPs and the degrading efficiency of the catalyst is visible at pH 6, Van Der Waals force prevents agglomeration and favors the dispersion (Yuan and Xu 2010).
3.7.4. Reusability
The stability of the SnO2 NPs as a photocatalysts was studied in five consecutive cycles (figure 8(d) under the same reaction condition and only a fresh MO solution was introduced into reactor. The percentage decomposition was recorded for the five cycles and a gradual decrease was seen from cycle one to five. This decrease is might be due to the surface saturation of the catalyst, where a large number of the MO molecule are adsorbed. The adsorbed MO molecules block the light to fall on the surface of the SnO2 NPs, which ultimately reduced the electron excitation process and thus the generation of hydroxyl radicals and reactive oxygen species.
4. Conclusion
The B. Wallichiana leaves extract mediated process is an economical, easy and efficient way for the production of SnO2 NPs and this process can be applied for the synthesis of other nanomaterials is well. The physicochemical study shows that a well crystalline tetragonal shaped crystallites were formed, which has a wide band gap of 3.69 eV. The photodegradation study reveals that the maximum activity was found at 15 ppm initial concentration, pH-6 and 20 mg of the catalyst, where 97.50 percent MO was degraded.
Acknowledgments
The authors are grateful to Taif University Researcher Supporting Project Number (TURSP-2020/119), Taif University, Taif Saudi Arabia.
Data availability statement
All data that support the findings of this study are included within the article (and any supplementary files).