

Abstract
Structural, optical, and magnetic properties of ferrite series with chemical formula Zn0.5NixMg0.5−xFe2O4 (x = 0.0, 0.1, 0.2, 0.3 and 0.4) were investigated. Co-precipitation and sol–gel methods were used to synthesis the samples and to investigate further the influence of these preparation methods on the properties of Zn0.5NixMg0.5−xFe2O4 nano-ferrites. X-ray diffraction and Fourier-transform infrared spectroscopy revealed that the samples crystallize in a cubic spinel structure with space group Fd3m:1. The crystallite size of Zn0.5NixMg0.5−xFe2O4 nanoparticles was decreased from 19.15 to 11.65 nm with increasing Ni content for the samples of co-precipitation method, while the opposite behavior was observed in case of sol–gel method which was increased from 13.90 to 21.90 nm. Moreover, the optical investigation by UV-visible spectroscopy revealed that the energy band gap of the samples of co-precipitation method ranged (6.04–6.08) eV compared to (4.44–4.50) eV of sol–gel method. For both methods, substitution of Ni+2 by Mg+2 in Zn0.5NixMg0.5−xFe2O4 affects the remanent magnetization (Mr), coercivity (Hc) and saturation magnetization (Ms) suggesting the super-paramagnetic behavior of the samples. The substitution of Ni resulted in small values of coercivity ranged 0.758 to 164.62 Oe. The Ms was ranged 20.39 to 127.57 emu g−1 and an enhancement in magnetization was observed which increases the value of Ms that was found to be maximum with x = 0.4 of co-precipitation method (127.57 emu g−1). The magnetic behavior of synthesized Ni doped nanoparticles makes them suitable candidate for sensing and high-frequency applications and for use in hyperthermia treatment. The characterization outcomes may recommend that co-precipitation method is preferred over sol–gel method for refined structure and preferable properties of Zn0.5NixMg0.5−xFe2O4 nanoparticles.
Export citation and abstract BibTeX RIS

Original content from this work may be used under the terms of the Creative Commons Attribution 4.0 licence. Any further distribution of this work must maintain attribution to the author(s) and the title of the work, journal citation and DOI.
1. Introduction
Magnesium doped Nickel of zinc ferrite nanoparticles is of technological importance [1]. Ni-Mg ferrites have good chemical stability and many applications in electromagnetic and fabrication of electrical and medical devices because of their high electrical resistivity, magnetic permeability and mechanical strength, beside low dielectric loss and coercivities and [1, 2]. The chemical formula of spinel ferrites is MFe2O4 where M could be a bivalent metal cation. The spinel structure has fcc cage of oxygen ion with bivalent cations allocated among tetrahedral sites (A) and octahedral (B) sites [3]. The inverse spinel structure formed in Magnesium ferrite (MgFe2O4) with Mg+2 cations mostly favored on octahedral sites and in the Nickel zinc ferrite as well, while normal spinel structure formed in Zinc ferrite (ZnFe2O4) where Zn+2 cations mainly occupy tetrahedral sites [4–7]. In addition to their chemical and structure properties, the small-scale size of spinel ferrites was the key for concentrated research to use their interested properties for many applications [8, 9]. Several research works previously focused on studying and characterizing nanoferrites such as Zn and Cr doped Mg-Co spinel nanoferrites [2], Zn1−xMgxFe2O4 [3], MgFe2O2 nanoparticles [4] and MgFe2O4 [5]. Besides, several methods were described in literature for producing small particles with sizes ranged (2–100) nm and the co-precipitation and sol–gel Methods were amongst of these methods [10, 11].
Herein, we studied the structural, optical and magnetic properties of new synthesized Zn0.5Mg0.5−XNiXFe2O4 nano-ferrites. In this work, we synthesized five different Zn0.5Mg0.5−XNiXFe2O4 samples by varying the concentration of nickel ion (x = 0.0, 0.1, 0.2, 0.3 and 0.4) using the co-precipitation method. The Sol–gel method was then used to prepare the samples yet again to study the effect of preparation method on the structural and properties of Zn0.5Mg0.5−XNiXFe2O4 nano-ferrite. Several techniques were used as analytical tools to study structural and physical properties of the samples such as x-ray diffraction (XRD), Fourier-transform infrared spectroscopy (FTIR), UV–vis spectroscopy and Vibrating Sample Magnetometer (VSM).
2. Materials and methods
The co-precipitation method was employed to synthesis Ni Mg zinc ferrite (Zn0.5Mg0.5−XNiXFe2O4) nanoparticles (where x = 0.0, 0.1, 0.2, 0.3 and 0.4). Fe (NO3)3·9H2O, Mg (NO3)2·6H2O, Zn (NO3)2·6H2O, Ni (NO3)2·6H2O and NaOH were used as raw materials in order to prepare the desired solution. Then, the solution was mixed up and stirred at 3000 rpm for 30 min to get a mixture with pH 11–13. Afterwards, water bath was used to keep the solution at 80 °C for 1 h to confirm the removal of sodium carbonate. The formed precipitate was washed various times with hot distilled water in order to maintain a pH to about 7 [12, 13]. This is followed by the samples been dried up and ground to powder. A Vulcan A-550 temperature-controlled oven was used at a heating rate of 10 °C min−1 to anneal the samples to 500 °C for 5 h.
The preparation of Zn0.5Mg0.5−XNiXFe2O4 (x = 0.0, 0.1, 0.2, 0.3 and 0.4) samples was repeated using sol–gel method. Mixture containing required metal ions were dissolved in 25ml distilled water. Then, 30 ml olive oil and 20 ml distilled water were stirred on a magnetic stirrer for half an hour for homogeneity, this is followed by the solutions added as drop wise. The obtained solution was stirred for 1 h with a magnetic stirrer- and was heated at 80 °C to condensate into a sol–gel and kindled in a self-inseminating to form powder [14]. A required amount of sodium hydroxide was added to modifying pH value to about 7. Agate mortar was used to ground the obtained powders and heated at 500 °C for six hours in a furnace to remove undesirable materials in the samples [15].
The crystal structure of prepared samples was verified by Shimadzu 6000 x-ray diffractometer. FTIR spectra of the samples were detected using Mattson, model 960m0016 spectra, while UV-visible absorption spectrum was recorded using 1240 spectrometer Shimadzu.
3. Results and discussion
3.1. XRD analysis
X-ray diffraction (XRD) was employed to obtain the phase and structural parameters of ferrite samples. The type of method used in the synthesis has significant influence in crystal structures of nanoparticles as well as the annealing temperature [16]. The information of Zn0.5Mg0.5−XNiXFe2O4 was confirmed by investigating the XRD pattern using MDI Jade 5.0 and Origin pro 8.6. Figures 1 and 2 show the x-ray diffraction patterns of Zn0.5Mg0.5−XNiXFe2O4 nanoparticles which was carried out at room temperature for samples with five nickel concentration (x = 0, 0.1, 0.2, 0.3 and 0.4) prepared by co-precipitation and so-gel methods, respectively. XRD peaks were reported at 2θ of 30.72°, 35.91°, 43.55°, 53.82°, 57.32° and 62.88° for the samples prepared by co-precipitation, while were found to be 30.72°, 36.01°, 43.55°, 53.83°, 57.31° and 62.88° for sol–gel samples which are attributed to (220), (311), (400), (422), (511), and (440) hkl planes as shown in figures 1 and 2. The crystal structure is ascribed as cubic phase of space group Fd-3m:1 for the samples of both methods and each peak is in accordance with standard reference pattern (JCPDS card number 73–1720). These hkl planes may indicated the growth of the pure fcc spinel structures of Zn0.5Mg0.5−XNiXFe2O4 nano-ferrite and the obtained peaks were found to be in agreement with the previous work [17]. The small shifting of the diffraction peaks in the direction of larger values of (2θ) could be attributed to replacement of Ni+2 ions. The sharpest peak connected to (311) plane and the full width at half maximum (FWHM) was related to the growth of the crystallites [18]. The average crystallite size, D was calculated using Debye-Scherer's equation [19]:

where β is FWHM of the XRD peak in radians, while θ and λ is the diffraction angle and the incident x-ray wavelength, respectively. Equation (1) was used to calculate the crystallite size and was found to be (19.15, 13.15, 12.75, 11.65 and 12.8 nm) for co-precipitation samples and (13.9, 15.05, 14.81, 21.9 and 21.9 nm) for sol–gel samples respectively. Table 1 reports the values of the crystallite size, lattice constants, density and volume of samples of both methods. The variation of crystallite size and lattice parameters with Ni concentration for the ferrite's nanoparticles were shown in figure 3. The crystallite size was found to decrease with Ni concentration in case of co-precipitation method as shown in figure 3(a). It might be due to the fact that the substitution of Mg refine the crystallite size. However, with the exception of sample with Ni concentration of 0.1, the opposite behavior is observed for samples of sol–gel method with different Ni concentration as shown in figure 3(b). Similar result with increase in crystallite size for samples prepared via sol–gel method was reported by Makiyyu Musa et al [20]. The increase in crystallite size figure 3(b) is related to the decrease in lattice parameter figure 3(d) through the repulsive force of unpaired surface electrons. According to Rajendran et al, this force becomes stronger with decreased lattice parameter which leads to expands in the particle size [21].
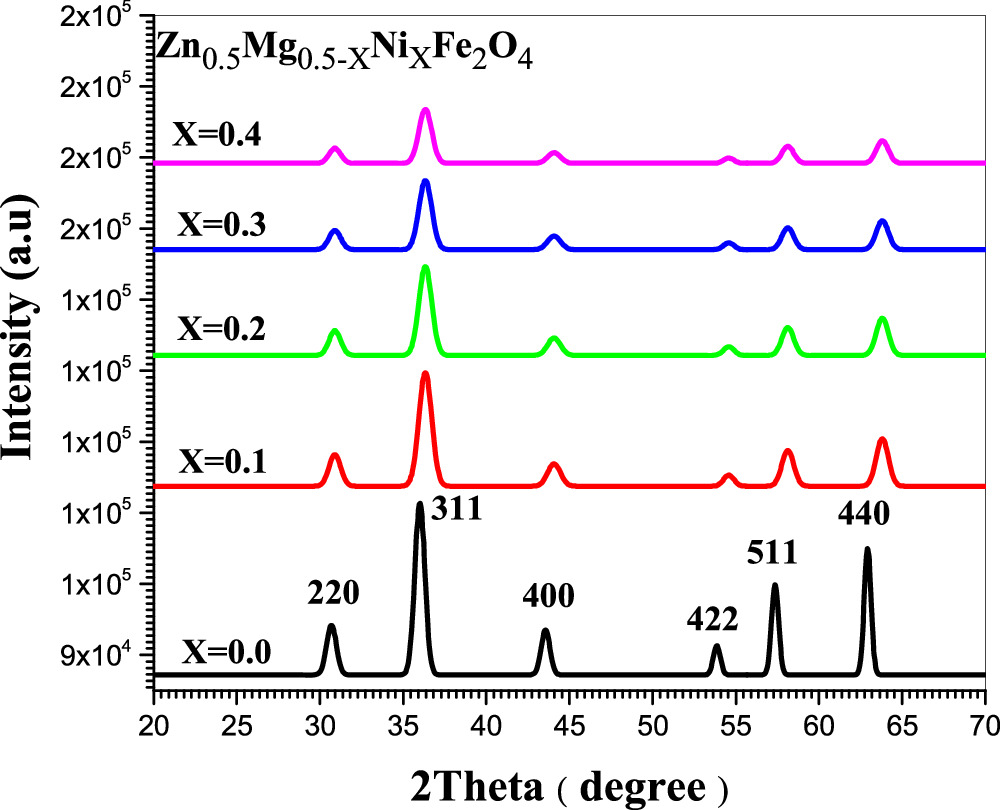
Figure 1. XRD patterns of Zn0.5Mg0.5−xNixFe2O4 nano-ferrite where x = 0, 0.1, 0.2, 0.3 and 0.4 synthesized by co-Precipitation method (XRD patterns matches well with JCPDS card number 73-1720).
Download figure:
Standard image High-resolution image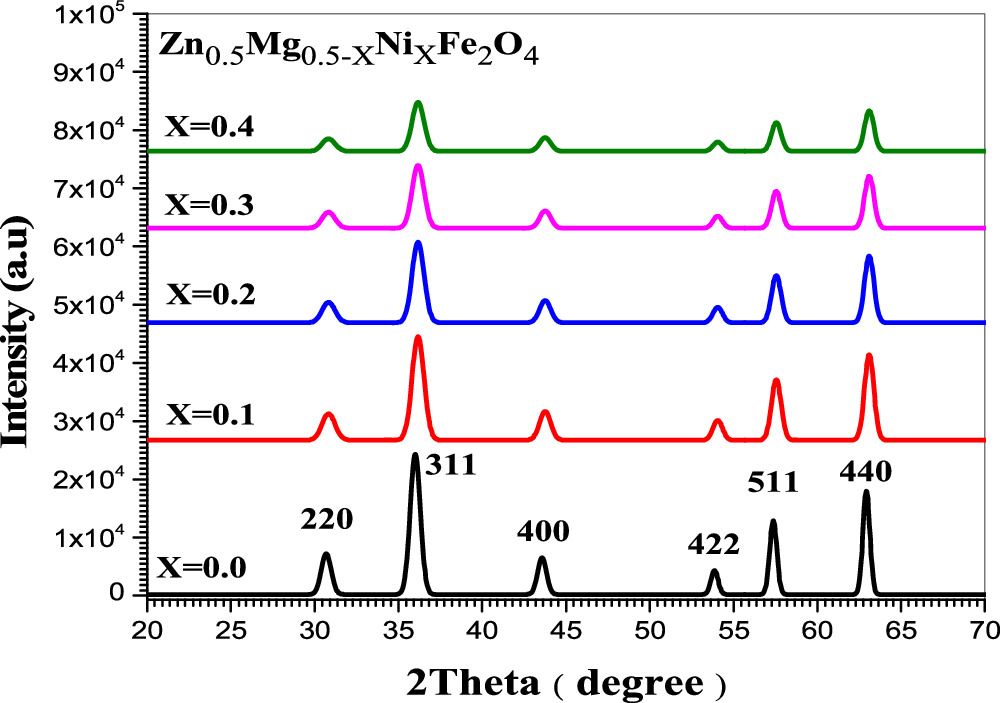
Figure 2. XRD patterns of Zn0.5Mg0.5−xNixFe2O4 nano-ferrite where x = 0, 0.1, 0.2, 0.3 and 0.4 synthesized by sol-gel method (XRD patterns matches well with JCPDS card number 73-1720).
Download figure:
Standard image High-resolution imageTable 1. Crystallite size (D), Lattice constant (a), Density and Volume of Zn0.5Mg0.5−xNixFe2O4 nano-ferrites synthesized by co-precipitation and sol–gel methods.
| Parameters | Zn0.5Mg0.5Fe2O4 | Zn0.5Mg0.4Ni0.1Fe2O4 | Zn0.5Mg0.3Ni0.2Fe2O4 | Zn0.5Mg0.2Ni0.3Fe2O4 | Zn0.5Mg0.1Ni0.4Fe2O4 | |||||
|---|---|---|---|---|---|---|---|---|---|---|
| co-prec. | Sol | co-prec. | Sol. | co-prec. | Sol. | co-prec. | Sol. | co-prec. | Sol. | |
| Crystallite size (nm) | 19.15 | 13.90 | 13.15 | 15.05 | 12.75 | 14.81 | 11.65 | 21.90 | 12.80 | 21.90 |
| Lattice parameter (Å) | 8.327 | 8.323 | 8.306 | 8.325 | 8.302 | 8.321 | 8.298 | 8.317 | 8.292 | 8.311 |
| Density(g cm−3) | 4.543 | 4.529 | 4.576 | 4.538 | 4.580 | 4.546 | 4.584 | 4.558 | 4.591 | 4.563 |
| Volume (10−10)3 | 576.5952 | 576.5952 | 521.9650 | 572.0557 | 532.0453 | 566.3548 | 549.7141 | 554.7403 | 553.9153 | 549.6373 |
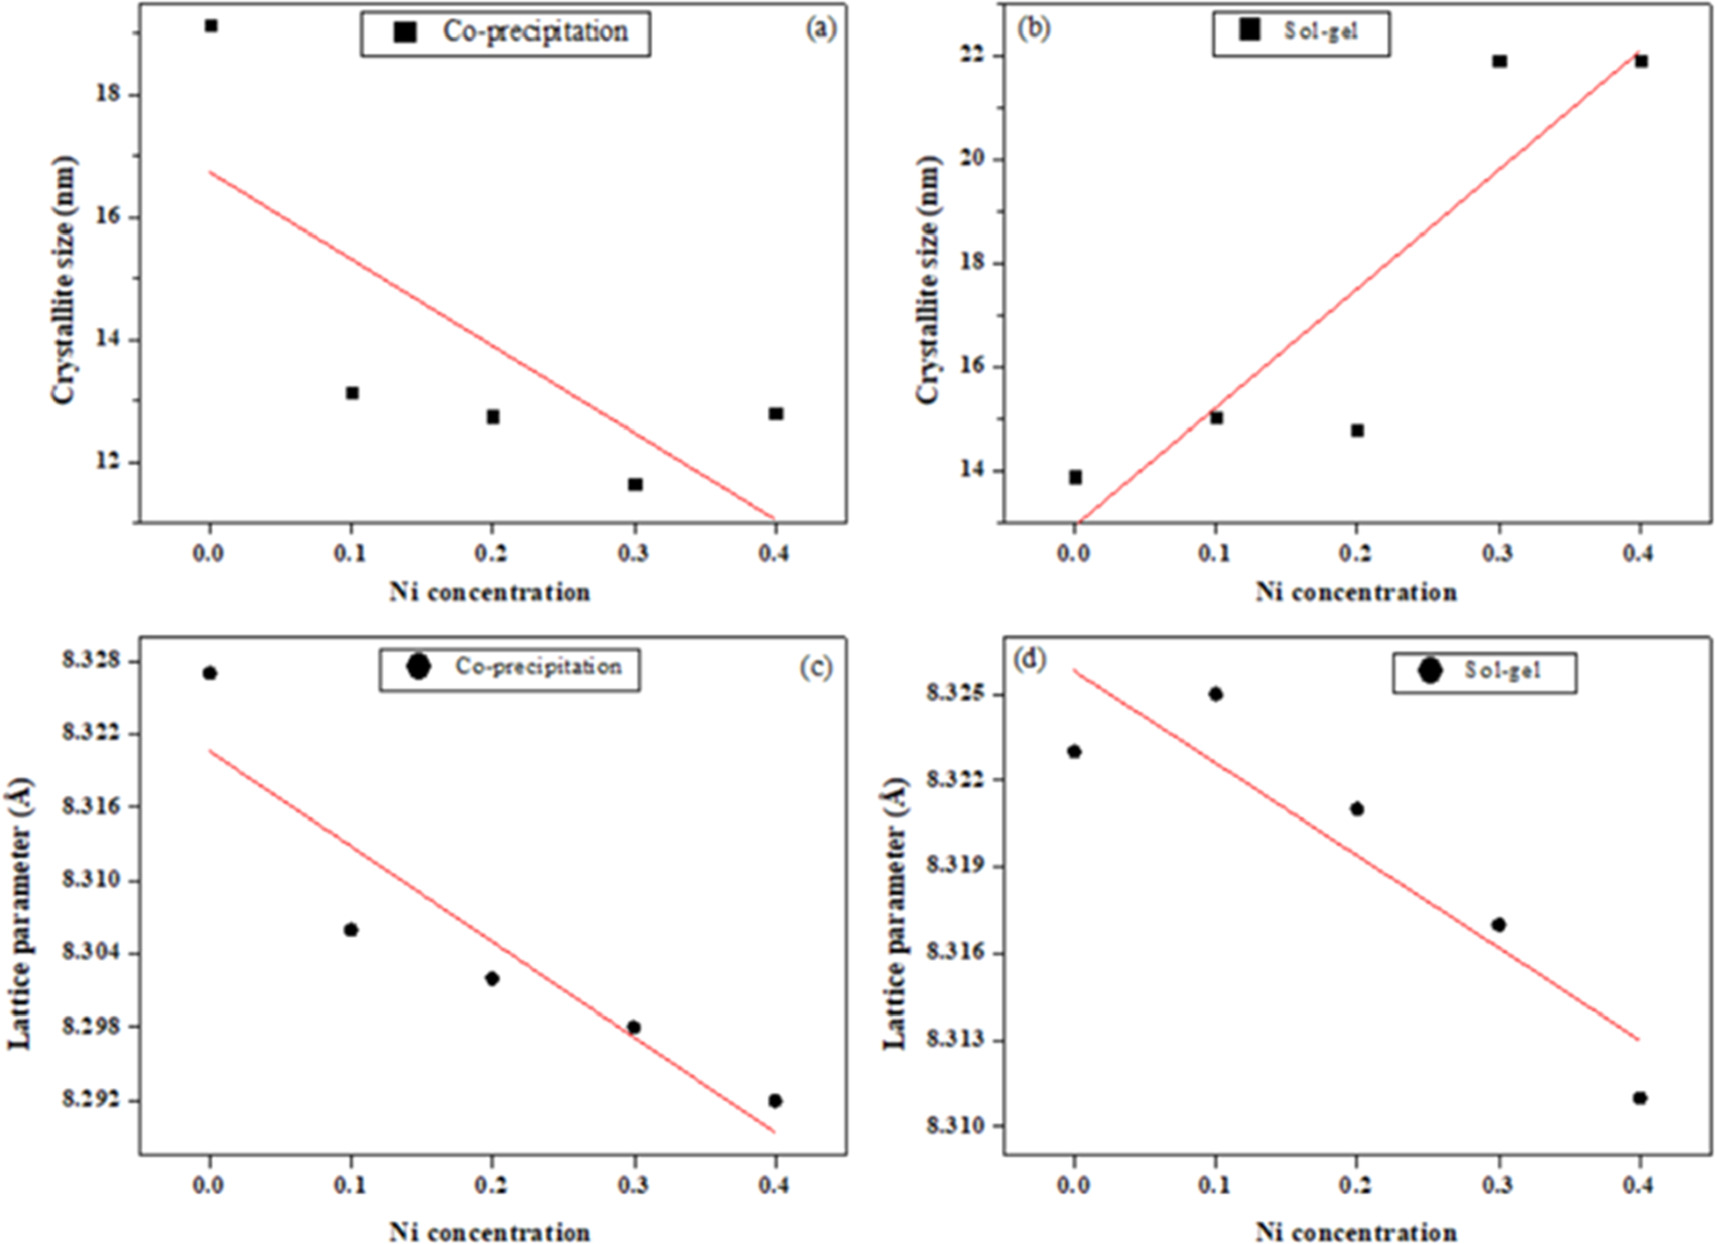
Figure 3. Show the variation of crystallite size with Ni concentration for (a) co-precipitation and (b) sol-gel method. The variation of lattice parameter with Ni concentration for (c) co-precipitation and (d) sol-gel methods.
Download figure:
Standard image High-resolution imageThe lattice parameter (a) was calculated using MDI Jade 5.0 program and the following equation [22]:

where d and h, k, l is the lattice spacing and the Miller indices, respectively.
The unit cell volume was measured using the relation (V = a3) [23]. The lattice constants obtained ranged (8.327–8.292 Å) for co-precipitation and (8.323–8.311 Å) for sol–gel samples. It can be observed from figures 3(c) and (d) that the lattice parameter is decreased for both methods with increasing of Ni concentration in Zn0.5NixMg0.5−xFe2O4. The variation of lattice parameter with Ni concentration can be understood based on the ionic radii of both Ni+2 and Mg+2 ions where Ni+2 ions have ionic radius of (0.69 Å) while Mg+2 ions is (0.60 Å) in the octahedral sites [24, 25]. Thus, the replacement of the Ni ions by the Mg ions may cause little reduction of unit cell dimensions, thereby decreasing the lattice parameter. Furthermore, many metal oxides exhibit a decrease in lattice parameters with a decrease in particle size. This reduction in lattice parameter may be due to cation/anion vacancies, finite size effect or lattice stress. Previous works with a similar variation of lattice parameter were reported for Ni ferrite nanoparticles [26, 27]. Regarding the structural outcomes, it may suggest that co-precipitation method is preferred over sol–gel method for more refined structure.
3.2. Morphology
Scanning electron microscopy was used to accurately estimate the microstructure and morphology of Zn0.5NixMg0.5−xFe2O4 nanoparticles. Figures 4 and 5(a)–(e) show the SEM micrographs of Zn0.5NixMg0.5−xFe2O4 nano-ferrite samples prepared by both co-precipitation and sol–gel method, respectively. It can be observed from figures 4 and 5 that all samples revealed arrangement of homogeneous nanoparticles with granular [28]. For both methods, the micrographs showed nanostructure and agglomerated spherical particles for samples with x = 0 (figures 4(a) and 5(a)). In comparison with those of the ferrites with x = 0.1 to 0.4 (figures 4 and 5(b)–(e)) the grain appeared as agglomerated particles. The samples revealed ferrite nanoparticles of nearly a spherical shape and uniformly distributed while the size was ranged 7–29 nm for all samples. This difference in average particle size and particle diameter may arise from the effect of relatively ionic radius of Mg+2 (60 Å) ions substituted by Ni+2 (69 Å) ions in the octahedral sites [22]. An additional reason for the difference in average particle size could be the type of selected method of preparation. The existence of magnetic interactions among the particles may lead to the agglomeration of nanoparticles [29]. Besides, the formation of a microstructure with particles of random size is also noted in which small particles preferred the formation of soft agglomerates. The surface tension increased with smaller particles which generates driving force to increase of the state of agglomeration and aggregation [30].
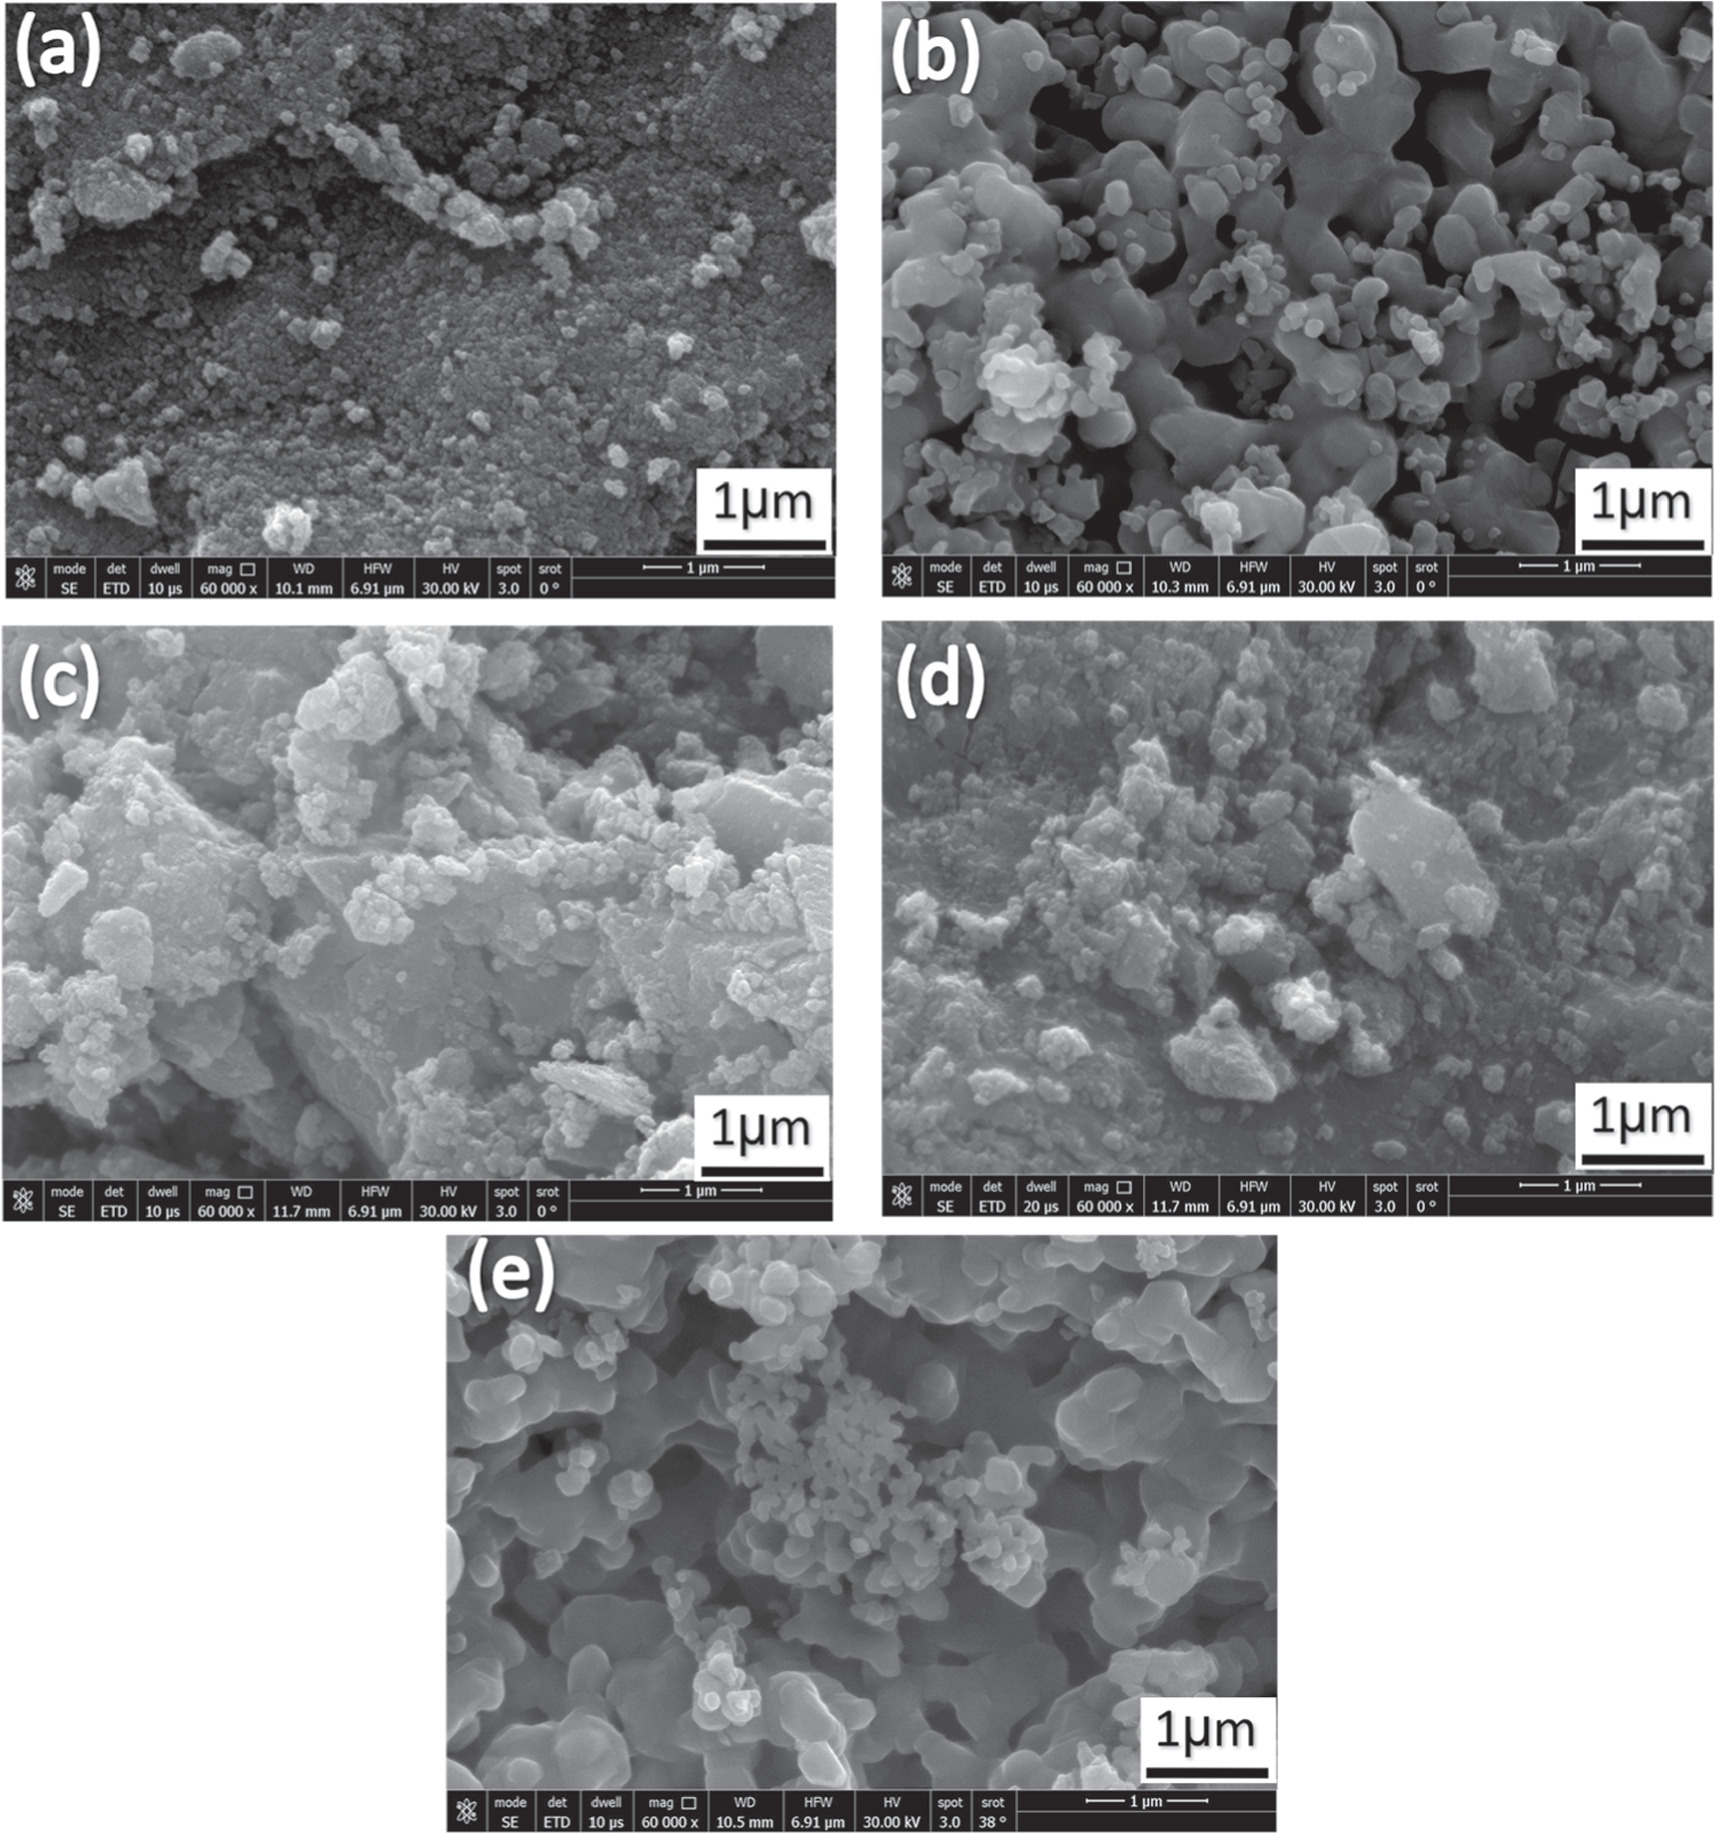
Figure 4. SEM micrographs of Zn0.5Mg0.5−xNixFe2O4 nano-ferrite synthesized by co-precipitation method where x = 0, 0.1, 0.2, 0.3, and 0.4 for images a, b, c, d and e, respectively.
Download figure:
Standard image High-resolution image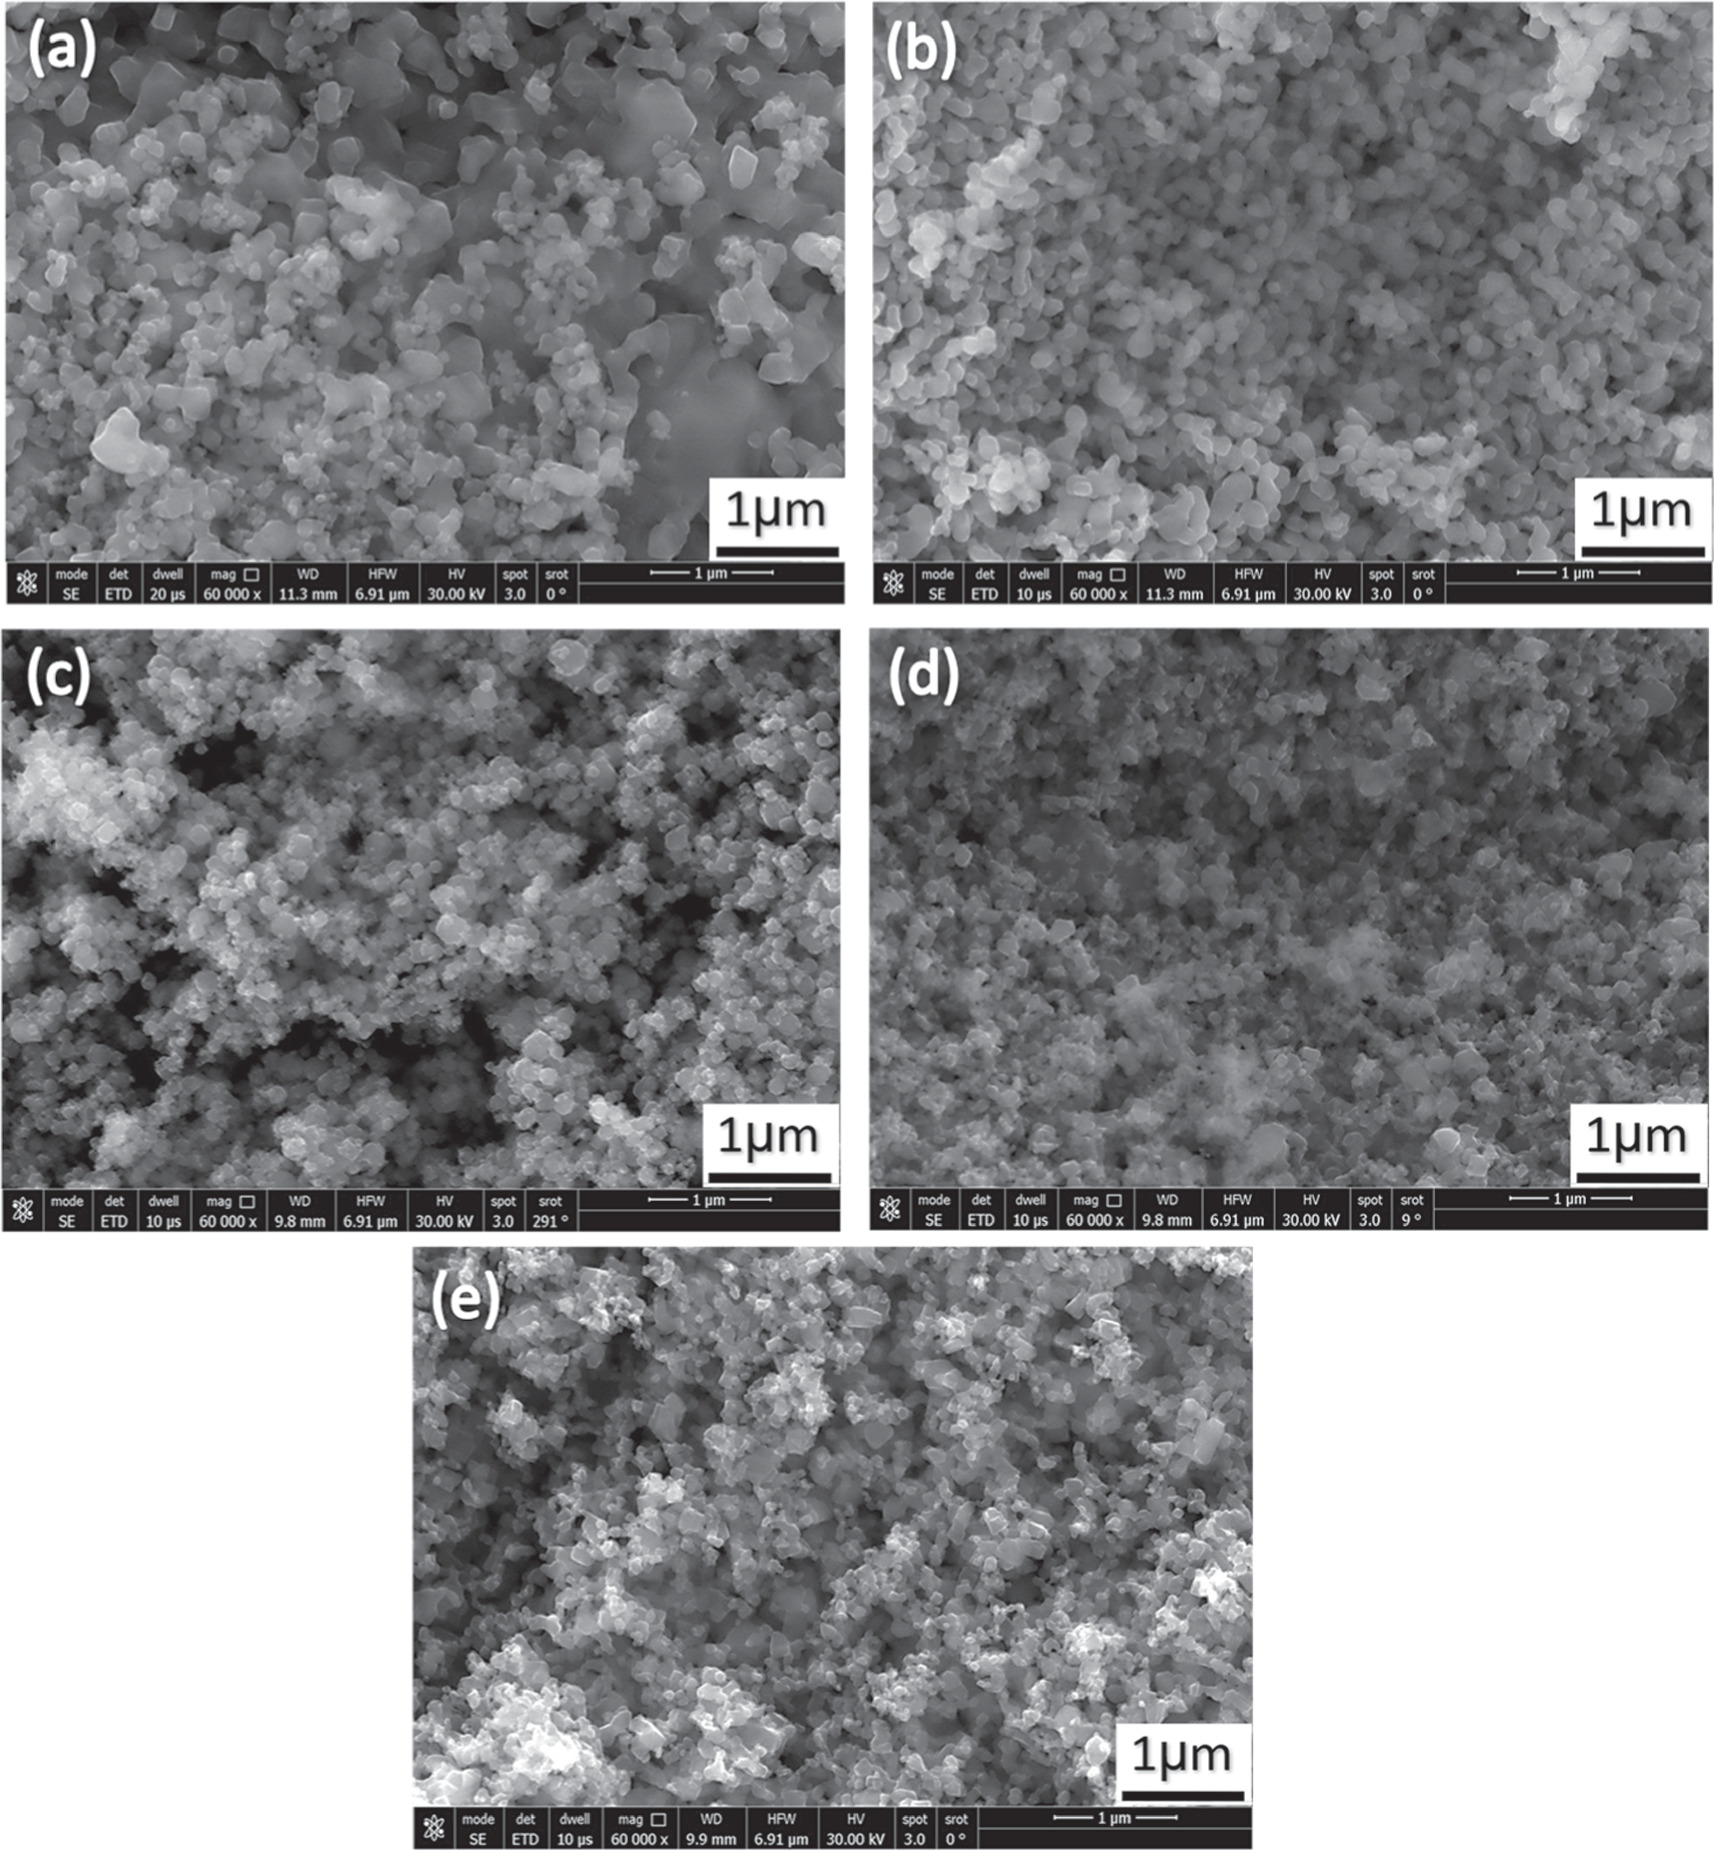
Figure 5. SEM micrographs of Zn0.5Mg0.5−XNiXFe2O4nano-ferrite synthesized by sol-gel method where x = 0, 0.1, 0.2, 0.3, and 0.4 for images a, b, c, d and e, respectively.
Download figure:
Standard image High-resolution image3.3. FTIR analysis
Fourier-transform infrared spectroscopy of Zn0.5NixMg0.5−xFe2O4 (x = 0.0, 0.1, 0.2, 0.3 and 0.4) samples prepared using co-precipitation and sol–gel method was presented in figures 6 and 7. The FTIR frequency bands for different Ni concentration were reported in table 2 for samples of both methods of preparations. An insignificant shift was observed in the peaks of the two methods of preparation. In the case of co-precipitation method, the observed FTIR peak at 2427 cm−1 was assigned to stretching vibration of O-H group [31]. The free absorbed water may indicate the presence of hydroxyl groups in the samples, which was reported in previously published works [32, 33]. For samples of both methods, the sharp peaks at the range of (1621 and 1350) cm−1 are assigned to stretching vibration of (M-O), which may indicate the formation of the metal-oxygen in the ferrite samples [34]. The peaks observed around 1110–1157cm−1 may indicate the coordination of oxygen atoms [35]. Two absorption bands were detected with low intensity in the range of (850–400 cm−1), which could be allocated to the intrinsic stretching vibrations of the tetrahedral and octahedral sites. According to Rashmi Tiwari et al [36] this confirmed the existence of the cubic spinel phase in the nanoferrites. Accordingly, it can be inferred that the prepared samples have spinel structure which is in conformity with the result of the XRD analysis. Similar result was found by Yanchun Zhang et al for their Ni-Mg-Zn ferrite samples [37].

Figure 6. FTIR spectroscopy of Zn0.5Mg0.5−xNixFe2O4 nano-ferrite synthesized by co-Precipitation method.
Download figure:
Standard image High-resolution image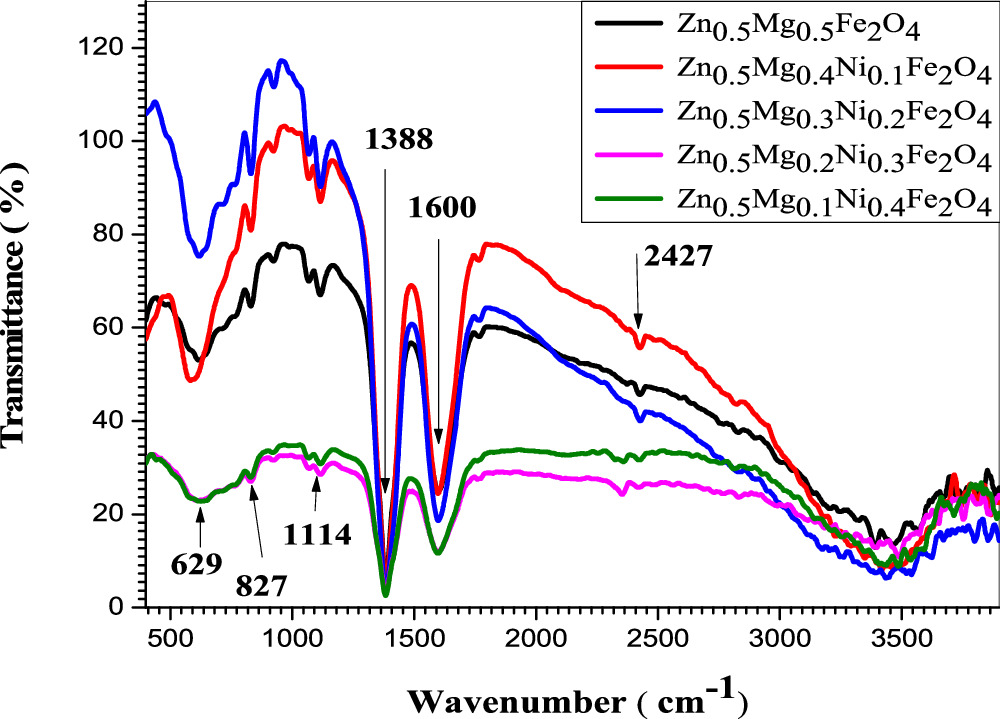
Figure 7. FTIR spectroscopy of Zn0.5Mg0.5−xNixFe2O4 nano-ferrite synthesized by sol-gel method.
Download figure:
Standard image High-resolution imageTable 2. Wave numbers (cm−1) of Zn0.5Mg0.5−xNixFe2O4 nano-ferrites synthesized by co-precipitation and sol–gel methods.
| sample | ν1 | ν2 | ν3 | ν4 | ν5 | ν6 | ||||||
|---|---|---|---|---|---|---|---|---|---|---|---|---|
| co-prec. | Sol | co-prec. | Sol | co-prec. | Sol | co-prec. | Sol | co-prec. | Sol | co-prec. | Sol | |
| Zn0.5Mg0.5Fe2O4 | 629 | 629 | 827 | 827 | 1114 | 1114 | 1388 | 1388 | 1600 | 1600 | 2427 | 2427 |
| Zn0.5Mg0.4Ni0.1Fe2O4 | 629 | 629 | 827 | 827 | 1114 | 1114 | 1388 | 1388 | 1600 | 1600 | 2427 | 2427 |
| Zn0.5Mg0.3Ni0.2Fe2O4 | 629 | 629 | 827 | 827 | 1114 | 1114 | 1388 | 1388 | 1600 | 1600 | 2427 | 2427 |
| Zn0.5Mg0.2Ni0.3Fe2O4 | 629 | 629 | 827 | 827 | 1114 | 1114 | 1388 | 1388 | 1600 | 1600 | 2427 | 2427 |
| Zn0.5Mg0.1Ni0.4Fe2O4 | 629 | 629 | 827 | 827 | 1114 | 1114 | 1388 | 1388 | 1600 | 1600 | 2427 | 2427 |
3.4. UV visible analysis
Figures 8 and 9 show the absorbance as a function of wavelength for the samples of Zn0.5NixMg0.5−xFe2O4 nano-ferrite prepared using co-precipitation and sol–gel methods (x = 0, 0.1, 0.2, 0.3 and 0.4). The absorption band was obtained at wavelength (197.2 nm) for co-precipitation samples, while for sol–gel samples the absorption was found to be at (255.19 nm). The Tauc formula derived the energy band gap Eg (αhυ)2 as function of incident energy (hυ). This formula was used to determine the optical properties of nano ferrites [34]. The optical gap related to the Zn0.5NixMg0.5−xFe2O4 nano-ferrites is determine from the intercept of the linear trend observed in the spectral dependence of (αhυ)2 in a narrow range of photon energies with x-axis. The absorption coefficient α in many nano ferrites generally obeying the following relation [38]:

where, α is the absorption coefficient and A is the edge width parameter, Eg is the energy band gap, while (hυ) is the incident photon energy and n is the constant reliant on the degree of transition which has 1/2, 1 or 2 values and the value 1/2 was selected in this study. Based on the maximum absorption band, the band gap energy was calculated by [39]:


Figure 8. Absorbance of Zn0.5Mg0.5−xNixFe2O4 nano-ferrite synthesized by co-Precipitation method.
Download figure:
Standard image High-resolution image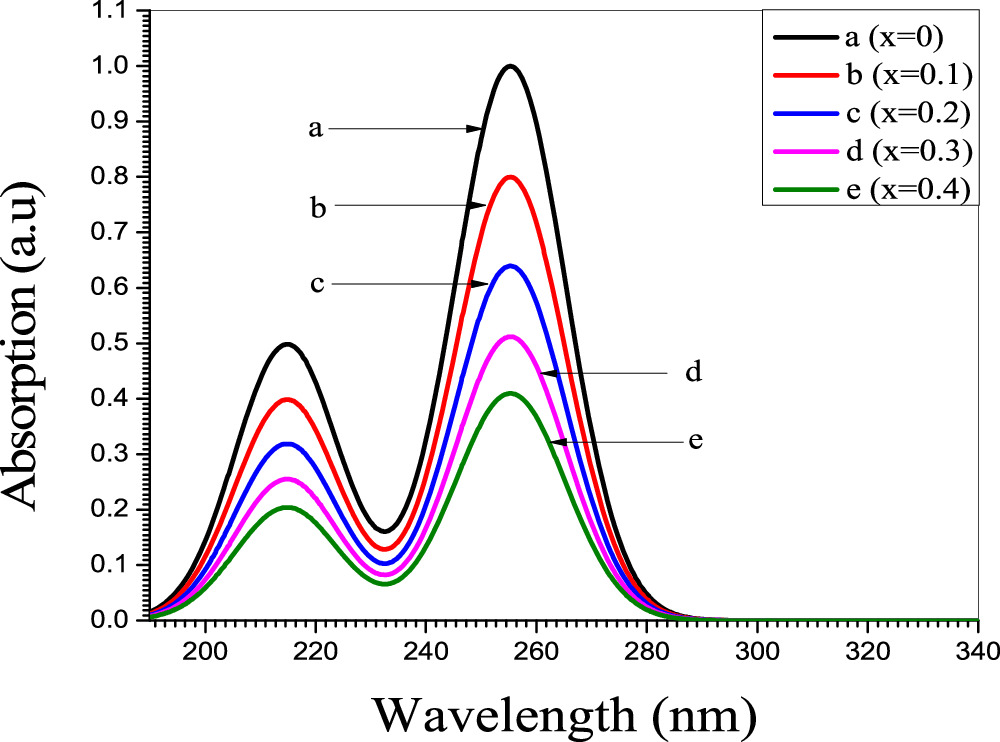
Figure 9. Absorbance of Zn0.5Mg0.5−xNixFe2O4 nano-ferrite synthesized by sol-gel method.
Download figure:
Standard image High-resolution imageThe absorption coefficient α is given by [40]:

Where A is absorption and d is particle size which is determined by Scherrer relation. The band gap was calculated by plotting (hυ) against (αhυ)2 and extrapolating the tangent on the x-axis (Tauc plots). Figures 10 and 11 show the optical band gap energy of Zn0.5NixMg0.5−xFe2O4 nano-ferrite synthesized by co-precipitation and sol–gel methods as a function of the incident energy and it is value was found to be 6.04, 6.05, 6.06, 6.07 and 6.08 eV for co-precipitation samples and 4.44, 4.46, 4.47, 4.49 and 4.50 eV for sol–gel samples. The absorbance, absorption coefficient, wavelength and energy band gap were demonstrated in table 3. The absorbance of the samples synthesized by co-precipitation was 1.00, 0.85 0.72, 0.62 and 0.53 a.u, while for sol–gel method samples was 1.00, 0.80, 0.64, 0.51 and 0.20 a.u. The absorption coefficient was found to decrease with the increase of nickel concentration and was found to be 329.7, 281.1, 238.2, 202.5 and 172.4 cm−1 and 329.6, 263.8, 210.5, 169.02 and 135.03 cm−1 for co-precipitation and sol–gel samples respectively.
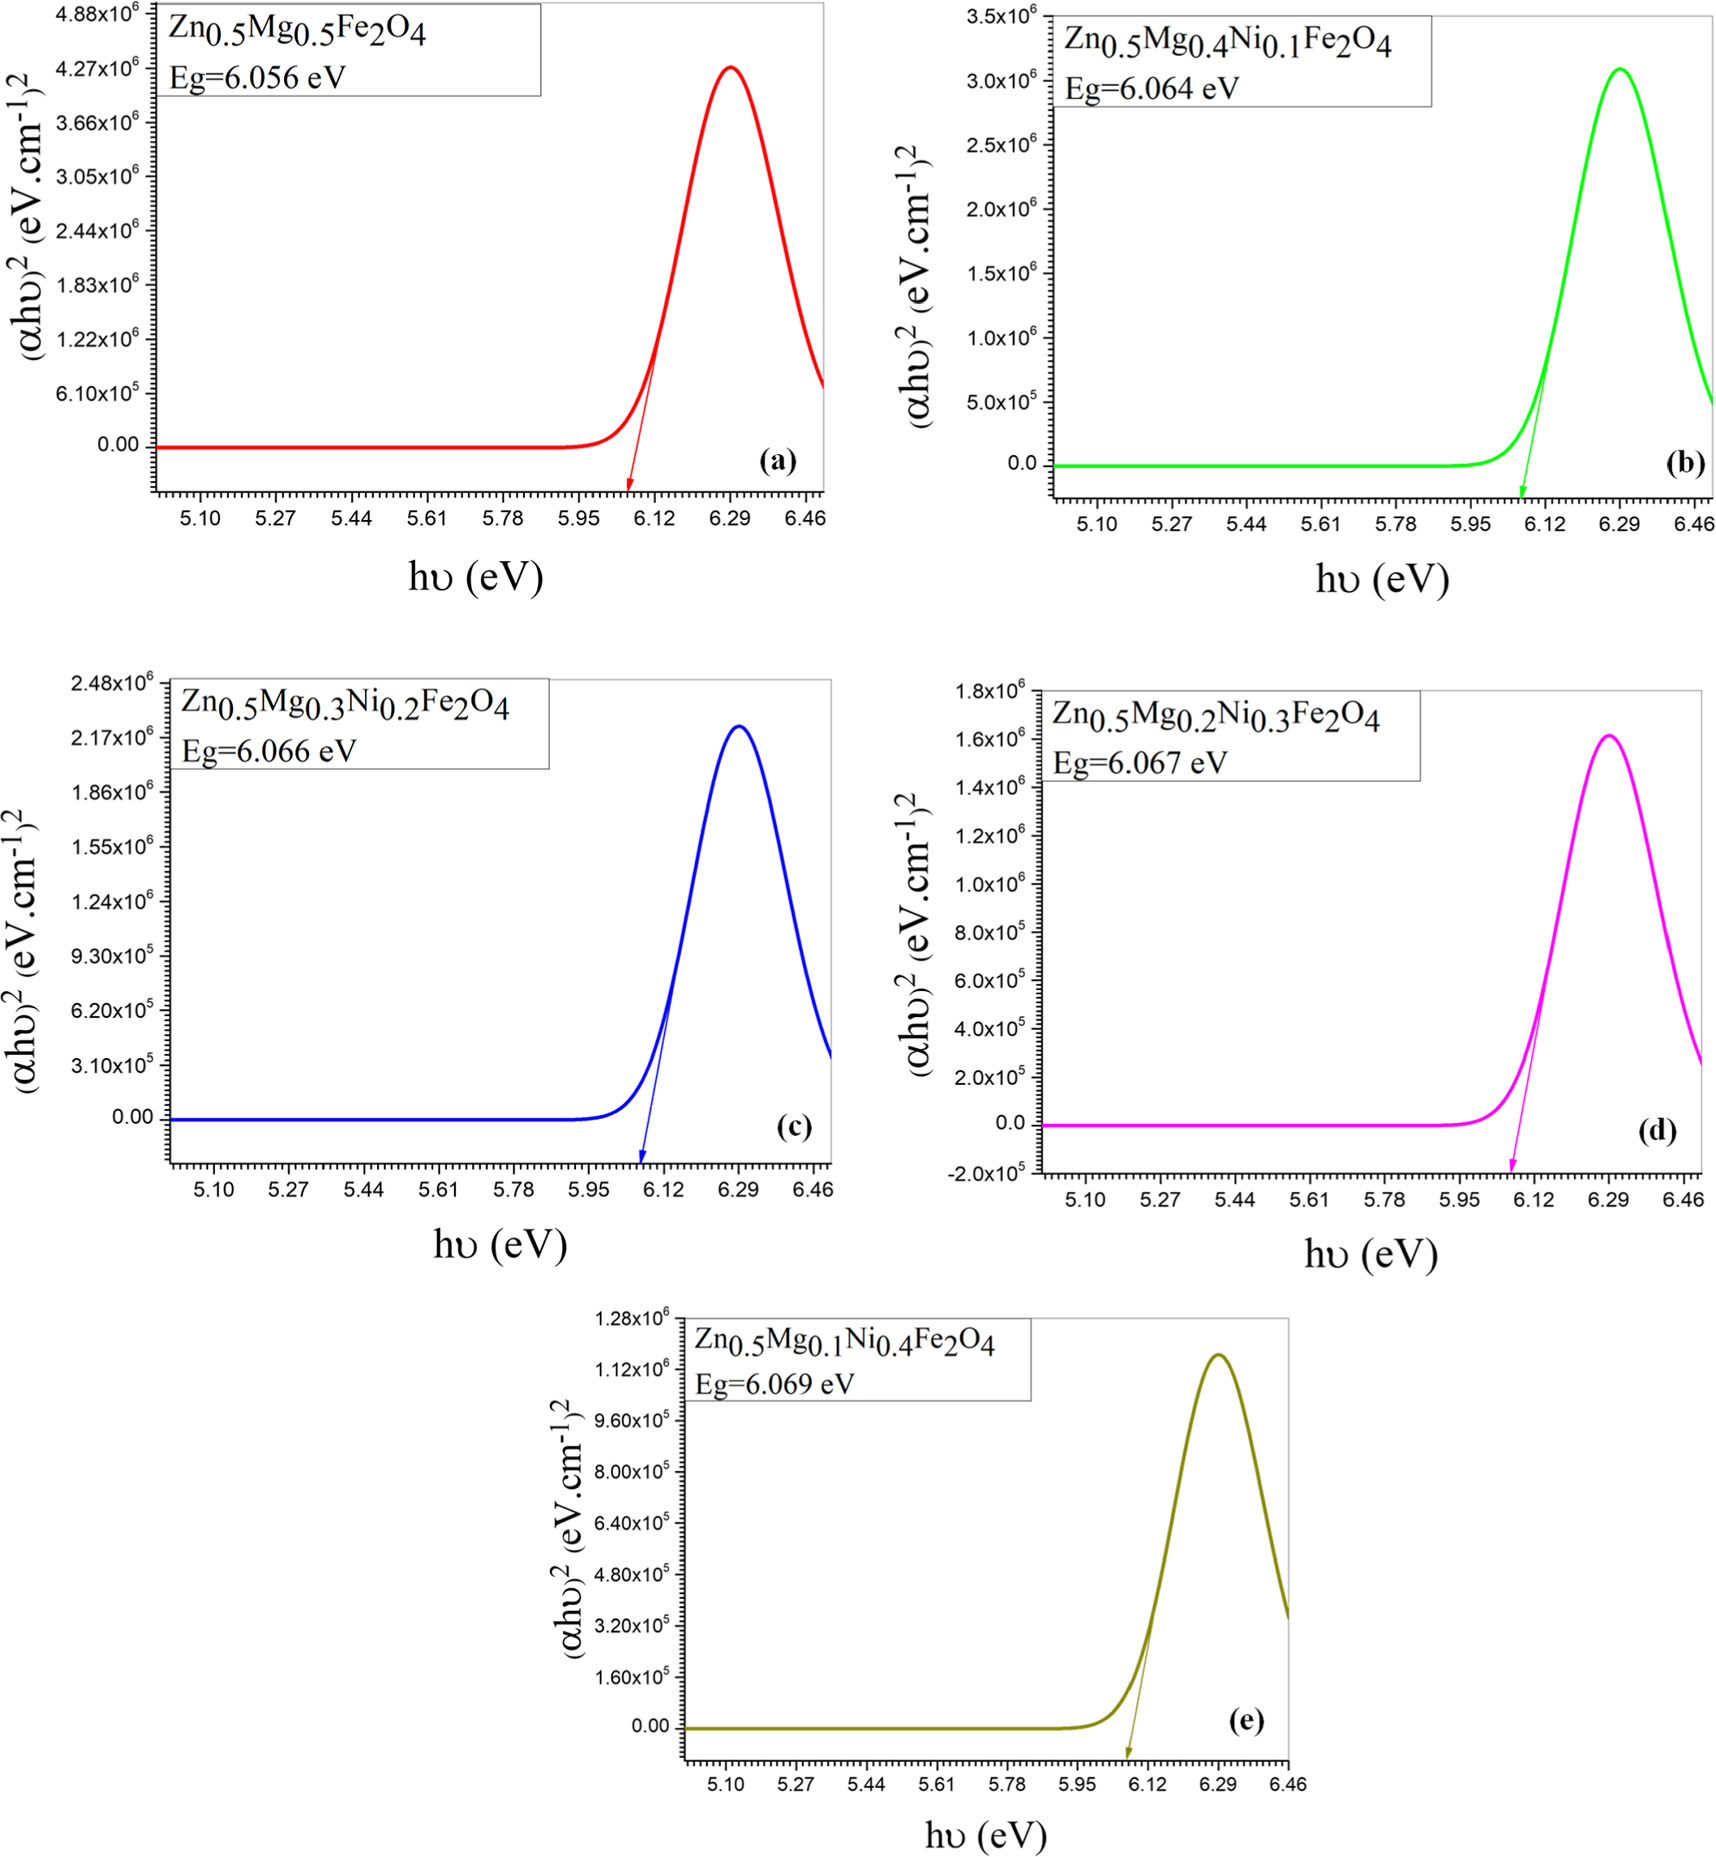
Figure 10. Optical energy band gab of Zn0.5Mg0.5−xNixFe2O4 synthesized by co- Precipitation method for different Ni concentration; (a) x =0.0, (b) x = 0.1, (c) x = 0.2, (d) x = 0.3 and (e) x = 0.4.
Download figure:
Standard image High-resolution image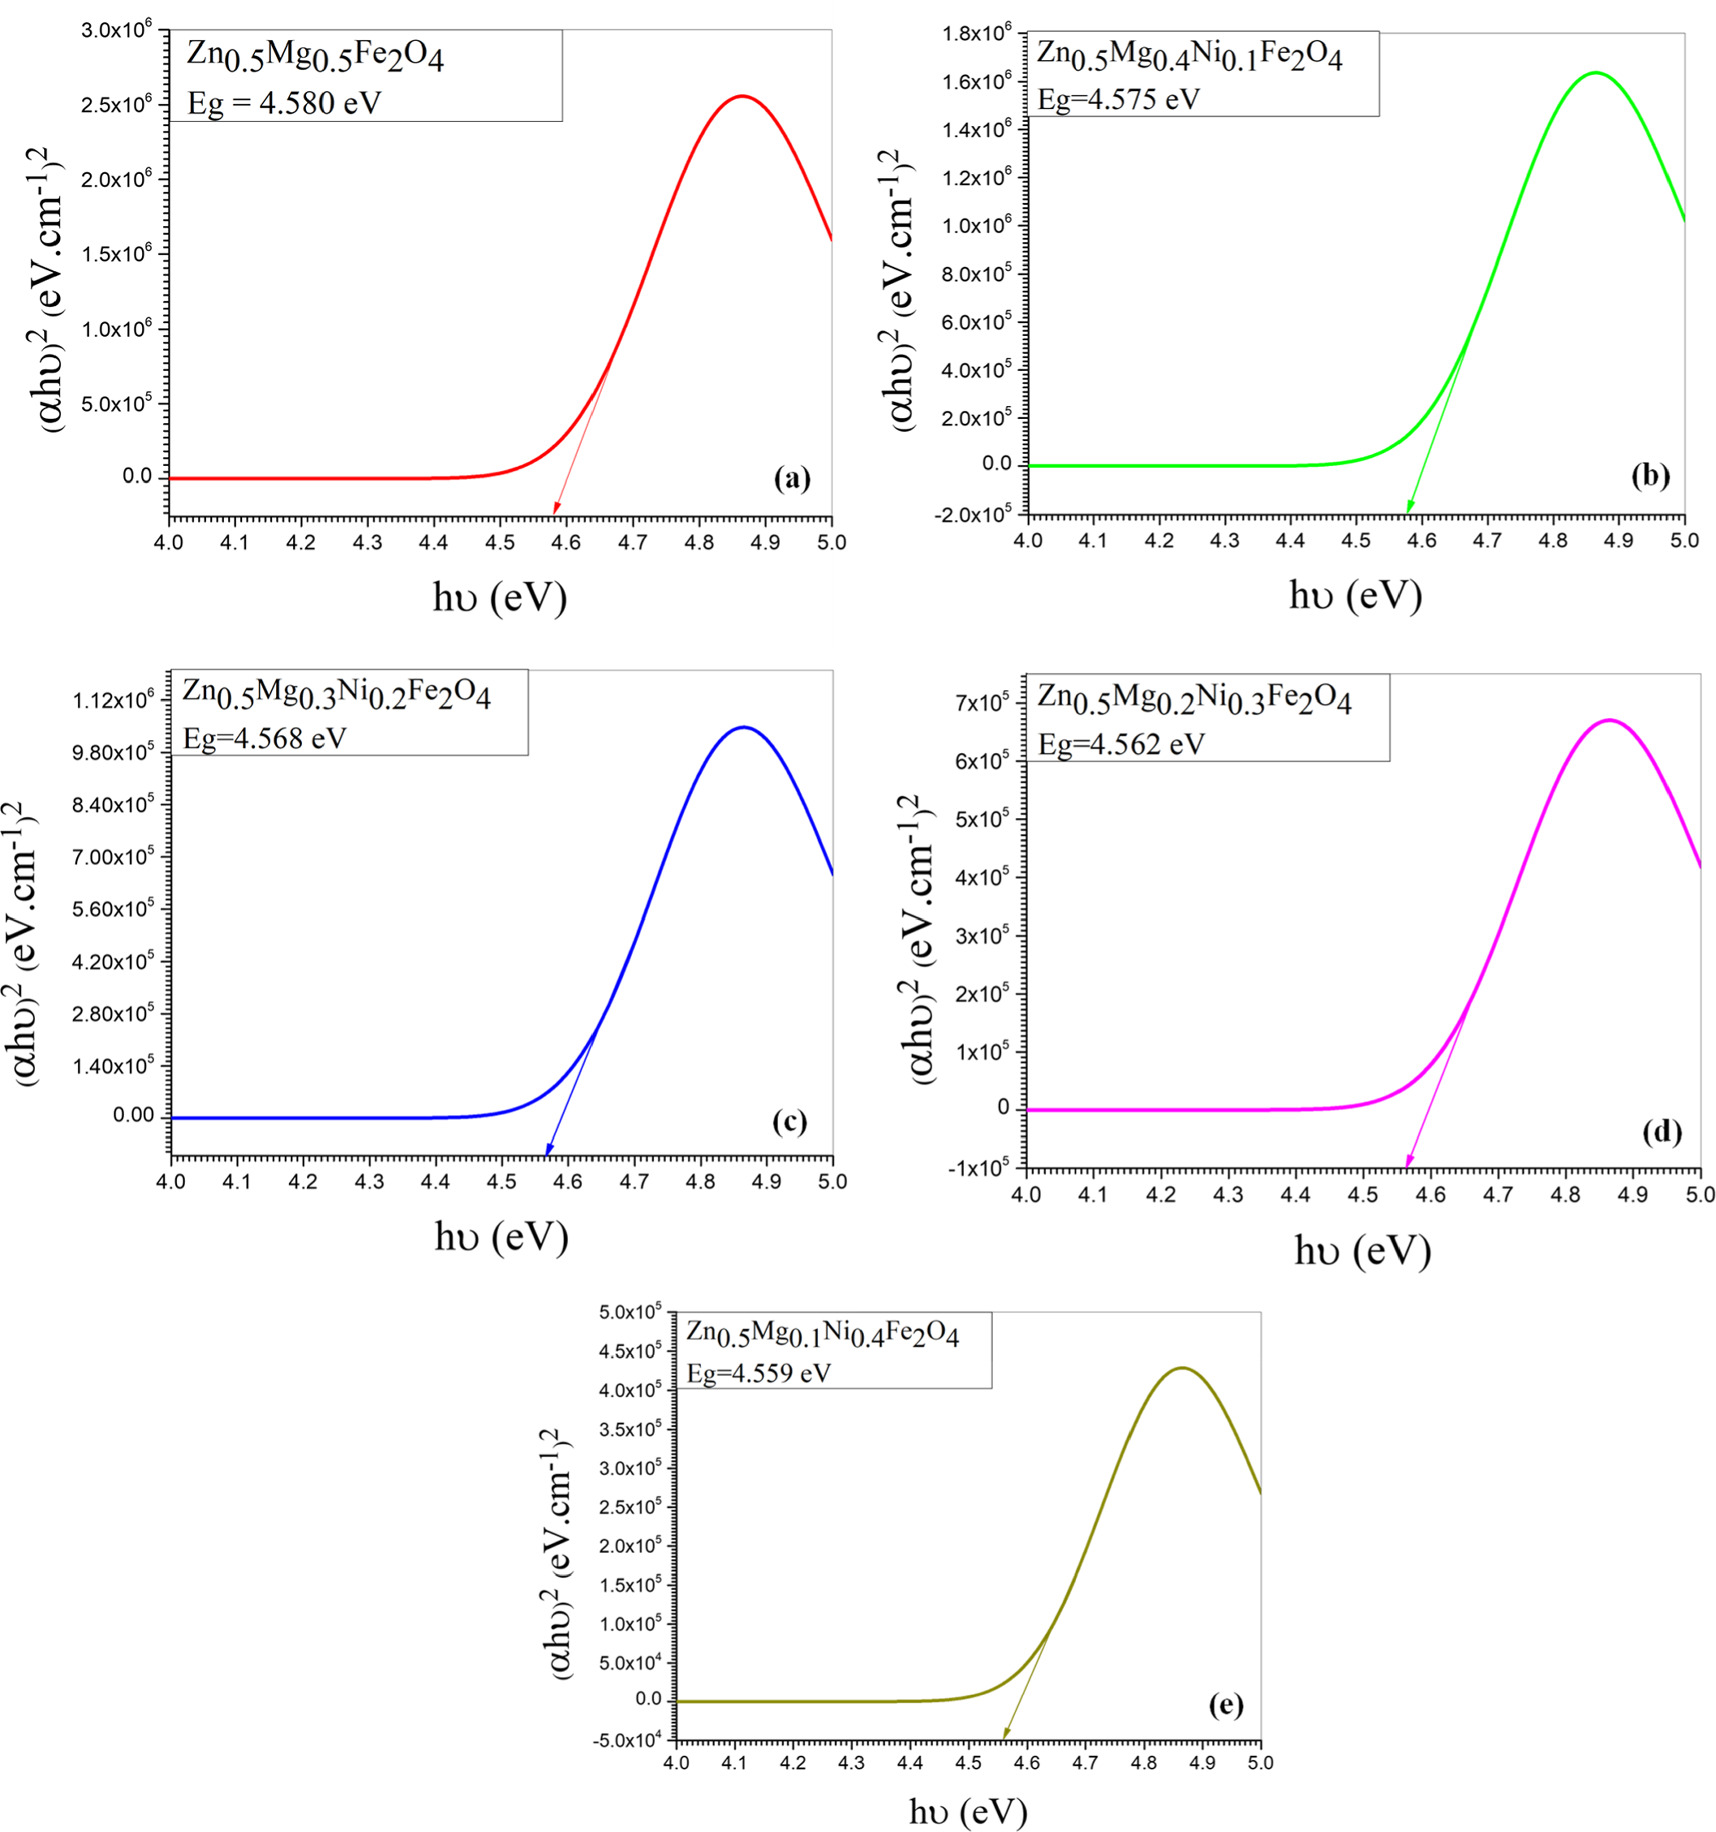
Figure 11. Optical energy band gab of Zn0.5Mg0.5−xNixFe2O4 synthesized by co- sol-gel method for different Ni concentration; (a) x = 0.0, (b) x = 0.1, (c) x = 0.2, (d) x = 0.3 and (e) x = 0.4.
Download figure:
Standard image High-resolution imageTable 3. Absorption (A), absorption coefficient (α), wavelength ( λ ) and Energy band gap (Eg) of Zn0.5NixMg0.5−xFe2O4 nano-ferrites synthesized by co-precipitation and sol–gel methods.
| sample | A (a.u) | α (cm−1) | λ (nm) | Eg (eV) | ||||
|---|---|---|---|---|---|---|---|---|
| co-prec. | Sol | co-prec. | Sol | co-prec. | Sol | co-prec. | Sol | |
| Zn0.5Mg0.5Fe2O4 | 1.002 | 1.0 | 329.7 | 329.6 | 197.2 | 255 | 6.04 | 4.44 |
| Zn0.5Mg0.4Ni0.1Fe2O4 | 0.850 | 0.80 | 281.1 | 263.8 | 197.2 | 255 | 6.05 | 4.46 |
| Zn0.5Mg0.3Ni0.2Fe2O4 | 0.720 | 0.64 | 238.2 | 210.9 | 197.2 | 255 | 6.06 | 4.47 |
| Zn0.5Mg0.2Ni0.3Fe2O4 | 0.620 | 0.51 | 202.5 | 168.0 | 197.2 | 255 | 6.07 | 4.49 |
| Zn0.5Mg0.1Ni0.4Fe2O4 | 0.530 | 0.41 | 172.4 | 135.2 | 197.2 | 255 | 6.08 | 4.50 |
For both methods, the results show that the energy band gap increases slightly with Ni0. It is suggested that the band gap energy can be changed by different factors such as crystallite size, structural parameter, and presence of impurities [41]. The increase in case of co-precipitation samples may attributed to the smaller crystallite size with increase in nickel concentration. This is supported by the quantum confinement theory, which suggests that the holes in the valence band and the electrons in the conduction band are confined by the potential barriers of the surface or potential well of quantum box [42]. The band gap energy increases between the valence band and the conduction band with decreasing the particle size due to the confinement of the electrons and holes [43]. This effect is more obvious in smaller nanoparticles and for materials with a large band gap. As the size of the nanoparticles increases the band gap approaches the value of the bulk material. In addition, the increase of the energy band gap for the samples may be due to decrease in lattice constant which is consider one of the factors that affects the size of the band gap of a material. As interatomic distance decreases, extra energy is required to set free the valence electrons in the conduction band. Therefore, a direct result of decreasing the lattice constant is the increase in the energy gap.
3.5. Magnetic properties
The magnetic properties are strongly dependent on the doping, sintering, and synthesis methods. According to Almessiere et al [17] the magnetic characteristics of spinel ferrites samples are affected by several factors, such as synthesis route, cations distribution on tetrahedral and octahedral sites, doping of nickel with magnesium and crystallite size. Therefore, to verify the existence of a magnetic order in our ferrite nanoparticles, the Saturation magnetization (Ms), coercive field (coercivity) (Hc) and remanent magnetization (retentivity) (Mr) of Zn0.5Mg0.5−XNiXFe2O4 nano-ferrite samples (x = 0.0, 0.1, 0.2, 0.3 and 0.4) were investigated using VSM to examine the magnetic properties of the samples. Figures 12 and 13 show the magnetic hysteresis curve of Zn0.5Mg0.5−XNiXFe2O4 nano-ferrite synthesized using co-precipitation and sol–gel, respectively. The magnetic parameters as saturation magnetization Ms, coercivity Hc, remnant magnetization Mr and loop squareness ratio (Mr/Ms) were quantified at the room temperature and hysteresis loop for different concentrations of Ni+2 ions are demonstrated in table 4.
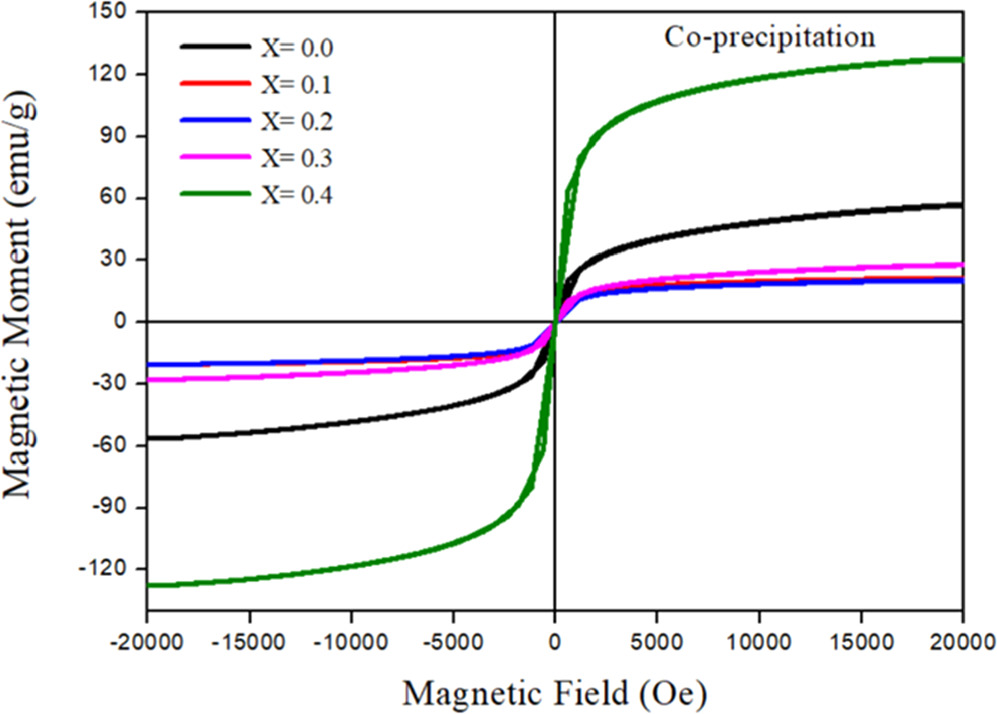
Figure 12. Magnetic curve of Zn0.5NixMg0.5−xFe2O4 synthesized using co-precipitation method where x = 0, 0.1, 0.2, 0.3 and 0.4.
Download figure:
Standard image High-resolution image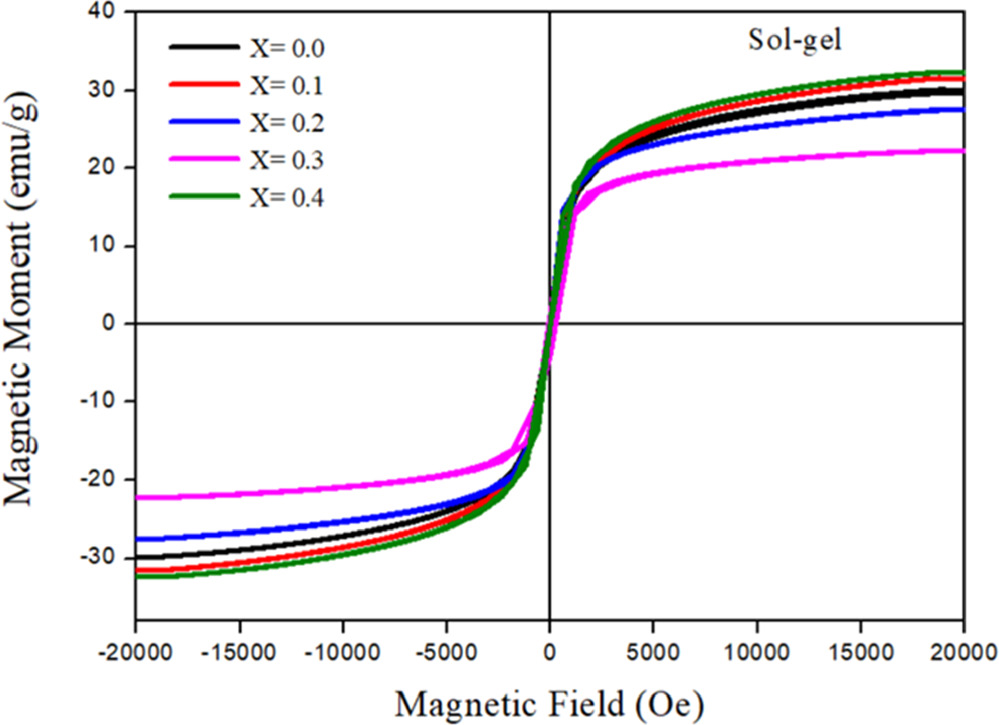
Figure 13. Magnetic curve of Zn0.5NixMg0.5−xFe2O4 synthesized using sol-gel method where x = 0, 0.1, 0.2, 0.3 and 0.4.
Download figure:
Standard image High-resolution imageTable 4. Saturation magnetization (Ms), remanent magnetization (Mr), squareness ratio (Mrs), coercivity (Hc) and magnetocrytalline anisotropy constant K1 of Zn0.5NixMg0.5−xFe2O4 nano-ferrites synthesized by co-precipitation and sol–gel methods.
| Parameters | Zn0.5Mg0.5Fe2O4 | Zn0.5Mg0.4Ni0.1Fe2O4 | Zn0.5Mg0.3Ni0.2Fe2O4 | Zn0.5Mg0.2Ni0.3Fe2O4 | Zn0.5Mg0.1Ni0.4Fe2O4 | |||||
|---|---|---|---|---|---|---|---|---|---|---|
| co-prec. | Sol | co-prec. | Sol. | co-prec. | Sol. | co-prec. | Sol. | co-prec. | Sol. | |
| Ms (emu g−1) | 56.675 | 29.952 | 20.888 | 31.563 | 20.391 | 27.513 | 27.881 | 22.254 | 127.570 | 32.404 |
| Mr (emu g−1) | 0.45560 | 0.17039 | 0.06527 | 0.24271 | 0.04569 | 1.67430 | 0.04569 | 1.67430 | 0.05017 | 0.12615 |
| Mrs = (Mr/Ms) × 10−3 | 8.039 | 5.689 | 3.124 | 7.690 | 2.241 | 60.854 | 1.153 | 118.110 | 0.3932 | 3.893 |
| Coercivity (Oe) | 16.5960 | 8.5570 | 6.8195 | 12.4220 | 5.2743 | 93.1750 | 0.75800 | 164.620 | 2.3387 | 5.5420 |
| K1×105 (J m−3) | 0.28 | 0.27 | 0.31 | 0.38 | 0.25 | 3.31 | 0.02 | 7.24 | 0.01 | 0.16 |
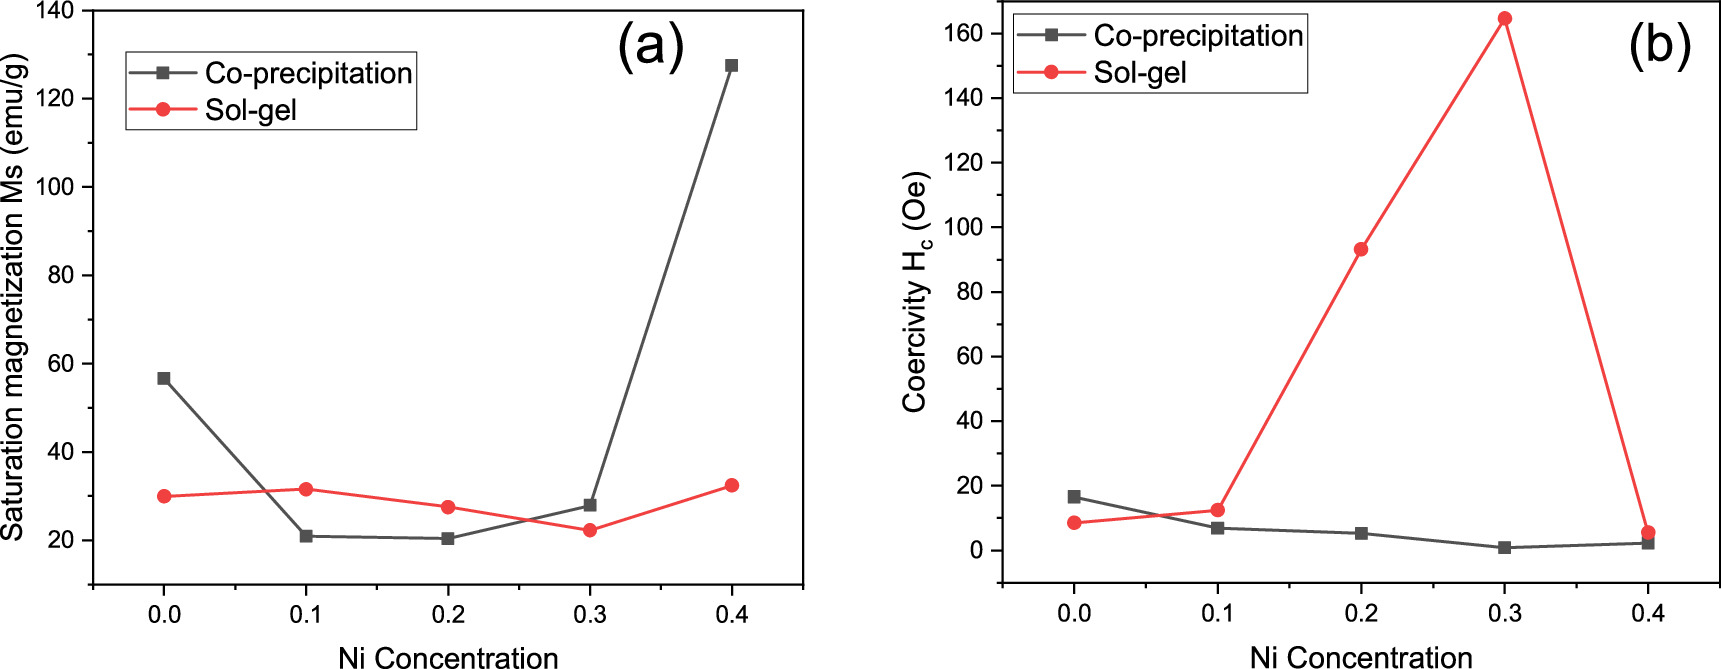
The variation observed in the saturation magnetization values at room temperature for different Ni content is presented in table 4 and figure 14(a). The value of Ms for sample with x = 0 is 56.675 emu g−1 for the sample prepared by co-precipitation method, while the value is reduced to 29.952 emu g−1 in case of sol–gel method. For co-precipitation, the introduction of nickel resulted in decrease of saturation magnetization of the samples with Ni concentration and then start to increase up for sample of x = 0.3, and it was found to be maximum for sample of x = 0.4 with value of Ms equal to 127.570 emu g−1. On the other hand, the introduction of nickel in the case of sol–gel method samples resulted in an increase of Ms from 29.952 emu g−1 to 31.563 emu g−1 for the sample with x = 0.1 and then decreased up to x = 0.3. The saturation magnetization then increases for sample of x = 0.4. For both methods, the Ms was maximum for sample with x = 0.4. The increase in Ms values of prepared samples with x = 0.4 are most likely attributed to the increasing of crystallinity and particle size of the sample [44].
Figure 14. variation of (a) saturation magnetization Ms and Coercivity Hc with Ni concentration for two different synthesized method.
Download figure:
Standard image High-resolution image
The following equation is used to calculate the magnitudes of squareness ratio (Mrs) of the sample of nano-ferrite [45].

It can be noticed from table 4 that the numerical values of Mrs were increased with Ni concentration for co-precipitation samples, while opposite behaviors were observed for samples prepared with sol–gel method. However, for both methods, the prepared samples own single domain. According to references [46, 47], the particles possess single domain if the squareness ratio Mr/Ms value 0.5 or less. Table 4 shows that, for all the samples, the ratio Mr/Ms are significantly less than 0.5 suggesting that the samples under investigation are soft magnetic materials.
The saturation magnetization has related to coercivity through Brown's relation [44],

where K1 is the magneto-crytalline anisotropy constant and μ0 is the magnetic permeability of free space. The magnitude of K1 and the volume of nanocrystals control the strength of grain size and spin–orbit (L-S) coupling and define the degree of the super-paramagnetism. The magneto-crytalline anisotropy constant K1 for the samples of both methods was determined and was listed in table 4. These values are comparable with previous studies of NiZnAl ferrite [43], NiFe2O4 [48]. The sample with x = 0.4 of sol–gel method shows the highest value of K1 and Hc as well. Materials with high magnetic anisotropy usually have high coercivity. Comparison of magneto-crytalline anisotropy constant (K1), crystallite size (D), saturation magnetization (Ms), and coercivity (Hc) for samples of both methods with previous studies were summarized in table 5. The coercivity for sample with x = 0.0 was found to be 16.5960 (Oe) and the introduction of Ni resulted in decreasing of Hc values with Ni concentration up to x = 0.3 for the sample prepared by co-precipitation method. In the case of sol–gel method, as indicated by figure 14(b), the Hc was found to increase from 8.5577 (Oe) up to x = 0.3 (164.6200 Oe) when Ni concentration increased. The coercivity of sol–gel samples, generally, increased with Ni concentration with the exception of sample x = 0.4. Similar findings were reported by Xingrong Wu et al [49] for their samples. The increase in the value of Hc could be attributed to the strong magnetic interaction. The magnetism of cubic spinel ferrite mainly comes from metal cation super exchange between A and B sites. There are three types of magnetic interactions that occur between A and B sites. The strongest and most dominant is A-B sub-lattice exchange, while A-A type and B-B type are relatively weak [50]. The ferromagnetic behavior of the soft magnetic material was detected in the samples as mentioned earlier. Specifically, non-permanent magnetic materials are due to their small Mr and Hc values, which could be magnetized and demagnetized easily at low field values. This may indicate the formation of the narrow magnetic hysteresis loop [51]. Cationic magnetic moments were produced at tetrahedral and octahedral sites by the super exchange interaction between metal cations that are responsible for the magnetic properties [52]. For both methods, the remanent magnetization of coercive field deduced from the hysteresis loops, are very low, suggesting the super-paramagnetic behavior of the samples. This magnetic behavior of the nickel nanoferrites makes them a good candidate for use in hyperthermia treatment [53]. According to Wahajuddin and Arora [54], these nanoparticles are very important for their use as drug delivery vehicles. They can drag the drug molecules to certain part in the body by the effect of an applied magnet field. Furthermore, ferrites can be classified as soft ferrites that are possible to magnetize and demagnetize easily, while it is difficult in the case of hard ferrites because of greater Hc and Mr [51, 55]. The synthesized samples of co-precipitation method possessed the lowest values of remanent magnetization, Mr and coercive field, Hc compared to samples of sol–gel method.
Table 5. Comparison of current study with previous works for crystallite size (D), saturation magnetization (Ms), remanent magnetization (Mr), squareness ratio (Mrs), coercivity (Hc) and magnetocrytalline anisotropy constant (K1).
| Sample No. | Co-precipitation | |||||||||||||||
|---|---|---|---|---|---|---|---|---|---|---|---|---|---|---|---|---|
| Current study | Zn1−xMgxFe2O4 [3] | Ni0.5Zn0.5Fe2O4 [28] | Ni1−yFe2xCrxO4 [46] | |||||||||||||
| D (nm) | Ms (emu/g) | Hc (Oe) | K1 ×105 (J m−3) | D (nm) | Ms (emu g−1) | Hc (Oe) | K1 (J m−3) | D (nm) | Ms (emu g−1) | Hc (Oe) | K1 (J m−3) | D (nm) | Ms (emu g−1) | Hc (Oe) | K1 (J m−3) | |
| 1 | 19.15 | 56.67 | 16.59 | 0.28 | 31.0 | 11.0 | 89.9 | — | 97.5 | 34.53 | 18.33 | — | 17 | 23.67 | 290 | — |
| 2 | 13.15 | 20.88 | 6.81 | 0.31 | 23.0 | 12.1 | 96.0 | — | 67.7 | 63.21 | 40.77 | — | 17 | 33.49 | 296 | — |
| 3 | 12.75 | 20.39 | 5.27 | 0.25 | 31.1 | 17.5 | 92.5 | — | 81.6 | 77.19 | 79.15 | — | 18 | 28.5 | 292 | — |
| 4 | 11.65 | 27.88 | 0.75 | 0.02 | 29.5 | 18.0 | 92.5 | — | 54.4 | 75.4 | 65.0 | — | 19 | 26.9 | 293 | — |
| 5 | 12.80 | 127.57 | 2.33 | 0.01 | 21.5 | 19.9 | 91.0 | — | 58.3 | 74.33 | 79.79 | — | 19 | 26.5 | 247 | — |
| Sol–gel methods | ||||||||||||||||
|---|---|---|---|---|---|---|---|---|---|---|---|---|---|---|---|---|
| Current study | Ni0.9Cd0.1−xSrxFe2O4 [37] | Ni0.6Zn0.2Me0.2GdxFe2−xO4 [7] | Ni0.2Mg0.2Zn0.6Fe2O4 [38] | |||||||||||||
| Sample No. | D (nm) | Ms (emu g−1) | Hc (Oe) | K1 ×105 (J m−3) | D (nm) | Ms (emu g−1) | Hc (Oe) | K1 ×104 (erg/Oe) | D (nm) | Ms (emu g−1) | Hc (Oe) | K1 ×105 (J m−3) | D (nm) | Ms (emu g−1) | Hc (Oe) | K1 ×102 (J m−3) |
| 1 | 13.90 | 29.95 | 8.55 | 0.27 | 37 | 18.34 | 218.59 | 0.41 | 14.43 | 34.0 | 400.8 | — | 68.9 | 32.30 | 2.48 | 0.39 |
| 2 | 15.05 | 31.56 | 12,42 | 0.38 | 36 | 26.30 | 183.5 | 0.50 | 13.57 | 18.12 | 346.67 | — | 53.1 | 29.06 | 4.86 | 0.70 |
| 3 | 14.81 | 27.51 | 93.17 | 3.31 | 31 | 27.38 | 203.03 | 0.57 | 13.47 | 31.79 | 382.4 | — | 68.9 | 26.47 | 2.52 | 0.33 |
| 4 | 21.90 | 22.25 | 164.62 | 7.24 | 26 | 34.79 | 188.87 | 0.68 | 17.73 | 36.39 | 354.51 | — | 60.9 | 30.11 | 11.74 | 1.76 |
| 5 | 21.90 | 32.40 | 5.54 | 0.16 | — | — | — | — | — | — | — | — | 65.1 | 38.25 | 12.02 | 3.30 |
4. Conclusion
The structure and properties of synthesized nano-ferrites depend on the method of preparation, the nature and the concentration of the substitution element. Two different methods namely, co-precipitation and sol–gel methods were used to synthesize Zn0.5NixMg0.5−xFe2O4 nanoparticles (where x = 0, 0.1, 0.2, 0.3 and 0.4). The formation of single-phase crystallite structure was confirmed by x-ray diffraction with size ranged from 19.15 to 11.65 nm and 21.9 to 13.9 nm for co-precipitation and sol–gel samples, respectively. In both cases, the lattice parameter was found to decrease with nickel concentration and was attributed to the larger ionic radius of the Ni+2 ion. FTIR spectrum showed the anticipated main absorption bands, thus confirming the formation of spinel structure. The optical band gap energy of Zn0.5NixMg0.5−xFe2O4 nano-ferrite samples of co-precipitation method was found to have greater values ranged 6.04 to 6.08 eV compared to sol–gel which ranged 4.44 to 4.50 eV. For both methods, the soft ferrite was obtained and an enhancement in magnetization of the samples was observed. VSM measurements revealed super-paramagnetic behavior with a relatively high saturation magnetization of the prepared samples. The magnetic behaviors of synthesized samples make them suitable candidates for sensing and high-frequency applications and for use in hyperthermia treatment. To conclude, the characterization outcomes may recommend that co-precipitation method is preferred over sol–gel method for preparation of Zn0.5NixMg0.5−xFe2O4 nanoparticles.
Acknowledgments
The authors thank Prof. Karlu Ayuel (Dept. of physics, Al-Baha University, Saudi Arabia) for valuable discussion about magnetic results.
Data availability statement
All data that support the findings of this study are included within the article (and any supplementary files).