

Abstract
Biodiversity hotspots are conservation priority areas that feature exceptionally high levels of species endemism and high levels of habitat loss. The Guinean Forests of West Africa hotspot, home to a quarter of all the mammal species of Africa, has experienced high levels of forest loss within its protected areas. Here, we analyzed tree cover loss and its proximate drivers within Guinée Forestière, a high biodiversity region within the Guinean Forests of West Africa hotspot, both inside and outside protected areas. Using Landsat analysis ready data and a regionally calibrated, annual forest change detection model, we mapped tree cover loss occurring across this region from 2000 to 2018. We quantified the area of tree cover loss and identified proximate drivers using a statistical sample of reference data. The total tree cover loss in Guinée Forestière between years 2000 and 2018 was 10,907 km2 (SE 889 km2), which consists of approximately 25% of the region's total land area. Of this total loss, 364 km2 (SE 91 km2) occurred within protected areas of high biodiversity value. Tree cover loss was not consistent across high biodiversity areas and did not appear to be related to protected area classification. Smallholder agriculture (subsistence and cash crop farming) was the primary driver of tree cover loss across Guinée Forestière. This research provides multitemporal spatial data on tree cover dynamics that is required for effective implementation of sustainable management and biodiversity conservation strategies within the broader socioecological landscape of Guinée Forestière. We also highlight important limitations to consider and address when using remote sensing to automate change detection across landscapes.
Export citation and abstract BibTeX RIS

Original content from this work may be used under the terms of the Creative Commons Attribution 4.0 licence. Any further distribution of this work must maintain attribution to the author(s) and the title of the work, journal citation and DOI.
1. Introduction
Biodiversity is declining at an accelerating pace (Pimm et al 2014). Much of this decline is attributed to increasing human demands for natural resources whereby our footprint far exceeds the Earth's capacity to regenerate (Lin et al 2018). Declines in biodiversity can lead to an alteration of ecosystem structure and function, resulting in diminished capacity to provide ecosystem services to nature and humans (Morris 2010, Díaz et al 2019, Chapin III et al 2000, Isbell et al 2017). Such impacts, which can extend across large spatial scales, often negatively and disproportionately affect the poorest communities who rely on surrounding biodiversity and other ecosystem services for their livelihoods and human well-being (Roe et al 2019). Thus, the conservation of biodiversity is not solely an environmental issue, but also one of social, economic, and ethical concern (IPBES 2019).
To support biodiversity conservation planning, scientists have identified priority areas where there are exceptionally high levels of species endemism and high levels of habitat loss for these species (Myers et al 2000). The primary intent of these 'biodiversity hotspots' is to focus monitoring and protective measures where the conservation payoff is greatest. Currently, there are 36 biodiversity hotspots covering approximately 2.5% of the Earth's land area (CEPF 2016, Conservation International 2021). Within biodiversity hotspots, protected areas (PAs) are often considered fundamental to conserving biodiversity, protecting ecosystem services, supporting livelihoods, and achieving the Sustainable Development Goals (CBD 2004, United Nations 2015). However, they are often vulnerable to human-driven land use change due to under-allocation of financial resources, low law-enforcement capacity, and lack of local stakeholder engagement for their protection (Watson et al 2014, Geldmann et al 2019, Oldekop et al 2016). Recent remote sensing analysis found that 37% (540,000 km2) of the land cover changes that occurred within biodiversity hotspots between 1992 and 2015 has been associated with forest cover loss (Hu et al 2021) 3 . Additionally, the study found that 75,000 km2 of forests were lost in PAs located within biodiversity hotspots (approximately 5% of the total year 1992 forest area within PAs).
One of the hotspots identified by Hu et al (2021) as having the greatest amount of 1992–2015 forest loss within PAs is the Guinean Forests of West Africa hotspot (hereafter GFWA hotspot). The GFWA hotspot extends from the Republic of Guinea and Sierra Leone eastward to Cameroon (CEPF 2015). It is divided into two sub-regions, Upper and Lower Guinean Forests, which are separated by a savannah zone called the Dahomey Gap that extends from eastern Ghana to Benin. Home to over a quarter of all the mammal species found in Africa, the GFWA hotspot is particularly notable for its high mammalian diversity. Of the over 1,700 terrestrial animal species found in this region, more than 250 are endemic to the GFWA hotspot (CEPF 2015). It is estimated that the predominantly tropical and subtropical moist broadleaf forests of the GFWA once covered 624,000 km2 (Mittermeier et al 2004). Recent research has reported that the GFWA hotspot had a net decrease in forest cover of 16,000 km2 from 2000 to 2015, and of the 36 biodiversity hotspots, the GFWA had one of the highest amounts of forest loss (6,960 km2) occurring within PAs (Hu et al 2021). The observed forest loss was mostly attributed to agricultural expansion (Hu et al 2021).
Here, we analyzed tree cover loss within Guinée Forestière, a region of the Republic of Guinea (hereafter Guinea) with some of the highest levels of species richness within the GFWA hotspot, in order to support conservation planning. We mapped and quantified tree cover loss occurring across Guinée Forestière from 2000 to 2018 using remotely sensed data, estimated tree cover loss inside and outside of PAs of high biodiversity value, and identified primary drivers of tree cover loss. We also reported on the accuracy of our estimates to ensure the robustness of our analyses.
2. Study Area
This study focuses on Guinée Forestière, one of four geographic regions of Guinea, which covers approximately 17% (42,760 km2) of Guinea's surface area (245,860 km2). Guinée Forestière exemplifies why the Upper Guinean Forests are a biodiversity hotspot, as it the home to at least 16 out of the 28 threatened terrestrial mammal species in Guinea (IUCN 2020). These species include pygmy hippopotamuses (Choeropsis liberiensis), western chimpanzees (Pan troglodytes verus), forest elephants (Loxodonta cyclotis), white-bellied pangolins (Phataginus tricuspis), and Nimba otter shrews (Micropotamogale lamottei).
We identified five PAs of high biodiversity importance for use in this analysis (hereafter high biodiversity areas or HBAs) (figure 1). The HBAs listed below were chosen because they are considered strongholds of the Upper Guinean Forests within Guinée Forestière (Van Rompaey et al 2001)and were either identified by Brugiere and Kormos (2009) as Key Biodiversity Areas (KBAs) in Guinea or have been internationally recognized for their high biodiversity. Although not explicitly listed within a particular IUCN PA category, Classified Forests are typically areas of forests with management plans and limitations on activities allowed within their borders (FAO 2010). We considered Classified Forests as PAs for the purpose of this study. Additionally, all of the KBAs located in Guinée Forestière are Classified Forests. The five HBAs chosen for analysis in this study are described below.
- 1.The Mont Nimba Biosphere Reserve is an internationally recognized PA designated by UNESCO as part of the Man and Biosphere Programme. This site consists of three core areas (the Mount Nimba Strict Nature Reserve, Bossou Hills, and Déré Forest) covering a total of 253.6 km2.
- 2.Massif du Ziama Biosphere Reserve is a nationally Classified Forest identified as a KBA by Brugiere and Kormos (2009) that is also part of the Man and Biosphere Programme. It consists of a single core area covering 1159.1 km2.
- 3.Diécké Forest is a nationally Classified Forest that was identified as a KBA by Brugiere and Kormos (2009). It covers 591.8 km2.
- 4.Pic de Fon is a nationally Classified Forest and KBA that was identified as a KBA by Brugiere and Kormos (2009). It covers 320.9 km2.
- 5.Mount Bero is a nationally Classified Forest and KBA that was identified as a KBA by Brugiere and Kormos (2009). It covers 274.6 km2.
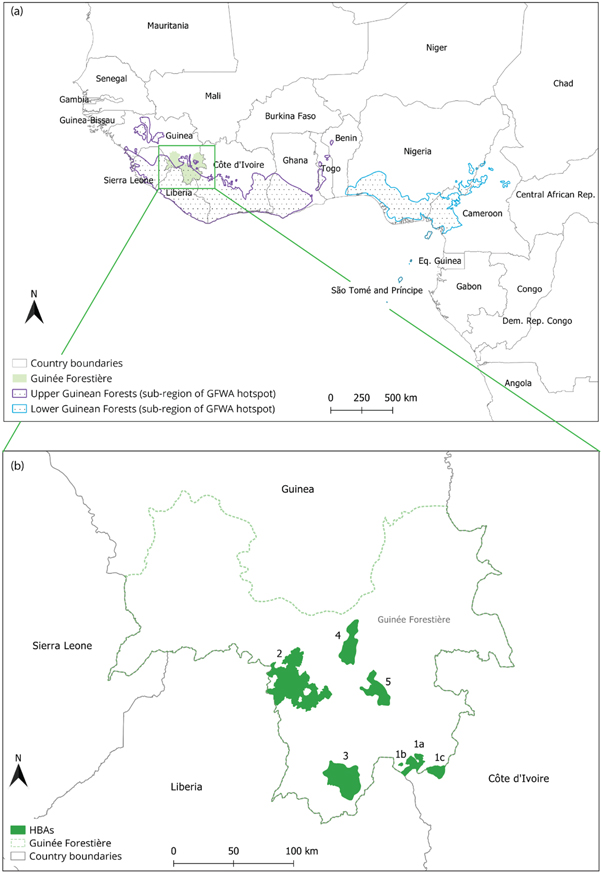
Figure 1. Location of the Guinean Forests of West Africa (GFWA) hotspot (including Upper and Lower Guinean Forests sub-regions) (figure 1(a)) along with the 5 HBAs (green polygons) within the study area (Guinée Forestière) (figure 1(b)). The HBAs are labeled as: 1a = Mount Nimba Strict Nature Reserve core area of the Mont Nimba Biosphere Reserve; 1b = Bossou Hills core area of Mont Nimba Biosphere Reserve; 1c = Déré Forest core area of the Mont Nimba Biosphere Reserve; 2 = Massif du Ziama Biosphere Reserve; 3 = Diécké Forest; 4 = Pic de Fon; 5 = Mount Bero. Shapefiles of boundaries for the HBAs were compiled from UNEP-WCMC and IUCN (2019). GFWA hotspot boundaries were sourced from Mittermeier et al (2004).
Download figure:
Standard image High-resolution imageThese five HBAs were used to stratify Guinée Forestière for use in the stratified random sampling design discussed below (section 3.2). Shapefiles of boundaries for these areas were compiled from UNEP-WCMC and IUCN (2019).
3. Methods
In this study, we used two remote sensing data analysis methods to address our research objectives: (1) annual tree cover loss mapping using Landsat time-series data; and (2) statistical sample analysis.
3.1. Tree cover loss mapping using Landsat time-series
We analyzed nineteen years (2000–2018) of Landsat satellite imagery available from the United States Geological Survey National Center for Earth Resources Observation and Science (USGS EROS). Landsat images were processed using an automated method developed by Potapov et al (2020) into a spatially and temporally consistent time-series dataset, the GLAD Landsat Analysis Ready Data (ARD), freely available from https://glad.umd.edu/ard/home. The Landsat ARD served as input to the annual change detection model described below. The source Landsat image data represented top-of-atmosphere spectral reflectance affected by the variability of atmospheric conditions and cloud presence. The Landsat ARD data processing included the following steps: (1) implementation of per-pixel quality assessment models to exclude from further processing observations with high likelihoods of cloud or cloud shadow contamination; (2) reflectance normalization using the global MODIS-derived surface reflectance as a normalization target to reduce the effects of atmospheric scattering and surface anisotropy; and (3) data aggregation from individual Landsat images into a set of 16-day image composites to simplify the time-series analysis (Potapov et al 2020).
To map annual tree cover loss, we used the set of 16-day Landsat ARD composites from the current and three preceding years to calculate annual change detection metrics. These metrics represented a set of statistics derived from per-spectral band reflectance differences between observations of the current year with the average reflectance from three previous years for the same 16-day interval. Such feature space design allowed us to highlight inter-annual reflectance changes while ignoring vegetation seasonality. The detailed description of the change detection metrics approach and the full list of metrics are provided in Potapov et al (2020).
We mapped annual tree cover loss using the approach developed by Hansen et al (2013) and Potapov et al (2019). Tree cover loss was mapped using a machine-learning tool (bagged decision tree ensemble model, Breiman 1996Breiman et al 1984) that we calibrated using manually collected training areas throughout the region. The decision tree model was applied to a set of annual change detection metrics resulting in an annual tree cover loss map. The regional annual change detection model for West Africa was initially calibrated for the Global Forest Loss (GFL) product (www.globalforestwatch.org), where it was implemented to map tree cover loss from 2015 to present. Here, we used the same model to map annual tree cover loss from the year 2000 to 2014. The original GFL data for the 2000–2014 interval is not consistent with the most recent years due to the changes of the classification approach (Palahí et al 2021). Based on visual data assessment, we presume that the new regionally calibrated annual tree cover change detection model has a better inter-annual consistency and better sensitivity to small-scale changes compared to the old GFL global product. Unlike the GFL product, where only the first year of the detected tree cover loss is retained, we created an annual tree cover loss time-series. For repeated tree cover loss detections, we implemented a three-year delay before the repeated loss may be mapped to avoid double-counting of clearing events.
3.2. Sample analysis
We performed the statistical sample analysis within the entire region of analysis which represented our sampling frame. Consistent with similar applications, we chose the Landsat ARD pixel (approximately 30 × 30m) as the sampling unit (Tyukavina et al 2018, Potapov et al 2019). We employed a stratified random sampling design to target the HBAs, as we are interested in forest loss relative to biodiversity. (Olofsson et al 2014). We defined two strata within our area of interest inside Guinée Forestière (table 1). Stratum 1 consisted of the area outside of the five HBAs defined above in section 2 (Study Area). Stratum 2 encompassed the area within the five HBAs. Sampled pixels were selected randomly within each stratum. The allocation of samples across each stratum is shown in table 1. We compiled remotely sensed data for each sample that included temporal profiles of the normalized difference vegetation index (NDVI), normalized difference water index (NDWI), and short-wave infrared reflectance (SWIR1) normalized surface reflectance; annual and bi-monthly averaged normalized surface reflectance image composites; and very high resolution (VHR) images from Google Earth (Potapov et al 2019). These data were accessible through a web-based interface and used during visual sample interpretation.
Table 1. Strata area and sampling sizes.
| Stratum | Area (km2) | Pixel count | Sample size |
|---|---|---|---|
| 1 (outside HBAs) | 40160.6 | 52,781,552 | 400 |
| 2 (inside HBAs) | 2602.0 | 3,415,081 | 100 |
For each sample, two to three image analysts visually inspected the remotely sensed data and manually recorded whether tree cover loss was observed between years 2000 and 2018 and identified the proximate driver of the tree cover loss event (table 2). The proximate driver interpretation was done following the approach of Tyukavina et al (2018). If the driver could not be identified, it was categorized as 'unknown'. In case of interpretation disagreement, the sample was re-visited by all image analysts before coming to a final interpretation consensus. Based on this visual interpretation of samples, we assessed the accuracy of the annual tree cover loss map from the Landsat time-series data (hereafter map-based tree cover loss). We then estimated the total per strata area of tree cover loss (hereafter sample-based tree cover loss). We also estimated the proximate drivers of tree cover loss across Guinée Forestière both within and outside of HBAs . The methods used for estimating map accuracy statistics and area were based on established approaches by Olofsson et al (2013) and Stehman (2013, 2014).
Table 2. Drivers of tree cover loss and definitions used in this study.
| Driver | Description |
|---|---|
| Logging | Forest clearings created by cutting down trees and without apparent agricultural or mining purposes |
| Smallholder Agriculture | Tree cover loss due to human use of land for subsistence or small-scale cash crop farming |
| Mining | Clearings associated with mining activities (e.g. terraces, pits, and human-made ponds) |
| Settlement | Tree cover loss due to the creation or expansion of human settlements and building infrastructure |
| Road Infrastructure | Tree cover loss due to the expansion and creation of roads and associated road corridors |
| Industrial Agriculture | Tree cover loss due to large-scale industrial agricultural activities |
| Unknown | Unable to discern the primary driver of tree cover loss |
| None | No loss took place |
4. Results
4.1. Map accuracy assessment
The tree cover loss map (figure 2) had an overall accuracy of 91.83% (Standard Error, SE 1.32%). The user's accuracy for the map-based tree cover loss was 88.32% (SE 3.25%), which reflects low commission error. In other words, the map had a low rate of false positives and correctly identified tree cover loss approximately 88% of the time. The producer's accuracy for the map-based tree cover loss was 78.35% (SE 3.92%), which reflects low omission rates. In other words, about 78% of the times when tree cover loss was identified in the manual sample interpretation, the map also classified the pixel as tree cover loss (i.e. low omission error).
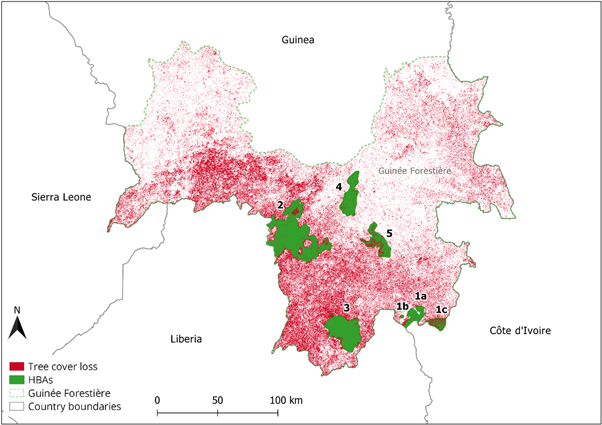
Figure 2. Map showing tree cover loss across Guinée Forestière from 2000 to 2018.
Download figure:
Standard image High-resolution image4.2. Sample-based tree cover loss estimation and drivers of change
The sample-based estimate for total area that experienced tree cover loss in Guinée Forestière between years 2000 and 2018 was 10,907 km2 (SE 889 km2). This is approximately 25% of Guinée Forestière's total land area (42,760 km2). Sample-based tree cover loss occurring within the HBAs was 364 km2 (SE 91 km2) and tree cover loss occurring outside the HBAs was 10,543 km2 (SE 885 km2). The primary identified drivers of loss, irrespective of strata, were activities associated with smallholder agriculture, logging, and human settlement (table 3). Within the HBAs, tree cover loss was primarily attributed to logging and smallholder agriculture. Outside of these areas, loss was driven mostly by smallholder agriculture (table 4). Note that there is an 'unknown' category that accounts for large portions of tree cover loss. This category reflects areas where tree cover loss was identified during the sample analyses, but the exact proximate driver of loss was not identified due to the absence of very high resolution satellite data. The sample-based area estimation (tables 3 and 4) provides the following statistics for each driver: the estimated total area (km2) that experienced tree cover loss and standard error (SE).
Table 3. Drivers of tree cover loss across Guinée Forestière.
| Driver of loss | Area (km2) | SE (km2) |
|---|---|---|
| Smallholder Agriculture | 6631 | 744 |
| Unknown | 4098 | 600 |
| Logging | 152 | 107 |
| Settlement | 26 | 26 |
Table 4. Drivers of tree cover loss by strata across Guinée Forestière.
| Stratum | Driver of loss | Area (km2) | SE (km2) |
|---|---|---|---|
| 1 (outside HBAs) | Smallholder Agriculture | 6527 | 742 |
| Unknown | 3916 | 596 | |
| Logging | 100 | 100 | |
| 2 (inside HBAs) | Unknown | 182 | 67 |
| Smallholder Agriculture | 104 | 51 | |
| Logging | 52 | 37 | |
| Settlement | 26 | 26 |
4.3. Annual tree cover loss
We analyzed the map-based tree cover loss annually for each HBA (stratum 2) and for the land area outside of HBAs (stratum 1) using a 3-year mean. Across all years, the Mont Nimba Biosphere Reserve had the highest amount of tree cover loss relative to its land area (figure 3(A)). Because this HBA consists of three core areas of varying PA classification, we disaggregated the results to show tree cover loss for each of the core areas (figure 3(B)). Tree cover loss occurring in the Déré Forest and Bossou Hills core areas contributed most to the total tree cover loss that occurred within the Mont Nimba Biosphere Reserve (figure 3(B)). However, the Mount Nimba Strict Nature Reserve (hereafter Mt. Nimba SNR), did not contribute as much to the total tree cover loss within that HBA. Mount Bero had the second highest percentage of tree cover loss annually, with a large spike occurring between 2010 and 2015 (figure 3(A)).
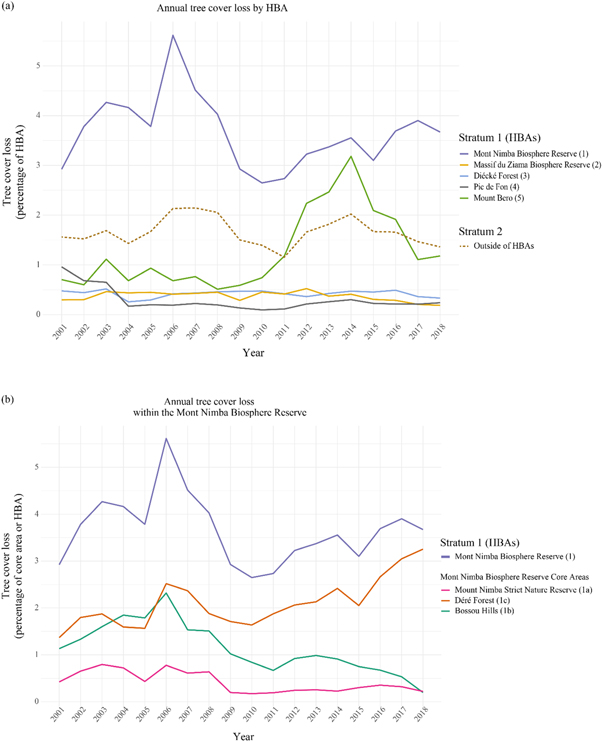
Figure 3. Annual tree cover loss based on a 3-year mean. Loss is given as a percentage of the total area of each HBA (or in the case of graphs (b), percentage of either the HBA or core area). Graph (a) shows tree cover loss within each HBA and loss outside of HBAs across Guinée Forestière. Graph (b) depicts loss specifically within the Mont Nimba Biosphere Reserve and its three core areas. Numbers in parentheses next to each HBA correspond to the labels used in the map of the study area (figure 1).
Download figure:
Standard image High-resolution image5. Discussion
The map-based tree cover loss data created for this study had an overall accuracy of 91.83% (SE 1.32%), which is considered high. When errors occurred, they occurred in the form of commission errors (false positives), found mostly in savanna areas, and related to short vegetation clearing incorrectly mapped as tree cover loss. Omission errors (false negatives) occurred in areas where large trees were retained in new agricultural areas, which obscured tree cover clearing. The uncertainty of the tree cover loss mapping is inevitable given a low availability of cloud-free Landsat data in West Africa (Ju and Roy 2008). We consider the product accuracy sufficient for our objectives. We estimated that the total sample-based tree cover loss in Guinée Forestière between years 2000 and 2018 was 10,907 km2 (SE 889 km2), which consists of approximately 25% of the region's total land area. Of this total loss, 364 km2 (SE 91 km2) of tree cover was lost within HBAs. This represents approximately 14% of the HBA land area and 0.9% of the total land area in Guinée Forestière. Hu et al (2021) similarly found that 13% of the forest cover loss that occurred between 1992 and 2015 within the GFWA hotspot took place within PAs.
The map-based tree cover loss was not consistent across HBAs and did not appear to be related to PA classification. For example, Diecke Forest and Pic de Fon are Classified Forests which, on paper, receive the some of the lowest levels of protection among the types of PAs represented in this study. Yet, both of these HBAs had low percentages of tree cover loss relative to their areas (figure 3). On the other hand, the Mont Nimba Biosphere Reserve had the highest percentage of map-based tree cover loss (figure 3) relative to its land area within Guinée Forestière. This site is part of UNESCO's Man and Biosphere Programme. Although Biosphere Reserves are not designated as part of a particular IUCN PA category, they consist of three core areas that are supposed to be strictly protected by the jurisdictions where they reside in order to ensure they best contribute to the conservation of species, ecosystems, and landscapes (UNESCO 2019). Those three core areas are: the Bossou Hills, Déré Forest, and Mt. Nimba SNR. Déré Forest is a Classified Forest and Mt. Nimba SNR is an IUCN Category 1a PA, the highest possible IUCN PA category. The Bossou Hills are neither a Classified Forest nor categorized as an IUCN PA. Overall, Déré Forest had more map-based tree cover loss relative to its land area than the Bossou Hills (figure 3). And despite its high level PA categorization, tree cover loss still occurred within the Mt. Nimba SNR (figure 3). This indicates that PA status likely did not directly influence the amount of tree cover loss that occurred. Further research is needed to better understand the social and political factors that may impact the realized protection of these areas, such as resource allocation, local stakeholder engagement, and law-enforcement.
We found that smallholder agriculture (subsistence and cash crop farming) was the primary driver of tree cover loss across Guinée Forestière. Our finding matches what Hu et al (2021) recently found in their analysis of land cover changes across all biodiversity hotspots, namely that forest loss was primarily driven by agricultural expansion. This is not surprising given that agriculture, forestry, and fishing make up 24% of the country's GDP and that agriculture alone provides income for over half of rural households in Guinea (World Bank 2019). Thus, it is also not unexpected that logging was also identified as a driver of tree cover loss both within and outside of HBAs. In Guinée Forestière, logging is likely an artisanal, as opposed to a large-scale commercial, operation. Apart from felling trees for building infrastructure and energy production, artisanal logging can occur as part of slash and burn agricultural practices and it can be difficult to distinguish the two in remote sensing (Molinario et al 2020, Tyukavina et al 2018). If not already in place, more sustainable artisanal logging practices and more efficient use of wood as an energy source might go a long way toward protecting biodiversity and the structure and function of the ecosystems sustaining life in Guinée Forestière (Arcus Foundation 2014). Notably, large scale, industrial agriculture was not identified as a primary driver of tree cover loss in this region. There is potential for expansion of industrial agriculture across Guinée Forestière, as there have been a few industrial rubber and oil palm plantations located in this region in the past. For example, there are industrial oil palm and rubber plantations (Société Guinéenne de Palmier à huile et d'Hévéa, SOGUIPAH) near the Diécké Forest (an HBA used in this study), but their development began prior to 2000 and therefore were not likely to have been a direct driver of tree cover loss during the time period analyzed. Apart from this, most of the agricultural activities in Guinée Forestière appear to function as subsistence and cash-crop farming occurring at smaller scales.
We encountered several challenges throughout this study. One difficulty was the lack of consistent, freely available VHR imagery for use in the sample interpretation process. As a result, we needed to create an 'unknown' category to capture drivers of tree cover loss for instances where loss was visually detected in the samples, but for where the imagery was either too coarse, obscured by cloud-cover and cloud shadow, or where the temporal resolution of available imagery was too low to visually identify the exact driver of loss. In most of these instances, we were confident that the loss was anthropogenic, but we were unable to distinguish which type(s) of human activities led to the observed tree cover loss.
We faced an additional challenge when interpreting the results. In this study, the sample-based approach for estimating the exact drivers of tree cover loss was not exhaustive of all possible drivers of tree cover loss. By stratifying and randomly sampling a portion of the overall area of interest, we were able to identify the most widespread proximate drivers but were unable to identify drivers of tree cover loss that were not represented in the sampling effort. For example, we know that between the years of 2000 and 2018, mining was a driver of tree cover loss within some of the identified HBAs. However, mining was never recorded as a driver of change during the sample interpretation process. In one case, the location of a sampled pixel was adjacent to an area that underwent deforestation due to mining, but since no tree cover loss took place within the sampled pixel, no driver was recorded (figure 4). This is an important caveat given that the world's largest untapped iron-ore reserve is located within Pic de Fon (Simandou mountain range), an HBA used in this study. Although exploration began in the late 1990s and early 2000s, legal issues, corruption, and geographic remoteness have left it undeveloped. Mining, throughout all of its phases (exploration and evaluation, engineering and site selection, development, and operations), is an intensive process that both directly and indirectly impacts the environment (Arcus Foundation 2014). These impacts include deforestation and habitat loss, pollution, influxes of people for economic opportunities, and increased human access to once remote regions for hunting and logging (Arcus Foundation 2014, Sonter et al 2018). Even though mining was not captured in the sample analysis as a proximate driver of tree cover loss, it likely has been an ultimate (indirect) driver even during the exploration, evaluation, engineering, and site selection phases. It is also likely to be a future driver of tree cover loss, both inside and adjacent to mining sites once development and operations begin. Similar threats to biodiversity exist elsewhere in Guinée Forestière, namely in the Mont Nimba Biosphere Reserve (analyzed in this study), which has some of the largest reserves of iron-ore in the world. Together, these mining projects could have massive direct and indirect effects on biodiversity and the ecosystem services in the forests found at the Mont Nimba Biosphere Reserve and Pic de Fon (Molinario et al 2020, Murguía et al 2016, Sonter et al 2018, 2020).
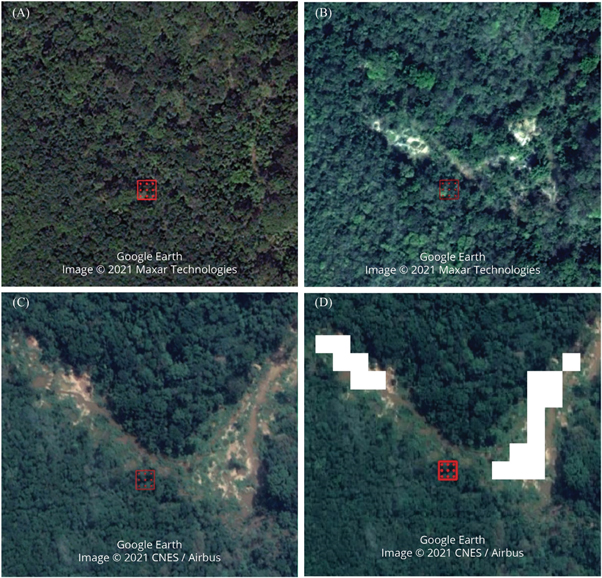
Figure 4. Google Earth Imagery showing the sampled pixel (red square) and the area surrounding the sampled pixel. In this case, no change took place inside the sampled pixel as reflected in maps (A) through (D), but tree cover was lost in the surrounding area as shown in maps (B), (C), and (D). Image (A) shows baseline forest cover inside and outside of the sampled pixel in year 2011. Image (B) is from 2015 and shows forest cover within the sampled pixel and small forest clearings from nearby mining activity. Image (C) shows expansion of the forest clearings in 2019 due to mining in the areas surrounding the sampled pixel. Image (D) shows the sampled pixel and the superimposed pixels of detected loss (white) that were identified by the Landsat time series tree cover loss map between 2000 and 2018. Reproduced with permission from Google Earth Image © 2021 Maxar Technologies/CNES/Airbus.
Download figure:
Standard image High-resolution image
6. Conclusion
This study analyzed tree cover loss across Guinée Forestière from 2000 to 2018. We found that tree cover loss occurred across 25% of Guinée Forestière's land area. Results from the sample-based area estimates revealed that anthropogenic activities, especially smallholder agriculture, that result in tree cover loss pose serious threats to biodiversity within the Guinée Forestière landscape. The annual tree cover loss estimates showed that further research is needed to better understand the social and political factors impacting on-the-ground protection of the HBAs in this study. Our research also highlights important limitations to consider and address when using remote sensing to automate change detection across landscapes.
Acknowledgments
The authors would like to thank Dr Satoshi Hirata and the Primatology and Wildlife Sciences Program at Kyoto University. This work was supported by the Japan Society for the Promotion of Science (LGP-U04 and 19J11961). The authors declare that they have no conflicts of interest.
Data availability statement
The data that support the findings of this study are available upon reasonable request from the authors.
Footnotes
- 3
Hu et al (2021) only measured land cover changes for 34 of the now 36 recognized biodiversity hotspots.