

Abstract
With the improvement in the living standard and enhancement of awareness of environmental protection by urban residents, food safety issues of vegetables, especially pesticide residues in vegetables, have gradually become an area of focus. According to previous investigations, the problems of pesticide overuse in vegetable production in City X, a typical metropolis of northern China, cannot be underestimated. To figure out the status quo and extent of pesticide overuse in China's urban vegetable production, City X was taken as a research case. Therefore, the main aim of this research is to make an economic assessment of whether pesticides are overused in vegetable production in City X. The study was conducted based on panel data of the inputs and outputs of five kinds of vegetable crops commonly planted in City X from 1990 to 2018. The economic assessment of whether pesticides are overused depends on an accurate estimation of the marginal productivity of pesticides. As we all know, pesticides cannot directly increase crop yields but reduce yield losses by inhibiting pests and diseases and reducing weeds. Therefore, regarding pesticides same as other input factors and introducing them directly into the Cobb-Douglas production function would lead to an inaccurate estimation of the marginal productivity of pesticides. Thus, we adopted a damage control model distributed in exponential and Weibull forms on the basis of the C-D production function to estimate the marginal productivity of pesticides with the NLS method. Subsequently, we calculated the optimal levels of pesticide inputs and evaluated the extent of pesticide overuse for tomatoes, cucumbers, eggplants, peppers, and cabbages cultivated in open-field and greenhouse systems respectively. We found that the marginal productivity of pesticides was close to 0, indicating that pesticide overuse issues on vegetable crops in City X have been extremely serious ever since the 1990s. We also discovered that 100% of our samples suffered excessive pesticide application, and the average pesticide input level was 21.5 to 27.9 times higher than the optimal level. Among the five vegetable crops, the pesticide overuse in tomatoes was the most serious, with actual pesticide input of 2714 yuan/hectare, which was 26.8 to 35.2 times the optimal level. While the extent of pesticide overuse was the slightest for cabbages with 9.7 to 12.8 times the optimal level. Besides, the degree of pesticide overuse for greenhouse vegetables was 55% higher than that of open-field vegetables. Fortunately, our findings suggest that with the implementation of Pesticides Reduction policies in China, the pesticide overuse issue in the vegetable industry in City X, although still grim, has been alleviated. The introduction and application of policies such as unified control, green prevention and control, monitoring, and forewarning have played a great role. With the further refinement and implementation of relevant policies in the vegetable industry, the excessive use of pesticides will be further controlled. Finally, possible policy measures are proposed to ensure the sustainable development of the urban vegetable industry, such as enhancing the publicity and service level of the unified prevention and control policy, utilizing urban agricultural big data, promoting scientific pesticide use knowledge, and new prevention and control technologies by new media, and increasing investment in the R&D of new technologies and new pesticides.
Export citation and abstract BibTeX RIS

Original content from this work may be used under the terms of the Creative Commons Attribution 4.0 licence. Any further distribution of this work must maintain attribution to the author(s) and the title of the work, journal citation and DOI.
1. Introduction
China produces the largest amount of vegetables in the world and has the greatest number of consumers [1]. In 2019, the national area of vegetables cultivated reached 20.86 million hectares, and the yield exceeded 720 million tons. Vegetables are the second largest crop in the agricultural industry in China, second only to grain [2]. There are more than 150 varieties of 14 types of vegetables planted in China throughout the year, and the demand is increasing daily. However, there are many problems in vegetable production at present, such as high production costs, especially, high labor costs, serious pests and diseases, high pesticide residues, and huge gaps between the quality of products and the requirements of consumers. With the improvement in the living standard and enhancement of awareness of environmental protection by urban residents, food safety issues of vegetables, particularly pesticide residues in vegetables, have gradually become an area of focus. As an intensive production method, greenhouse vegetable cultivation has been widely used because it has substantially increased the yield per unit area of vegetables. However, the amount of pesticides used to grow vegetables in greenhouses is much higher than that of open-field vegetables [3], which intensifies the safety issues of vegetables.
Pesticides, as an important means of production to ensure the stable yield of agricultural products and increase the income of farmers, play an irreplaceable role in the prevention and control of pests and diseases [4–6]. In particular, epidemics of pests and diseases in vegetable production force vegetable farmers to face a situation where vegetable production can be cut by more than half or even halted entirely[7]. It is the application of pesticides that avoids this dilemma, while it is also because of the significant effects of pesticides in the prevention and control of vegetable pests and diseases, vegetable farmers increasingly rely on pesticides to stabilize vegetable yield [8]. However, this over-reliance and improper use of pesticides lead to a waste of resources, an increase in production costs, and a health hazard for both consumers and farmers [9–12]. Pesticide overuse also engenders the rise of pest resistance, a bioaccumulation of toxins in food and triggers a series of ecological environmental risks, such as contamination of aquifers, reduction in soil organic matters, accumulation of chemical residues in the soils [13]. Therefore, the excessive and improper use of pesticides to control pests, diseases, and weeds has severely affected the sustainable development of the vegetable industry.
China is a large producer and consumer of pesticides, and both the total amount and the amount per unit area of pesticide use rank first in the world [14]. In the past decade, China used approximately 1.4 million to 1.8 million tons of commercial pesticides each year (450,000 to 590,000 tons of original chemicals). In 2014, the total amount of pesticide use in China reached a peak of 1.89 million tons. In 2015, the Ministry of Agriculture of China issued the Action Plan for Zero Growth in Pesticide Use by 2020, requiring an increase in the rate of utilization of pesticides and a reduction in the amount of pesticides applied. Given total crop acreage remained stable, the total amount of pesticides applied in China has been reduced for four consecutive years ever since the implementation of the plan. The amount of pesticides used in China during 2019 was 1.39 million tons in total, a reduction of 23.1% from that before the Zero Growth Action Plan. Although slightly increased in recent years, China's pesticide utilization rate is only 36%–40%, which means more than 60% of the pesticides were lost through runoff, leakage, and diffusion. Pesticide reduction and hazard control have become the primary tasks of ensuring the sustainable development of urban agriculture in China.
With the development of urban agriculture in City X, a typical metropolis of northern China, a series of policies and measures have also been introduced to promote the reduction of pesticides, which has achieved definable results. Since 2009, the City X Plant Protection Station has adopted various measures and made efforts to achieve sustainable urban agricultural development under the financial support of the Control of Pesticide Non-point Source Pollution of Pesticide Project. The amount of pesticides used in crops in City X was 5,440 tons in 2000, and it was reduced to 2,574 tons in 2018, a decrease of 52.72% given the total crop acreage unchanged. Although the total amount of pesticides used in City X has been decreasing yearly since 2009, compared with the average pesticide application level of 2.33 kg hectare in China, the pesticide use per hectare of farmland in City X was still 26% higher.
The problems of pesticide overuse in vegetable production in City X should not be underestimated. According to an authoritative survey, the use of pesticides in vegetable fields in the suburbs of City X exceeded 135 kg per hectare around the year 2000, which was 3 to 4.5 times that of urban vegetable pesticide use in the Yangtze River Valley [15]. In 2016–2018, after vigorously promoting the Zero Growth Plan, pesticide costs per hectare for major vegetable crops, such as tomatoes, eggplants, and peppers, in City X still exceeded the national average by 9%-27% according to the National Bureau of Statistics. Among them, the pesticide input per hectare of greenhouse vegetables was approximately twice that of open-field vegetables. Therefore, exploring the specific extent of pesticide overuse in greenhouse and open-field vegetables planted in City X suburbs is of substantial practical significance for controlling the growth of pesticide use, alleviating safety hazards, and promoting the green development of urban agriculture.
An economic assessment of whether pesticides are overused depends on an accurate estimation of the marginal productivity of pesticides. Early researchers regarded pesticides as a standard factor of production similar to labor, machinery, and fertilizers and used the Cobb-Douglas (C-D) production function, quadratic production function model, and random coefficient model to estimate the marginal productivity of pesticide use [16–19]. However, these studies ignore the fact that pesticides can only play a role when pests and diseases exist and pesticides control the yield damage caused by pests and diseases instead of enhancing the yield directly. Therefore, treating pesticide same as other input factors and introducing it directly into the C-D production function would led to an overestimation of the marginal productivity of pesticides. Lichtenberg and Zilberman (1986) delineated that the methods described above overestimated the productivity of pesticides and defined pesticides as damage control agents. They used the method that combines the damage control function with the C-D production function to estimate the marginal productivity of pesticides [20]. Since then, this approach has been widely used to estimate the marginal productivity of pesticides in grain, fruit, and vegetable production. Babcock et al (1992) used the C-D production function model and the damage control model separately to estimate the marginal productivity of pesticides of apples in North Carolina, USA, and proved that the C-D production function model would overestimate the marginal productivity of pesticides [21]. Jha and Regmi (2009) and Chambers Robert et al (2010) used the damage control model to estimate the marginal productivity of pesticides in vegetables. The results also showed that the estimation predicted by the damage control model was more reasonable than that of the C-D function model [23, 24].
Huang et al (2000) and Huang et al (2002) applied the damage control model to research in China for the first time and conducted research on the applications of pesticides by rice farmers and cotton farmers. Both studies concluded that pesticides were overused [25, 26]. Since then, many researchers have directly used the damage control model or improved it to study whether pesticides or veterinary drugs were overused in grain crops, economic crops, and livestock breeding in China. The focus of subsequent studies is more concerned with the reasons that contribute to the overuse of pesticides by farmers. The reasons primarily include risk aversion (loss aversion), government regulation, expected benefits, and individual characteristics of farmers, such as family income, whether they are part-time farmers, level of education, knowledge of technical information, and business mode [27–32].
To sum up, a majority of the literature has measured and evaluated whether the pesticides on a certain crop are overused and have focused on the reasons behind it. Yet few studies have considered comparing the degree of pesticide overuse among different crops and different cultivating methods from a micro perspective. In addition, the studies on pesticide overuse in China have mostly used static cross-sectional data obtained from surveys instead of dynamic panel data. Besides, few studies have paid further attention to the effect of pesticide reduction policies from a dynamic perspective.
The aim of this study is to (1) analyze and observe the dynamic changes in pesticide use in City X since the 1990s and validate whether the promotion of Pesticide Reduction policies is effective, (2)construct a damage control model to define and measure 'optimal level' and 'overuse' of pesticides from the perspective of the economic rationalization and profit maximization by estimating the marginal productivity of pesticides, (3)calculate and compare the degree of pesticide overuse in five common vegetable crops in City X under the greenhouse and open-field systems. Finally, based on the research results, targeted policy suggestions are proposed to minimize the pesticide input of vegetable farmers, to reduce non-point source pollution, and promote the green sustainable development of urban agriculture.
2. Materials and methods
2.1. Data source
We have adopted City X, a metropolis located in the northwest of the North China Plain, as a study case since it is quite representative in the development of urban agriculture, especially in urban vegetable production. The data in this article originated from the National Agricultural Product Cost-benefit Data Compilation, China Statistical Yearbook, City X Statistical Yearbook, and China Agricultural Product Price Survey Yearbook. Among them, from 1990 to 2018, the yield and output value of tomatoes, cucumbers, eggplants, and peppers under both open-field and greenhouse systems in City X come from National Agricultural Product Cost-benefit Data Compilation, so do the following input data: pesticide costs, fertilizer costs, labor days, irrigation and drainage costs, machinery costs, and other costs. The national pesticide use data and crop pesticide use data of City X were from the China Statistical Yearbook and the City X Statistical Yearbook, respectively. In addition, In order to exclude the impact of price factors, all the data on costs and expenses were deflated and calculated as the 2018 constant value using Producer Price Indexes of Agricultural Production, which come from the China Agricultural Product Price Survey Yearbook.
2.2. Estimation of the marginal productivity of pesticides
2.2.1. Theoretical analysis
As one of the input factors of agricultural production, pesticides cannot directly increase crop yields, but they reduce yield losses by inhibiting pests and diseases and reducing weeds. Therefore, directly introducing pesticides as a standard production factor into the C-D production function model will lead to the incorrect estimation of pesticide effects on yields. Therefore, we adopted the practice of Hall and Norgaard (1973) [33] and introduced the damage control function on the basis of the C-D production function. We constructed a damage control model of the vegetables to conduct research.
Assuming that the number of pests and diseases without pesticide application is I0, the pesticide use M will affect the number of pests and diseases in the form of C(M). We designate C(M) as the Control Function, assuming that the Control Function C(M) is the cumulative distribution function in the interval [0, 1]. If the number of pest infestations I decreases with the increase of the pesticide use M, then the number of pests and diseases I after pesticide use control can be expressed as follows:

It is apparent from this equation that when the vegetable farmer does not use pesticides, i.e., when M = 0, the number of pests reaches the maximum value I0, and when the pesticide use M is large enough, for instance, C(M) = 1, then I = 0 and the pests are fully inhibited.
Assuming that the actual yield of vegetables is Y, the maximum yield that can be achieved without pest infestation is H(X), where X is the input of direct factors of production, such as labor, capital, land, and fertilizers. If there is actually a vegetable yield with a proportion of φ that is affected by pests and diseases, and the infestations affect the vegetable yield in the form of D(I), then the actual vegetable yield Y can be expressed as follows:

Generally, the greater number of pests and diseases, the greater the loss of vegetable yield. Thus, we designated D(I) as the loss function or Damage Function. The Damage Function D(I) is an increasing function of the number of infestations I. When I = 0, D(I) = 0, and φ is also 0 at this time. Without considering the impact of other factors on the yield, the vegetable yield reaches its potential maximum value, i.e., Y = H(X). In contrast, when I is large enough, D(I) = 1, and the yield of vegetables is the lowest at this time, which is (1-φ)H(X), indicating that the pests caused a loss of vegetable production with the proportion of φ. By combining equations (1) and (2), the production function using pesticides as damage control inputs can be obtained:

2.2.2. Construction of a damage control model
In practice, researchers often set G(M) = 1D(I0[1-C(M)]), which reflects the process that the impact of pesticides on yield is not to directly increase yield but to control pests and diseases first and then indirectly reduce the loss caused by them. Since G(·) is composed of Damage Function D(·) and Control Function C(·), it can be designated as Damage Control Function. G(·) is also located in the interval [0, 1], which is a non-decreasing function of the pesticide input M. Substituting G(M) into equation (3) and organizing produces the following equation:

For metric identification, let F(·) be the C-D production function, and equation (4) can be simplified to the following equation [34]:

Based on the standard C-D production function, pesticides are regarded as a damage control input. According to the characteristics of panel data, a damage control model of vegetable production with individual and time effect fixed can be constructed:

where Yit denotes the yield of the i-th vegetable crop in year t; β0 and βjt are parameters to be estimated, and Xijt denotes the input of the i-th vegetable crop in the j-th factor in year t, including fertilizers, labor, machinery, and irrigation. Mit denotes the pesticide input of the i-th vegetable crop in year t; αi reflects the individual characteristics of each vegetable crop that do not change with time, where in this case represents crop variety dummy variables; λt is the time effect that does not vary with individuals, and εit is the random error.
G(M) has four common distribution forms [35, 36]: pareto distribution 1-(K/M)θ , exponential distribution 1-exp(-θM), Weibull distribution 1-exp(-Mθ ) and logistic distribution (1 + exp(μ-θM))−1. The damage control model of pareto distribution was not considered because it cannot accurately describe the characteristics of damage control owing to the implicit assumption of constant production elasticity [20]. The logistic distribution was also excluded because it was not iterative converging. Only damage control models distributed in exponential and Weibull forms were adopted for estimation in this study. Therefore, the damage control function G(Mit) in this model could be expressed by the following two equations:


where θ1 and θ2 denote the parameters of pesticide input in the damage control distribution function.
Therefore, the damage control two-way fixed effects model of vegetable production can be expressed as the following:


To compare with the damage control model, we can also construct a C-D production function two-way fixed effects model:

where ρ denotes the elasticity of pesticide input to the yield in C-D production function model.
2.3. Calculation of the marginal productivity and optimal input of pesticides
In relevant studies, the functional relationship of the economic effects of agricultural production usually has two forms: one is to eliminate the price factor and focus on the relationship between the amount of inputs and outputs, and the other is to include the price factor to examine the relationship between the input costs and the production of revenue[37, 38]. Owing to the wide variety and state attributes of pesticides, it is difficult to accurately obtain the data on the amount of pesticides applied. Therefore, we considered a combination of two methods, i.e., the cost of pesticides was used to measure Mit, and other inputs in the vegetable planting process were also measured by expenses in RMB, while the vegetable output was measured by the annual yield per hectare.
Therefore, based on equations (9) and (10), the marginal effect of pesticide costs on vegetable yield can be obtained, i.e., the marginal productivity (MP) of pesticides:


Based on equation (11), the available marginal productivity (MP) of the pesticide input is as follows:

According to the profit maximization theory, vegetable farmers can obtain the maximum profit when the marginal revenue is equal to the marginal cost. Therefore, when the revenue of every RMB 1 worth of pesticide input is exactly equal to the product of the unit price of vegetables and the marginal productivity of pesticides, the farmers acquire the maximum revenue. This condition can be expressed as equation (15):

where Pit denotes the unit price of the i-th vegetable crop in year t. By combining equation (15) with equations (12)–(13), the optimal pesticide input amount Mit optimal of models (9)-(10) can be solved. Therefore, the degree of pesticide overuse Mit overuse can be calculated using equation (16):

3. Results and discussion
3.1. Descriptive statistics
3.1.1. Analysis of the characteristics of full sample
This study collected the output and input data of 208 samples of five vegetable crops under two cropping methods of open field and greenhouse in City X from 1990 to 2018 . The sample data is unbalanced panel data, including 54 samples of tomatoes, 55 of cucumbers, 36 of eggplants, 34 of peppers and 29 of cabbages (See table 1).
Table 1. Descriptive statistics of input and output of 5 vegetable crops in City X, 1990–2018.
| Mean | S. D. | Min | Max | |
|---|---|---|---|---|
| Output Variables | ||||
| Yield (kg/hectare) | 61539 | 16865 | 23089 | 108318 |
| Output Value (yuan/hectare) | 108108 | 59782 | 18171 | 282254 |
| Greenhouse or Field | ||||
| (Greenhouse = 1 Field = 0) | 0.34 | 0.47 | 0 | 1 |
| Input Variables | ||||
| Labor (days/hectare) | 674 | 292 | 140 | 1940 |
| Pesticide Input (yuan/hectare) | 2089 | 1200 | 162 | 5452 |
| Chemical Fertilizer (yuan/hectare) | 4395 | 3731 | 683 | 32197 |
| Manure (yuan/hectare) | 4224 | 2865 | 245 | 19201 |
| Irrigation (yuan/hectare) | 1276 | 688 | 32 | 4218 |
| Machinery (yuan/hectare) | 765 | 557 | 11 | 4083 |
| Other (yuan/hectare) | 11681 | 12223 | 591 | 76050 |
| Products Price (yuan/kg) | 1.80 | 0.83 | 0.21 | 3.88 |
The statistics in the table are from 208 samples. Data collected from National Agricultural Product Cost-benefit Data Compilation, China Statistical Yearbook, and City X Statistical Yearbook. Variables related to costs have been deflated with the Price Index of Agricultural Production.
In terms of output, the average yield of the 208 samples was 61539 kg/hectare. Among the five vegetable crops, the average yield of cabbages was the largest at 80,205 kg/hectare. However, due to the low price of cabbages, the production value of tomatoes instead of cabbages was the greatest, reaching 133,348 yuan/hectare. The average yield of pepper was the lowest at 46,694 kg/hectare. From the perspective of input, the average level of pesticide costs for the five crops was 2089 yuan/hectare, and the standard deviation of pesticide costs was large, meaning that the pesticide input among different vegetable crops varied significantly. Among all the samples, the lowest input of pesticides per hectare was 162 yuan, while the highest input of pesticides was 5452 yuan/hectare. Among the five vegetable crops, the pesticide input per hectare of tomatoes was the highest, with an average pesticide cost of 2714 yuan/hectare, and that of cabbages was the lowest, with a pesticide cost of 894 yuan/hectare.
From the trend of actual pesticide input over time, pesticide costs per hectare of all the other four vegetable crops apart from cabbages have shown significant increases since 1990 (See figure 1). Among the four crops, not only the absolute amount of pesticide input of tomatoes was the largest, but its increase was also the most significant. The pesticide input of the four crops all increased to a small peak in around 2000∼2004. After that, the pesticide input of peppers presented a stable but decreasing trend, while the pesticide input of tomatoes and cucumbers reached a new peak in 2010∼2014. It can be seen that after the implementation of the Zero Growth Plan in 2015, the pesticide input of tomatoes and cucumbers showed a sharp decline and that of peppers presented a slight decline. Thus, Zero Growth Plan did play a certain role in controlling the growth of pesticide use.
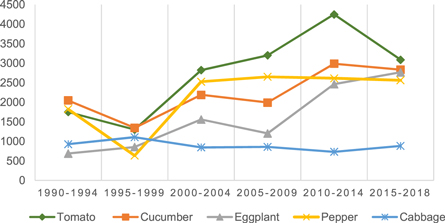
Figure 1. Pesticide input of five different vegetable crops, 1990–2018.
Download figure:
Standard image High-resolution imageIn terms of fertilizer input, the average chemical fertilizer input of the five vegetable crops in City X was not much different from that of the average farmyard manure. The average input of chemical fertilizer for cucumbers and eggplants was higher, while the average farmyard manure input for tomatoes and peppers was higher. In terms of labor input, the inputs for tomatoes and cucumbers were relatively higher. In terms of irrigation, the average cost of irrigation for eggplants was the lowest, which was approximately 1130 yuan/hectare, while the average cost of machinery input for eggplants was the highest, which was 943 yuan/hectare. Other input primarily included the costs of seeds, agricultural film, technical services, and repair and maintenance fees. Among them, other inputs for tomatoes were the most expensive, with an average of 16768 yuan/hectare.
3.1.2. Comparison of the characteristics of greenhouse and open-field vegetable samples
Among the 208 samples, 138 were open-field vegetable samples, and 70 were greenhouse vegetable samples. Among all the five vegetable crops, cabbages were all cultivated in open-fields, and thus there was no greenhouse cabbage sample. The comparison between open-field vegetables and greenhouse vegetables in table 2 clearly revealed that the yield of greenhouse vegetables was 19.08% higher than that of open-field vegetables, and the output value was more than twice that of open-field vegetables. Meanwhile, the input cost of greenhouse vegetables was also much higher than that of open-field vegetables. The average input level of pesticides was 67.5% higher than that of open-field vegetables. Similarly, the inputs including fertilizer, irrigation and labor in greenhouse systems were all more than twice as much as those in open-field systems. Owing to high input costs and the intensive production of greenhouse vegetables, the quality of vegetables has been improved, and their prices are higher as well. The average unit price of vegetables was 73.9% higher than that of open-field vegetables.
Table 2. Average input, output, and price of five vegetable crops by field and greenhouse production.
| Field vegetables | Greenhouse vegetables | |
|---|---|---|
| Yield (kg/hectare) | ||
| Tomato | 56623 | 68826 |
| Cucumber | 53612 | 69424 |
| Eggplant | 53443 | 78769 |
| Pepper | 42836 | 57411 |
| Cabbage | 80205 | N/A |
| Pesticide Input (yuan/hectare) | ||
| Tomato | 2270 | 3193 |
| Cucumber | 1774 | 2728 |
| Eggplant | 1568 | 2379 |
| Pepper | 2066 | 2691 |
| Cabbage | 893.5 | N/A |
| Products Price (yuan/kg) | ||
| Tomato | 1.764 | 2.472 |
| Cucumber | 1.458 | 2.381 |
| Eggplant | 1.539 | 2.42 |
| Pepper | 2.058 | 3.06 |
| Cabbage | 0.491 | N/A |
Data collected from National Agricultural Product Cost-benefit Data Compilation, China Statistical Yearbook, and City X Statistical Yearbook. Variables related to costs have been deflated with the Price Index of Agricultural Production.
Among the five types of vegetables, the pesticide input of vegetables in greenhouse systems was higher than that in open field systems, and the pesticide input of cucumbers and eggplants cultivated in greenhouse systems exceeded that in open-field systems by 53.8% and 51.8%, respectively. The prices of open-field and greenhouse vegetables were similar to the pesticide input of them, and the prices of greenhouse cucumbers and eggplants exceeded that of open-field ones to the greatest extent. Therefore, greenhouse vegetables with more pesticide input were sold at higher prices than open field vegetables, which to some extent implies that the amount of pesticide input will affect the prices of vegetables by affecting the quality and appearance of vegetables. In combination with the similar situation mentioned above in terms of yield of greenhouse and open field vegetables, we found that regardless of vegetable crops, high pesticide input usually led to higher yield and higher unit price. This is also why vegetable farmers tend to over-apply pesticides in order to obtain higher profits, despite the amount specified in pesticide instructions. However, what is the optimal amount of pesticide input? how do we define 'overuse'? Are there pesticide overuse problems in our samples? If so, to what extent? we will use the models constructed in section 2 to address these problems from the economic perspective.
By comparing the trends of pesticide input over time for greenhouse vegetables and open vegetables (See figure 2), it can be found that pesticide input for greenhouse vegetables increased rapidly from 1995 to 2004, and then remained basically unchanged till 2018. However, the pesticide input in open-field vegetables has been increasing slowly until 2014, and has shown a significant decline after the Zero Growth Plan in 2015. Although the pesticide input of greenhouse vegetables did not increase after the Zero Growth Plan, the absolute amount of pesticide input was still 55.7% higher than that of open-field vegetables, indicating it is highly likely that a large amount of pesticide input of greenhouse vegetables have led to the over-application issue of pesticides, which could become an urgent problem in facility agriculture. Yet whether there is indeed an overuse of pesticides in greenhouse vegetables and, if so, whether it would be alleviated by the implementation of the Zero Growth Plan needs to be further discussed in the next section.
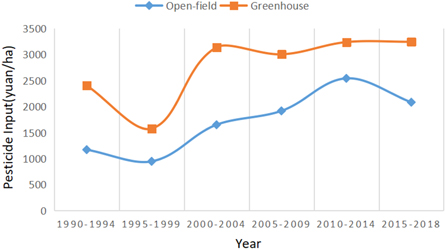
Figure 2. Comparison of pesticide input trend between open-field and greenhouse vegetables.
Download figure:
Standard image High-resolution image3.2. Results of model estimations
To accurately estimate the marginal productivity of pesticides, this study used the damage control model and the C-D production function model constructed in section 2.2 to evaluate the output and input data of five vegetable crops in City X from 1990 to 2018. Because of the sensitivity of estimated results to different parameter estimation approaches and to different functional forms, we first used the least squares method to estimate the C-D production function model where pesticide input was regarded as a traditional input and then employed the non-linear estimation method to estimate the two alternative functional forms of damage control model, i.e., exponential and Weibull forms, in order to show the significance of the choice of methodology.
Before estimating the three models directly, a simple correlation coefficient test and a variance inflation factor (VIF) test of the logarithm of independent variables were performed (See Supplement Materials). According to the test results, we eliminated two independent variables, machinery input, and other input, from the models to ensure that there were no severe multicollinearity issues. And we found that the correlation coefficient between irrigation input and pesticide input was still relatively large after eliminating machinery and other input from the models. This could be owing to the fact that pesticides are usually applied with water. Another fact is that the correlation between farmyard manure and labor input was also high at 0.628, which might be explained by the fact that the application of farmyard manure is relatively labor-intensive. Therefore, we then conducted a VIF test again on the rest of the independent variables and found that the mean of VIF was less than 2.5, which means that all the independent variables other than machinery input and other input can be simultaneously included in our models.
To estimate equations (9)–(11), logarithm processing was adopted for all dependent and independent variables in the three models. In addition, since the yield of different types of vegetable crops must be different and because the yield of the same crop would vary over time, we added the product term of time trend and crop variety dummy variables in our models to control variety fixed effects and time fixed effects. The results of the estimation of the damage control model whose distribution function followed the exponential and Weibull forms are reported in table 3, so are the estimation results of the C-D production function model as contrast, although we already knew that the C-D model would overestimate the impact of pesticides on yield [20–22].
Table 3. Estimations of C-D production function model and damage control model.
| Damage control model ln(Yield) | |||
|---|---|---|---|
| Variables | C-D production function Ln(Yield) | Exponential distribution | Weibull distribution |
| Ln(Chemical Fertilizer Input) | 0.032 | 0.044* | 0.038 |
| (0.99) | (1.62) | (1.29) | |
| Ln(Farmyard Manure Input) | 0.007 | 0.013 | 0.010 |
| (0.27) | (0.46) | (0.44) | |
| Ln(Labor Input) | −0.063 | −0.057 | −0.060 |
| (−1.27) | (−0.98) | (−0.91) | |
| Ln(Irrigation Input) | 0.046** | 0.061*** | 0.053** |
| (2.00) | (2.85) | (2.21) | |
| Planting Method * | 0.195*** | 0.205*** | 0.200*** |
| (5.61) | (6.46) | (6.33) | |
| Parameters of Pesticide Input | |||
| ρ | 0.058* | — | — |
| (1.67) | — | — | |
| θ1 | — | 0.130** | — |
| — | (2.15)** | — | |
| θ2 | — | — | 0.098*** |
| — | — | (2.63)** | |
| Constant | 10.082*** | 10.210*** | 10.497*** |
| (23.37) | (21.00) | (21.18) | |
| R2 | 0.591 | 0.585 | 0.589 |
Values in parentheses are t statistics. *significant at the 10% level; **significant at the 5% level; ***significant at the 1% level. ρ, θ1, and θ2 denote parameters of the influence of pesticide input on yield in model (11), (9), and (10), respectively. Since R2 of the NLS estimation results is meaningless, we did not judge the fitting effect of the three models simply by R2. All regressions include two-way fixed effects. a Planting Method equals 1 if the crop was planted in greenhouse, 0 if planted in open-field. b T-statistics of pesticide input of damage control models were generated by bootstrapping methods using 50 repetitions in algorithm computed in Stata 16.
The estimation results in table 3 show that the coefficients of pesticide input in three models were all statistically significant. All these three models verified that pesticide input had a significantly positive impact on vegetable yield to differing degrees, which were consistent with the results of Copper et al (2007), Poppat et al (2013), and Verger et al (2013) [5, 39, 40].
We can also find that most of the signs of the estimated coefficients of the control variables were as expected. In all of the specifications, we found a strong and significant impact of crop varieties, planting methods and irrigation on vegetable output. As to the elasticities of labor, however, they were all negative and insignificant in the three models. The reason behind it could be the fact that cabbages required the least labor yet yielded the most and that the average labor use exceeded 674 man-days per hectare. The elasticities of farmyard manure were also quite low and statistically insignificant in the above three models at approximately 0.007~0.013. Vegetable farmers spent as much as 4223.8 yuan per hectare on farmyard manure on average according to our sample. Hence, such insignificant marginal contributions of farmyard manure to vegetable production could be expected.
The interaction terms for cucumber and eggplant in the three models were insignificant and tended to be 0 because the average yield of these two types of crops was similar to the yield of tomatoes at around 60,000 kg per hectare. The coefficients of interaction terms for pepper and cabbage were significant in all three models with the former negative at −0.014 ∼ −0.015 and the latter positive at around 0.016 due to the fact that the average yield of pepper was lower than that of tomatoes and the average yield of cabbage was higher than that of tomatoes. The coefficients of the time trend were significant and positive at around 0.11–0.12, consistent with the fact that the average vegetable yield per hectare increased over time.
With the results of the C-D model as a contrast, we can find that the fitting effects of the exponential model and the Weibull model were both good with the exponential one slightly better. For example, the impact of chemical fertilizer input on yield in the Weibull model and in the C-D model was insignificant with t-statistic equal to 0.99 and 1.29 respectively, while the elasticity of chemical fertilizer in the exponential damage control model was 0.044, which was significant at a ten percent level. It indicates that for every 1% increase in fertilizer costs, ceteris paribus, the yield of vegetables increases by 0.044% on average.
We can draw the following conclusion according to the analysis of the estimation results. First, the pesticide input did have a significantly positive impact on the yield of vegetables and it affected vegetable yield in the form of damage control function, meaning that the input of pesticides reduced yield losses of vegetables by controlling pests and diseases. Second, the degree of impact of pesticide input on vegetable yield was about 0.098–0.130. Third, the planting method had a significant and positive impact on the yield of vegetables with a coefficient approximately at 0.2, indicating that the average level of yields of greenhouse vegetables was significantly higher, ceteris paribus, than that of open-field vegetables. Fourth, vegetable crop varieties and time trends had a significant influence on yield. Finally, we can also conclude that the input of chemical fertilizers and irrigation in the vegetable production process both had significant positive impacts on the yield based on the exponential damage control model according to the fact that estimation results of the exponential model fitted the data better
3.3. Calculation of the marginal productivity and optimal input level of pesticides
Based on the estimation results of the three models, we calculated the marginal productivity of pesticides at sample mean according to equations (9)–(11). The average level of pesticide marginal productivity of the five vegetables calculated using the C-D model estimator (MPC-D) was approximately 2.44, and those calculated by the exponential model (MPExp) and by the Weibull model (MPWb) were close to 0 at 1.91 × 10⁻⁸ and 2.6 × 10⁻⁶, respectively.
Comparing the margins calculated by the two damage control models with the one computed by the C-D model (See figure 3), we can readily see that the C-D model was inclined to vastly overestimate the marginal productivity of pesticides, which was consistent with the results of Lichtenberg and Zilberman (1986), Babcock et al (1992), and Wang et al (2018) [20, 21, 28]. Therefore, we drew the marginal curves of pesticides for five different types of vegetable crops based on the exponential damage control model parameter θ1 = 0.13, which was a more reliable estimation result according to the analysis in section 3.2. According to figure 4, the marginal productivity of pesticides of cabbages was the lowest and that of peppers was the largest, while the marginal productivity of tomatoes, cucumbers and eggplants was similar lying in the middle.

Figure 3. The marginal product of pesticides in vegetable production. Note: Marginal products were calculated using the means of all variables.
Download figure:
Standard image High-resolution image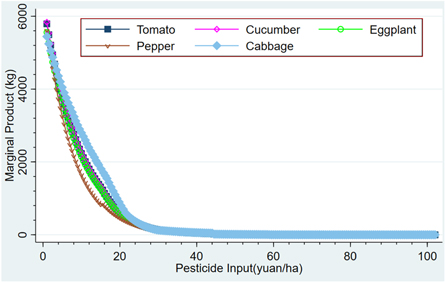
Figure 4. The marginal product of pesticides for five different vegetable crops under exponential damage control model. Note: Marginal products were calculated using means of each type of vegetable crops.
Download figure:
Standard image High-resolution imageTo be more prudent, we calculated the optimal pesticide input level based on the parameters both in the exponential model and in the Weibull model with the latter slightly smaller at 0.098, and gave optimal levels of pesticide input for different vegetable crops under both the exponential and the Weibull model (See table 4). Table 4 shows the optimal pesticide input levels and extent of pesticide overuse of different crops and different planting methods in detail. The calculation indicated that the optimal pesticide input in vegetables in City X was around 72.22∼92.9 yuan/hectare on average. Therefore, with the minimum pesticide cost at 162 yuan per hectare, all of our samples experienced pesticide overuse issues. This conclusion is in accordance with the fact that MPExp and MPWb were extremely close to 0. However, it is worth noting that during the process of calculating the marginal productivity of pesticides, we only considered them from the perspective of profit maximization and did not factor in the ecological hazards caused by pesticide residues and other social welfare losses, and thus, the marginal productivity of pesticides obtained through the damage control models could still be overestimated to some extent.
Table 4. The marginal productivity of pesticide, optimal pesticide input, and the extent of pesticide overuse.
| Optimal pesticide input Mi optimal (yuan/hectare) | Multiples exceeding optimal level Mi overuse | ||||
|---|---|---|---|---|---|
| Actual pesticide input Mi (yuan/hectare) | Exponential | Weibull | Exponential | Weibull | |
| Total | 2088.8 | 72.2 | 92.9 | 27.9 | 21.5 |
| Greenhouse | 2851.2 | 76.7 | 98.9 | 36.2 | 27.8 |
| Tomato | 3193.0 | 76.7 | 98.8 | 40.7 | 31.3 |
| Cucumber | 2728.1 | 76.4 | 98.4 | 34.7 | 26.7 |
| Eggplant | 2379.5 | 77.6 | 100.1 | 29.7 | 22.8 |
| Pepper | 2691.2 | 76.9 | 99.2 | 34.0 | 26.1 |
| Field | 1702.1 | 69.9 | 89.9 | 23.4 | 17.9 |
| Tomato | 2269.7 | 72.5 | 93.3 | 30.3 | 23.2 |
| Cucumber | 1773.9 | 70.4 | 90.6 | 24.2 | 18.6 |
| Eggplant | 1568.0 | 70.7 | 90.9 | 21.2 | 16.3 |
| Pepper | 2066.0 | 71.4 | 91.8 | 27.9 | 21.5 |
| Cabbage | 893.5 | 65.0 | 83.3 | 12.8 | 9.7 |
Actual and optimal pesticide input were calculated at sample means of all variables. Pesticide overuse multiples reflected the extent of pesticide overuse and were obtained by equation (16).
3.4. Analysis of the extent of pesticide overuse
All the 208 vegetable samples suffered different levels of pesticide overuse according to the analysis and comparison above. In short, the overuse of pesticides was found in 100% of the samples. To further study the pesticide overuse issue in City X, we analyzed how severe the overuse problem was, whether the extent of pesticide overuse differed among different vegetable crops and between open field and greenhouse planting methods, and whether the degree of overuse varied over time.
First of all, among all the five crops, the extent of pesticide overuse was the severest for tomatoes but the slightest for cabbages. Table 4 shows that the actual level of pesticide input (Mactual) of greenhouse tomatoes and open-field tomatoes were both the highest among all the five vegetable crops, 3193 yuan/hectare, and 2269.7 yuan/hectare, respectively. And the average level of actual pesticide input of tomatoes, no matter the cultivating method, was 2714 yuan/hectare, which was 26.8 to 35.2 times the optimal level, given that the range of optimal pesticide input (Moptimal) of all the tomato samples was [75.0 yuan/hectare, 97.6 yuan/hectare]. We also found that the extent of overuse of greenhouse tomatoes in 2001 was the highest among all the samples, whose actual pesticide input exceeded the optimal level input by 75-fold. Therefore, the extent of pesticide overuse (Moveruse) of tomatoes was also the most serious among different crops. While both the actual and the optimal level of pesticide input for cabbages were the smallest, their extent of pesticide overuse was also the slightest, 12.8 times the optimal level according to the exponential model, and 9.7 according to the Weibull model. The degree of pesticide overuse for cucumbers, eggplants, and peppers was similar, with the intervals of pesticide overuse multiples at [22.4, 29.1], [17.8, 23.2], and [22.6, 29.4], respectively.
Secondly, from the perspective of planting methods, although the yield and unit price of greenhouse vegetables were superior to those of open-field vegetables, the overuse of pesticides was also more severe than that of open-field vegetables. On average, the optimal input level of pesticide costs for greenhouse vegetables was only approximately 7~10 yuan higher than that of open-field vegetables per hectare, but the actual input level exceeded that of open-field vegetables by 67.5%. Therefore, the average pesticide input of open-field vegetables was 17.9–23.4 times higher than their optimal level, while the average actual pesticide input of greenhouse vegetables was 27.8–36.2 times higher than their optimal level, which was far more serious than the degree of overuse of open field vegetables. To sum up, the extent of pesticide overuse in greenhouse vegetables was 55% higher than that of open-field vegetables.
Finally, in terms of time period, the average degree of pesticide overuse in vegetable crops in City X was still high after the implementation of the Zero Growth Action program in 2015 although the actual pesticide input of tomatoes and cucumbers has fallen sharply and that of peppers has declined slightly after 2015 (see figure 5). We found that the average degree of pesticide overuse for all samples after 2015 was 27.4% higher than that during 1990–2014. According to the length of green, orange, and yellow bars in figure 5, the extent of pesticide overuse for tomatoes, cucumbers, and peppers all presented downward trends after reaching their peak in 2010–2014. The rate of decline was the fastest for tomatoes, reflecting the huge drop in pesticide input for tomatoes. It is also worth noticing that the extent of pesticide overuse for cabbages and peppers after 2009 has shown clear drops. The reason why the extent of pesticide overuse was still quite severe after 2015 given that pesticide input in most samples has declined significantly was primarily owing to the abnormal increase and accumulation of pesticide use from 2000 to 2014, which formed an enormous base. Besides, as shown in figure 6, the extent of pesticide overuse in open-field vegetables also peaked during 2010–2014 and the degree of overuse in greenhouse vegetables reached its peak in around 2000–2004 and began to slowly decrease and remained stable since 2009. In general, although pesticide overuse remains a severe challenge for City X, the Pesticide Non-point Source Pollution Control Project initiated by the government of City X in 2009 and the Zero Growth Action promoted by the Ministry of Agriculture of China in 2015 might have played a role in controlling the growth of pesticide use in vegetable crops in City X.
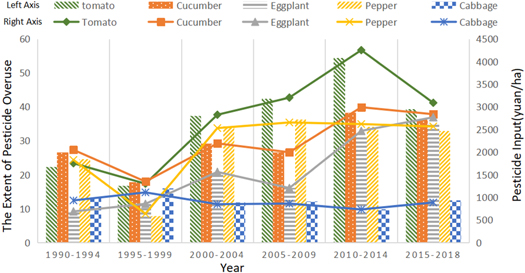
Figure 5. The trend of pesticide overuse and actual pesticide input for 5 types of vegetable crops based on estimation results of exponential damage control model. Note: The left vertical axis shows how many times the actual pesticide input exceeded the optimal level and the length of the bars reflects the extent of pesticide overuse in different vegetable crops. The right vertical axis shows the actual pesticide costs of vegetables per hectare and different lines reflect different pesticide costs of different vegetable crops.
Download figure:
Standard image High-resolution image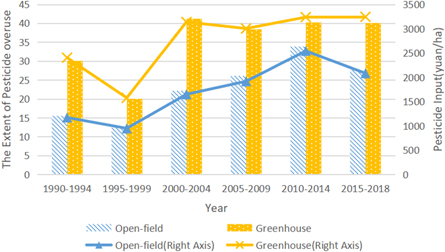
Figure 6. The trend of pesticide overuse and actual pesticide input for open field and greenhouse vegetables based on estimation results of exponential damage control model.
Download figure:
Standard image High-resolution image
4. Conclusions and policy implications
4.1. Conclusions
This article utilized the vegetable industry in City X as an example to study the extent of pesticide overuse in urban agriculture. Using the input and output panel data of five vegetable crops in City X from 1990 to 2018 under different planting methods, a damage control model was constructed. According to the estimation results, the marginal productivity and the optimal input level of pesticides were calculated, the situation of pesticide overuse under different vegetable crops and open-field and greenhouse planting methods were compared. The impact of the promotion of relevant policies on the extent of pesticide overuse in vegetable crops in City X was analyzed. The research conclusions primarily include the following four aspects:
First, compared with the damage control model, the C-D production function model will overestimate the marginal productivity of pesticides. However, both the C-D production function model and the damage control model confirm that pesticide inputs significantly reduce the losses of yield of vegetables caused by pests and diseases. Because of this, it is common for vegetable farmers to apply large amounts of pesticides to obtain a high yield.
Secondly, from 1990 to 2018, the pesticide overuse in vegetable crops in City X has been extremely serious. Pesticide overuse problems existed in 100% of the samples, and the extent of overuse for all samples ranges from 1.2 times above the optimal pesticide input to 75 times above the optimum according to estimation results of exponential damage control model. The average level of optimal pesticide costs per hectare was around 72.2∼92.9 yuan and the average level of actual pesticide input exceeded the optimal level by 21.5 to 27.9-fold according to the Weibull and exponential damage control model. Among them, the pesticide overuse in tomatoes was the most serious.
Third, the pesticide overuse in greenhouse vegetables was much more severe than that of open-field vegetables. The study found that the planting method had a significant impact on the yield of vegetables. The average yield of greenhouse vegetables was significantly higher, ceteris paribus than that of open-field vegetables. In addition, the input of production factors including pesticides in greenhouse vegetables was also much higher than that of open-field vegetables. Although pesticide overuse existed in both open-field and greenhouse vegetables, the degree of pesticide overuse in greenhouse vegetables was 55% higher than that of open-field vegetables. Therefore, the pesticide overuse problem on greenhouse vegetables is even more urgent to be controlled.
Fourth, with the introduction and implementation of policies, such as Urban Agricultural Pesticide Non-point Source Pollution Control and Pesticide Reduction, the overuse problems of pesticides in the vegetable industry in City X have, to some extent, been alleviated. After 2009, the degree of pesticide overuse in vegetables in City X showed a relatively obvious decrease. After 2015, the rate of decline has accelerated even further, indicating that the two projects launched in 2009 and 2015 has achieved good results.
4.2. Policy implications
From the analysis described above, it is apparent that the implementation of relevant policies has achieved some control on the pesticide overuse in the vegetable industry in City X. However, the current extent of pesticide overuse in the urban vegetable industry is still relatively serious. To further control the use of pesticides in urban agriculture in vegetable production, it is necessary to refine policy plans, strengthen top-level design, fully consider the interests of all stakeholders, and ensure that all the departments work together to promote the smooth progress of pesticide reduction and hazard control. This article suggests the following specific changes.
First, the publicity and service level of the unified prevention and control policy adopted by the Chinese government should be strengthened. Currently, the main reason why the promotion effect of unified pest control measures by governments across China failed to meet the expectation was that the publicity was not sufficient for farmers. According to our investigation, most farmers often applied extra pesticides after unified pesticide application by village committees because they did not understand the policy or trust the effect of the unified application. There were also many farmers who choose to apply pesticides by themselves instead of by governments because they are worried about the high costs or poor effect of unified control. Therefore, strengthening the outreach of the unified prevention and control policy, reducing the price of services, and improving the level of service are the primary tasks to improve the effect of unified prevention and control and efficiently controlling the use of pesticides.
Secondly, urban agricultural big data ought to be utilized to forecast and prevent pests and diseases, to precisely apply pesticides, to strictly control the use of chemical pesticides, and to vigorously promote green and ecological control techniques. The applications of physical and chemical control techniques need to be promoted, such as 'light trapping,' 'color plate trapping,' 'sex attractant trapping,' and 'food lures trapping' in the vegetable industry. And new seed 'pelletized coating' technologies could also be used. Biological pesticides need to be promoted and the sale and consumption of highly toxic pesticides require strictly control. In addition, during the planting of vegetables in suburban greenhouses, the powder application method, insect-proof netting, silver gray film, and other techniques for repelling and avoiding insects should be applied.
Third, new media could be used to vigorously promote scientific and standardized pesticide use knowledge and new prevention and control technologies. In addition to traditional channels, such as television, radio, and lectures, new media such as WeChat and TikTok should be fully utilized to popularize scientific and safe pesticide application knowledge. Besides, the construction of the agricultural technical team should be strengthened to ensure that the grassroots technical personnel understands the latest prevention and control technologies and methods in a timely manner, and the agricultural technology popularization departments should be required to regularly cooperate with agricultural experts to conduct new green prevention and control technology training for suburban farmers.
Finally, investment in the research and development of new technologies, new pesticides, and new varieties requires an increase. Specifically, Cooperation with agricultural research institutes needs to be strengthened and the introduction and transformation of scientific research achievements to agricultural production should be accelerated. The research and development of high-efficiency, low-residue, and environmentally friendly pesticides and biological control technologies should be strengthened in order to cultivate excellent varieties with strong disease resistance and stress tolerance.
5. Research limitations and prospects
5.1. Research limitations
The limitations of the research are first reflected in the sample data. We adopted the data on the cost of pesticides per hectare obtained from statistical yearbooks as the pesticides input into models. Yet it will be more accurate and reliable if we directly collect the amount of pesticides through field survey for intuitive calculation. Secondly, the article only measures the excessive use of pesticides and does not further study the factors that lead to the excessive use of pesticides. Finally, there is a lack of quantitative research on the effect of the Pesticides Reduction policy.
5.2. Prospects
Subsequent research could consider directly obtaining data on the actual use of pesticides and the relevant information of individual farmers and their application behavior through field surveys, so as to carry out more accurate measurement of pesticide excess levels and explore the main factors affecting the dosage of pesticides. At the same time, quantitative causal inference can be made specifically for the relationship between the Pesticides Reduction policy and the decline in pesticide use.
Data availability statement
The data cannot be made publicly available upon publication because they are owned by a third party and the terms of use prevent public distribution. The data that support the findings of this study are available upon reasonable request from the authors.
Funding
This research was funded by PhD Research Initiation Fund of Hubei University of Automotive Technology (Grant No. BK202207), Manufacturing Industry Development Research Center on Wuhan City Circle, Jianghan University (Grant No. WZ2021Z02) and Humanities and Social Sciences Research Project of Education Department of Hubei Province (Grant No. 22Q135)
Conflicts of interest
The authors declare no conflict of interest.