
Abstract
Treating retinal diseases to prevent sight loss is an increasingly important challenge. Thanks to the configuration of the eye, the retina can be examined relatively easily in situ. Owing to recent technological development in scanning devices, much progress has been made in understanding the structure of the retina and characterising retinal biomarkers. However, treatment options remain limited and are often of low efficiency and efficacy. In recent years, the concept of in silico clinical trials (ISCTs) has been adopted by many pharmaceutical companies to optimise and accelerate the development of therapeutics. ISCTs rely on the use of mathematical models based on the physical and biochemical mechanisms underpinning a biological system. With appropriate simplifications and assumptions, one can generate computer simulations of various treatment regimens, new therapeutic molecules, delivery strategies and so forth, rapidly and at a fraction of the cost required for the equivalent experiments. Such simulations have the potential not only to hasten the development of therapies and strategies but also to optimise the use of existing therapeutics. In this paper, we review the state-of-the-art in in silico models of the retina for mathematicians, biomedical scientists and clinicians, highlighting the challenges to developing ISCTs. Throughout this paper, we highlight key findings from in silico models about the physiology of the retina in health and disease. We describe the main building blocks of ISCTs and identify challenges to developing ISCTs of retinal diseases.
Export citation and abstract BibTeX RIS

Original content from this work may be used under the terms of the Creative Commons Attribution 4.0 license. Any further distribution of this work must maintain attribution to the author(s) and the title of the work, journal citation and DOI.
List of abbreviations
| Term | Definition |
| Mathematical terms | |
| 1/2/3D | 1/2/3 spatial dimensions |
| ISCT | In silico clinical trial |
| ODE | Ordinary differential equation |
| PD/PK | Pharmacodynamics/Pharmacokinetics |
| PDE | Partial differential equation |
| VP | Virtual population |
| VVUQ | Validation, verification and uncertainty quantification |
| Biological terms | |
| AMD | Age-related macular degeneration |
| BrM | Bruch's membrane |
| CC | Choriocapillaris |
| CRA/CRV | Central retinal artery/central retinal vein |
| DCP | Deep capillary plexus |
| DR | Diabetic retinopathy |
| DRC | Deep retinal capillaries |
| DVC | Deep vascular complex |
| GA | Geographic atrophy |
| GCL | Ganglion cell layer |
| ICP | Intermediate capillary plexus |
| ILM | Inner limiting membrane |
| IOP | Intraocular pressure |
| IS | Inner segment(s) |
| IVI | Intravitreal injection |
| LACT | Lactate |
| MNV | Macular neovasculature |
| nAMD | Neovascular AMD |
| non-nAMD | Non-neovascular AMD |
| OCT | Optical coherence tomography |
| OCTA | Optical coherence tomography angiography |
| ONL | Outer nuclear layer |
| OS | Outer segment(s) |
| PO2 | Partial pressure of oxygen |
| ROS | Reactive oxygen species |
| RP | Retinitis pigmentosa |
| RPE | Retinal pigment epithelium |
| RPCP | Radial peripapillary capillary plexus |
| SVC | Superficial vascular complex |
| SVP | Superficial vascular plexus |
| VEGF | Vascular endothelial growth factor |
1. Introduction
The highly detailed images our eyes are capable of capturing necessitate the close interplay and coupling of many different cells and structures. The retina, at the back of the eye, is a complex and fragile tissue playing a major role in visual function. Small changes in the retina can lead to degradation of visual function which in turn can severely affect patient quality of life. As such, it is perhaps not surprising that many severe visual impairments find their root in the retina.
A number of devices exist to observe the retina and clinically relevant biomarkers, often non-invasively. For instance, optical coherence tomography (OCT) and its angiographic extension (OCTA) enable non-invasive three dimensional, high resolution scans of the retinal structure and vessels in a matter of seconds [204, 267]. These devices undoubtedly improve clinical care by providing accurate measurements of biomarkers, such as oedema, which in turn informs treatment strategies [137]. As these devices are non-invasive and high resolution, progression of retinal diseases can be monitored with repeat scans. Following diagnosis, treatment strategies tend to be standardised, based on successful clinical trials guidelines. However, treatment response varies between patients, indicating that alternative or tailored treatments may be needed. The development of new treatments or dosing strategies is long, arduous and expensive, with only a small fraction (5%–20% depending on the field [199, 299]) of clinical trials succeeding, mostly due to an inability to prove effectiveness [102].
In silico modelling can offer insights on the underlying causes of disease, which are often hard or impossible to obtain by experimental or observational means. The past two decades have seen a rise in the use of such models for basic research in biology and medicine. Furthermore, the use of digital evidence to inform clinical trials is also gaining traction. The recent increase in the number of literature reviews on mathematical models of the eye and the retina and the development of platforms for simulating the eye accessible to non-modellers demonstrate increased interest in ophthalmology [19, 22, 37, 129, 233, 245, 252].
In silico clinical trials (ISCTs) can enhance both clinical care and traditional clinical trials, preserving sight for the fast-growing number of patients suffering from retinal disorders. In short, ISCTs are computer simulations of clinical trials that can be used as digital evidence in the development of medical products, devices and interventions. A more comprehensive overview of ISCTs is given in section 7. Running ISCTs requires a close collaboration between experimentalist, modellers and clinicians (see figures 2 and 9). Other medical disciplines such as oncology and cardiology have already benefited from in silico trials [43, 238]. Ophthalmology can also benefit from such trials which require large amounts of data. Indeed, the retina provides researchers with a wealth of images and measurements that is perhaps unparalleled in other medical specialities.
In this paper, we will review state-of-the-art models of the retina, both in health and disease, and highlight the challenges to developing ISCTs for retinal diseases. The remainder of this paper is organised as follows. In section 2, we provide a brief introduction to the physiology of the retina and summarise available treatments in retinal diseases. In section 3, we define terms and concepts related to in silico modelling. Sections 4 and 5 review models of the retinal physiology in health and disease, and models of the treatment of major retinal diseases. Section 6 is dedicated to models of therapeutic procedures. Section 7 defines in silico trials and provides the reader with examples of their successful application. Finally, in section 8, we summarise the state of mathematical models of the retina and provide a plan of action to achieve ISCTs for retinal pathologies.
2. Retinal physiology and therapeutic approaches
2.1. Physiology
2.1.1. Retinal layers, cells and the visual cycle
The retina is a layer of tissue less than 0.5 mm thick that lines the back of the eye [121]. The retinal inner surface is attached to the vitreous body, the clear gel that separates the lens and the retina; while its outer surface is attached to Bruch's membrane (BrM) (figure 1). When looking at a cross section of the retina, as shown in figure 1, several layers can be identified. The innermost (closest to the vitreous) being the nerve fibre layer and the outermost being the retinal pigmented epithelium (RPE). The layers located inward from the RPE are made of neurons and synapses and are collectively referred to as the neurosensory retina. In the neurosensory retina, different types of cells can be found, each with specific functions, including photoreceptors, namely rods and cones capturing incoming photons; retinal ganglion cells, a group of neurons through which axons transmit visual information to the brain; amacrine cells, a group of intermediate neurons spreading mostly horizontally; bipolar cells, vertically oriented neurons that link directly photoreceptors and ganglion cells directly; and horizontal cells which are horizontally oriented neurons regulating the output of multiple photoreceptor cells [182]. In the centre of the retina is a oval-shaped pigmented area called the macula that can be seen on photographs of the retina (figure 1). The macula is about 5 mm wide at its widest and is responsible for highly detailed central vision owing to its high concentration of photoreceptor cells, namely rods and cones. In particular, cones are highly concentrated in the centre of the macula, in a pit approximately 1.5 mm wide named the fovea. The macula is a critical area of the retina, as this is where visual acuity is highest. As such, pathologies are most damaging to visual acuity when affecting the macula.
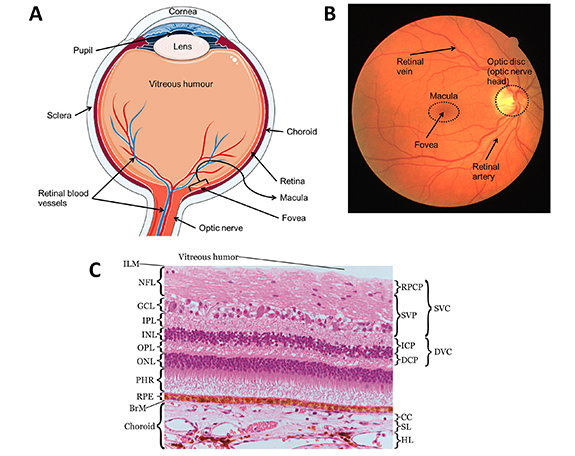
Figure 1. Anatomy of the eye and the retina. (A) The anatomy of the eye. The figure was partly generated using Servier Medical Art, provided by Servier, licensed under a Creative Commons Attribution 3.0 unported license. (B) Anatomical features of the retina seen on a fundus photograph. This fundus photograph was taken from the publicly available DRIVE database [269]. (C) The retinal and choroidal layers and membranes. From inner retina to outer choroid: inner limiting membrane (ILM), nerve fibre layer (NFL), ganglion cell layer (GCL), inner plexiform layer (IPL), inner nuclear layer (INL), outer plexiform layer (OPL), outer nuclear layer (ONL), photoreceptors (PHR), retinal pigmented epithelium (RPE), Bruch's membrane (BrM), choriocapillaris (CC), Sattler's layer (SL), Haler's layer (HL). Reproduced from [277]. CC BY 3.0.
Download figure:
Standard image High-resolution imageVisual information originates from light hitting the retina. The light crosses the inner retina to reach the photoreceptors, in the layer lying inward from the RPE (see figure 1). Activation of photoreceptors by photons starts a cascade of biochemical reactions that transforms light into electrochemical signals [58, 138]. Reversing direction, the now electrochemical information travels from the photoreceptors through horizontal and bipolar cells to reach the ganglion cells [58, 182]. The axons of the retinal ganglion cells travel in the nerve fibre layer and converge towards the optic disc and bundle together, forming the optic nerve which transmits the signal to the brain for further processing by the visual cortex [58]. The optic nerve is composed of the axons of the retinal ganglion cells, amounting to between 500 000 and 1.2 million, and is surrounded by connective tissue [255]. The optic nerve enters the retina through the optic disc, seen as a round spot, around 1.8 mm in diameter, on fundus photographs of the retina (figure 1). The optic disc is an important structure of the retina in disease and is closely monitored by clinicians for symptoms of, for example, glaucoma.
Owing to its pigmentation, the RPE acts as a buffer for any remaining light, protecting the retina from light damage and preventing backreflection of light that may interfere with the visual outcome [41]. The RPE is formed of a single layer of epithelial cells, whose primary function is to support the photoreceptors and the choroid, a vascular layer lying outwards to the RPE (see section 2.1.2 for details of the vascular supply to the retina). To fulfil this purpose, the RPE acts as the blood-retinal barrier, regulating the transport of ions, fluid, proteins and other molecules [41].
The photoreceptors abut to the RPE. Through this close interaction, the RPE exchanges metabolites with the photoreceptors. The RPE also transports nutrients such as retinoids to the photoreceptor cells where they are essential for the production of the light-sensitive rhodospin protein [41]. By-products of photoreceptor activity are released into the systemic circulation via the choroid, one of the two circulations of the retina [41]. The cells of the RPE also play a major role in the immune response in the retina and in maintaining the choroidal vasculature through secretion of various vascular growth factors [41, 79].
2.1.2. Blood supply to the retina
Visual function requires high metabolic activity from the retinal cells, making the retinal tissue very oxygen demanding. In fact, the rates of oxygen consumption per unit volume of tissue are comparable for the brain and the retina [192]. To sustain the demand in oxygen, the retina is equipped with a dense network of capillaries, that branch out from the central retinal artery (CRA) and terminate at the central retinal vein (CRV). The CRA is a branch of the ophthalmic artery and the CRV drains into the superior ophthalmic vein [157]. Both the CRA and CRV enter and exit the retina along the optic nerve (see figure 1). The CRA's branches spread across four plexi within the inner retina, namely, the superficial vascular plexus (SVP) and the intermediate (ICP), deep (DCP) and radial pericapillary (RPCP) capillary plexus. The terms superficial vascular complex and deep vascular complex are sometimes used to designate the RPCP-SVP complex and the ICP-DCP complex, respectively [55].
The choroid is a vascular tissue of the eye that lies outward from the RPE, from which it is separated by BrM. BrM is a thin (2–4 µm), permeable barrier that provides structural support to the RPE and regulates gas and mass exchanges with the choroid [73]. The choroid is structured in three vascular layers. From the outermost to the innermost: Haller's layer, Sattler's layer and the choriocapillaris (CC). The diameter of the vessels in each layer decreases as it approaches the retina, with the CC composed only of capillaries, as seen on figure 1. The vascular input to the choroid is provided by the short posterior ciliary arteries (between 6 and 12), which are branches of the ophthalmic artery [157]. The large vessels of the two outer layers of the choroid run parallel to the retinal axis. Some arterioles from Sattler's layer branch at an almost 90∘ angle to perfuse the CC [207]. Each of these arterioles inserts in the interior of a domain delineated by a set of draining venules surrounding it [308]. The capillaries of the CC have wide lumen (the cavity delimited by the vessel's walls), between 7 and 40 µm in the CC versus 5–10 µm for the retinal capillaries, and are arranged into a single plane, with many connections between adjacent capillaries, known as anastomoses [38, 63, 108]. Furthermore, the capillary walls have openings (fenestrations), increasing their permeability [207]. The fenestrations on the capillary walls are more numerous on the side facing the retina and are sufficiently wide to let molecules with a diffusional radius of 3.7 µm pass into the blood [38, 207]. This particular architecture, combined with a high blood flow, allows the CC to provide sufficient nutrients through transport across BrM and the RPE, and to clear waste from the retina through the systemic circulation.
The choroid has high blood flow and a high oxygen content [38]. The high concentration of oxygen in the choroidal circulation creates a strong gradient for its diffusion between the CC and the outer retina. The high blood flow rates may also help regulating the temperature of the macula, by keeping it at the same temperature as the rest of the body [38, 221].
The distribution of photoreceptors in the retina is heterogeneous, with a higher concentration in the parafovea, for rods, and fovea, for cones [306]. While appropriate blood supply is necessary to maintain vision, retinal blood vessels can interfere with light and hinder vision. For this reason, the centre of the fovea is an avascular zone around 500 µm wide, often referred to as the foveal avascular zone.
The interactions between layers of the retina, e.g. the RPE and photoreceptors, is essential for visual function. Disruption of the delicate structure of the retina leads to loss of sight.
While the retina is a key element for visual function, its relative fragility makes it susceptible to a number of conditions, some of which may lead to blindness. For example, diseases such as diabetic retinopathy (DR), neovascular age-related macular degeneration (nAMD) and retinal vessel occlusion lead to overexpression of vascular endothelial growth factor (VEGF), promoting the growth of harmful neovasculature within and around the retina [191]. These vascular pathologies, along with glaucoma, are described briefly in the foreword to section 4. As another example of retinal fragility, excess oxygen or oxygen deprivation have been hypothesised to help drive retinal degeneration in the diseases RP and non-nAMD respectively, as described in section 5.
2.2. Therapeutic strategies
2.2.1. Surgeries
Photocoagulation may be used to address abnormal neovasculature in DR or vessel occlusion [88]. The burn induced by the laser to the retinal tissue is aimed to stop further vascular growth by either sealing or ablating the aberrant blood vessels (focal laser photocoagulation) or by ablating in a wider range (panretinal laser treatment). In the case of panretinal laser treatment, it is thought that the damage brought to the retinal tissue causes a change in the oxygen supply and demand balance that could lower VEGF expression [88]. Photodynamic therapy is a similar approach which uses photochemical mechanisms to induce cell death rather than heat, which may be preferred for destroying neovasculature in the more fragile foveal region, for example in eyes with nAMD [260].
In eyes with glaucoma, the aim of surgery is to lower intraocular pressure (IOP). This can be done by decreasing the pressure in the aqueous chamber with eye drops or surgery [236]. Laser treatment of the trabecular meshwork, an area of tissue around the base of the cornea (figure 1), is used to improve drainage of the aqueous humour. In some cases, parts of the trabecular meshwork may be removed to allow further drainage in a procedure called trabeculectomy. Conversely, IOP can be lowered by decreasing the production of aqueous humour, acting on the inflow rather than the outflow of aqueous humour. This treatment, referred to as cyclodiode therapy, aims to reduce this inflow by destroying the ciliary body that produces aqueous humour [8].
2.2.2. Drug based
The regulation of IOP can be achieved with drugs. Indeed, most patients with glaucoma begin treatment with eye-drops, used daily to reduce IOP. The eye-drops are designed to lower the aqueous humour production, increase drainage of aqueous humour, or both [61, 236].
Retinal vascular disorders such as nAMD, proliferative DR or retinal vein occlusion, are for the most part treated with anti-VEGF [14, 158]. These drugs, mostly injected in the vitreous humour, bind to VEGF molecules that promote the growth of immature and leaky blood vessels. Anti-VEGF treatment has proven effective to suppress disease progression, reducing retinal oedema and restoring vision [14, 134, 158]. Steroids, either oral or intravitreal, can also be prescribed to reduce the production of pro-inflammatory cytokines such as VEGF in order to increase RPE function in patients with RP presenting macular oedema [274].
Deterioration of visual function due to ageing (cellular senescence), hastened by disease, has been addressed by a range of therapeutics called senotherapeutics. Their use is being investigated as a means to maintain vision in diseases such as non-nAMD which lack therapeutic targets [166].
2.2.3. Other
Alternative intervention types are possible; however, their use remain rare as they are investigated for efficiency and safety. Retinal prosthesis have started being approved for use in late stages of certain retinal diseases such as RP [177]. The artificial retina replaces or supports the degenerated photoreceptors, often via an external camera [177, 272]. The pixelated image is then transferred to the inner retina's neurons, relatively spared by RP, using microelectrodes. The transfer of the electrical signal to the brain is then achieved normally through the optic nerve [177, 272].
Because matured RPE and photoreceptor cells are unable to divide and proliferate, stem cell therapy is a promising therapeutic approach in eyes with photoreceptor or RPE atrophy such as AMD [35, 271]. Stem cells are found naturally in the body and have yet to form into a specific cell type. As such, they have the ability to form into many different cell types. Therefore, RPE or photoreceptor cells derived from mouse or human pluripotent stem cells and injected into the retina are able to replace degenerated cells and halt loss of or even improve vision [209, 240].
Gene therapy is an intervention that aims to slow the progress of inherited retinal diseases such as RP. It consists of introducing copies of healthy genes into the retina in order to reduce degeneration from disease-related mutations [32]. Viruses are designed to safely deliver the healthy genes to cells, which will either replace or silence the mutant genes [32].
3. Mathematical modelling
Broadly speaking, a mathematical or an in silico model describes the state of a biological system using a set of variables and a system of equations or rules which governs them. These equations translate in mathematical terms the modeller's understanding of the system. They form a theoretical framework which can be exploited with calculus and algebra to provide insights into the system and its underlying mechanisms. However, this framework also constitute a weakness of in silico models when the understanding of the system is wrong or incomplete. In contrast, machine learning models can give accurate predictions of a system's output without requiring a priori understanding. The mapping between independent and dependent variables is instead learnt from large datasets. However, machine learning models may suffer from other kinds of bias [217] and have limited value in furthering knowledge of the system's underlying mechanisms.
When designing an in silico model, one has to make choices among the variety of model types available. This choice is informed by the system to be modelled, the question to be answered and the resources available (e.g. data or computational resources). Because biological systems are so complex, the mechanisms modelled need to be kept to a minimum in order for the simulations to be tractable and interpretable. The process of designing and refining an in silico model follows a logic similar to experimental sciences and is summarised in figure 2. In this section, we give a brief overview of mathematical modelling concepts and typical challenges which emerge when modelling biological systems. A more comprehensive review can be found in the work of Roberts et al [245].
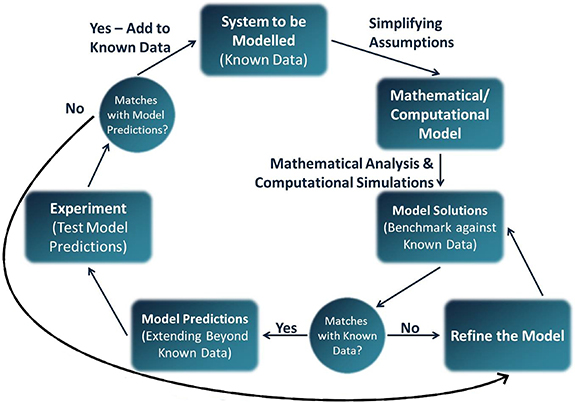
Figure 2. Modelling cycle of the design of an in silico model. Reprinted from [245], Copyright (2016), with permission from Elsevier.
Download figure:
Standard image High-resolution image3.1. Variables
An in silico model predicts a cause-and-effect relationship. In mathematical terms, the causes are referred to as independent variables because their value is independent of the other variables in the system. For instance, space, time and parameters are independent variables. This is opposed to dependent variables which represent the effects of changing the value of independent variables. Dependent variables are the outcome a researcher is interested in measuring, such as drug concentrations or fluid velocity. Dependent variables should be chosen wisely as to be comparable with available data.
3.2. Mechanistic vs. phenomenological models
To model a biological system, a relationship between the variables is hypothesised. For all types of models, the hypothesised relationship needs to be validated against data and reviewed accordingly (see figure 2). In phenomenological models, a relationship that best describes the data is used, without reference to the processes underlying the observed phenomenon. Curve fitting models, such as linear regressions, are examples of phenomenological models. In contrast, mechanistic models incorporate into the model the biological processes that are thought to be underlying the observed phenomenon. Those biological processes can, for the most part, be described using well-established physical laws, such as Fick's laws of diffusion. For complex or unknown processes, a phenomenological description may be used within a mechanistic model, see for instance the models of autoregulation in section 4.1.1. Because simplifications are inherent to modelling, no model is fully mechanistic.
Biological mechanisms that can be described by a mechanistic model include diffusion (e.g. oxygen diffusing in retinal tissue, see section 5), advection (i.e. transport by a fluid's motion; see models of oxygen transport in the blood stream in section 4.1) and permeation (e.g. the transport of drugs across the RPE in PK models in section 4.2). In contrast, theoretical frameworks for mechanisms such as oxygen consumption by cells or the Fåhræus-Lindqvist effect (see figure 3) are still missing. Therefore, phenomenological models may be employed. These are developed by examination of experimental data.
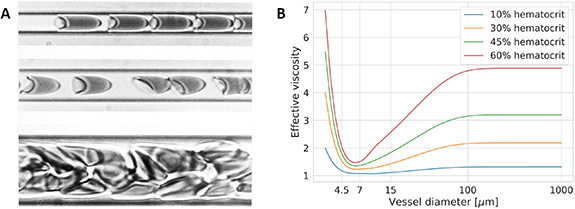
Figure 3. Example of the effect of capillary calibre on the flow of blood. (A) Red blood cells in suspension in blood flowing within tubes of different diameters: 4.5 µm (top), 7 µm (middle) and 15 µm (bottom). One can observe the flow of cells converging into a single file, surrounded by a layer of plasma as the diameter moves from 15 µm to 7 µm. A cell's shape adapts to fit into the tube as the diameter approaches that of the cell (top row). [263] [28 May 2003], reprinted by permission of the publisher (Taylor & Francis Ltd www.tandfonline.com.) (B) Example of an empirical law for the effective viscosity of blood accounting for the Fåhræus-Lindqvist effect, a description of the decrease in blood viscosity with vessel diameter, and increased vascular resistance in smaller capillaries from the work of Secomb and Pries [264]. Note that the effective viscosity depends on the blood's red blood cell concentration (haematocrit).
Download figure:
Standard image High-resolution image3.3. Model parameters
All models involve a number of parameters. By altering their values, one can simulate variations of a system with the same model. This is analogous to experiments yielding different results for each participants. Some of those parameters may be known, either from direct measurements (e.g. IOP in most haemodynamics models in section 4) or theoretical formulae (e.g. vitreal diffusion times in the pharmacokinetic (PK) model of intravitreal injections (IVIs) in section 4.2). Because a mechanistic model is physics-based, its parameters have a physical or biological definition whereas the parameters in a phenomenological model may not. A direct consequence of this is that parameters in phenomenological models may be model specific and therefore cannot be used in a different model.
In cases where parameters are unknown, e.g. because they cannot be measured, in silico models can be used to estimate these parameters by fitting the models to data, where available. Even when parameter values cannot be determined, analysis of the model predictions may still provide useful insights on the system's behaviour. Indeed, in either case, tools such as sensitivity analysis and bifurcation analysis can provide insights into the system's behaviour for different parameter regimes. For instance, the model of transclera drug delivery [59] in section 6.2 uses sensitivity analysis to understand the relationship between drug concentration and retinal barriers whose permeability are unknown.
Knowing the physiological ranges for a model's parameters provides direct insights into the range of outcomes possible for the model. For this reason, ISCTs require both knowledge of these ranges and of their distribution within the populations of interest (see the 'Ocular Mathematical Virtual Simulator' in section 4.1.2). The task can become tedious when the number of parameters becomes very large, for instance in the full body model of haemodynamics in microgravity in section 4.1.1.
4. Retinal haemodynamics, vascular diseases, neovascular AMD and DR
Adequate blood flow is essential for the supply of nutrients and removal of cellular waste required to maintain visual function. The atypical dual circulation of the retina is both complex and fragile. It is thought that the inner vessels perfuse the inner 60%–80% of the retina, while the choroid supplies the remaining, more metabolically active outer layers around the photoreceptors [39]. It is also known that ocular blood flow is affected by, among other things, IOP, systemic blood pressure, metabolic activity and blood oxygen saturation [39, 188, 212, 231, 232, 242, 294]. Many retinal diseases have been linked, whether directly or indirectly, with abnormal haemodynamics [133, 191]. Indeed, in certain diseases such as nAMD and DR, retinal perfusion is so disrupted that pathological neovasculature starts invading the retina.
In this section, we review in silico models that contribute to our understanding of the normal physiology of the retina as well as models aiming at deciphering the aetiology of various diseases which may be linked with haemodynamics in the retina and the underlying choroid. More comprehensive reviews of models of the microcirculation, angiogenesis and oxygen delivery can be found in the work of Arciero et al [19, 22]. In addition, we present models of the PK and pharmacodynamics (PD) of anti-VEGF treatment which is commonly used to treat retinal vascular disorders.
4.1. Retinal haemodynamics
Retinal haemodynamics models are concerned with describing blood flow within the inner retinal or choroidal circulations and often rely on the Hagen-Poiseuille equation to determine flow in vascular segments. This equation is a simplification of the more comprehensive Navier–Stokes equations and is derived by making a number of assumptions. The Hagen-Poiseuille equation states that the volumetric flux of blood (Q) in a vessel of length l and radius r is driven by a pressure drop ( ) according to:
where µ is the apparent viscosity of blood which may account for changes in vascular resistance ( ) in vessels of varying diameter (see figure 3). The fourth power of the radius in the formulation of vascular resistance describes the strong effect that even small contractions or dilations of a vessel can have on blood flow. This relation between radius and flow is at the source of the autoregulation ability of blood vessels, which adapt their radius in response to a number of different cues [162]. The cellular constitution of retinal vessels suggests that blood flow is mainly regulated by arteries and arterioles [11, 162]. Evidence suggests that the choroid is also able, maybe to a lesser degree, to regulate blood flow [231, 242]. Neurological regulation (regulation by the autonomic nervous system) of choroidal blood flow has been suggested, in view of the rich innervation of choroidal vessels [33, 231].
In silico models provide valuable insights into the mechanisms that combine to provide healthy perfusion or, conversely, create conditions for the onset of retinal pathologies. The assumptions made in these models can be validated by comparing simulation results with in vivo measurements of changes in blood flow or vessel radii. Vessel radius in the inner retina can be measured from retinal scans such as fundus photographs or OCT [80]. Blood flow can be measured using devices such as a Doppler flowmeter or Doppler Fourier-domain OCT, in combination with radius measurements [80, 295]. Despite advances in imaging technologies, the visualisation of retinal vessels remain mostly limited to large to intermediate-sized vessels. The blood oxygen saturation can also be measured in vivo [116]; however, retinal oximeters remain experimental and are not broadly available. Reliable measurement of blood flow or vessel radii in the choroid is more difficult, though changes in haemodynamics can be observed in vivo [242, 259].
4.1.1. In health
Current understanding of perfusion in the retina has advanced significantly in recent decades. Inner retinal haemodynamics, in particular the SVP, have been studied extensively due to the relative ease of imaging this vasculature with OCTA and fundus photography. Conversely, outer retinal haemodynamics (perfused by the choroidal circulation) and DVC are less well understood due to the difficulty in imaging these vessels. Below we review models that simulate perfusion and oxygen transport in healthy retinas and which help complete our understanding of its physiology.
4.1.1.1. Haemodynamics in artificial retinal vasculature
Takahashi et al proposed an arterio-venous dichotomously branching and symmetric network in which all vessels within a given generation are identical [275]. The diameter of the branching vessels follows the principle of least energy described by Murray's law, stated in figure 4 [201]. This theoretical model was used to describe the distribution of flow and other haemodynamic parameters across the normal retinal vasculature. While clinical studies often report changes in the diameter of large retinal vessels in various conditions, its relationship with total retinal blood flow, a clinically relevant parameter, is unclear.
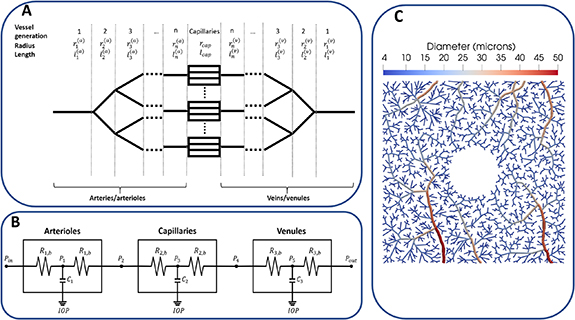
Figure 4. Different representations of the microvasculature in haemodynamics models. (A) An example of a dichotomous, symmetrical branching network similar to Takahashi et al's network [275]. The radius of branching vessels follows Murray's law, namely,  where r1 is the radius of the parent vessel, r2 and r3 are the radii of the branching vessels and γ is an exponent translating the fractal aspect of the vasculature and the symmetry of its branching pattern. Morphological studies have found γ to range between 2.6 and 3 [181, 275]. (B) An example of compartmental model where characteristics of the arterioles, capillaries and venules are summarised by resistance (Ri
) and capacitance (Ci
) parameters which may vary due to the action of external factors (e.g. changes in IOP). Blood pressure (Pi
) is defined at given nodes within and between vascular compartments. (C) An example of an artificial, realistic microvascular network of the macula generated by a constrained constructive algorithm. Here, the vessels are represented explicitly.
where r1 is the radius of the parent vessel, r2 and r3 are the radii of the branching vessels and γ is an exponent translating the fractal aspect of the vasculature and the symmetry of its branching pattern. Morphological studies have found γ to range between 2.6 and 3 [181, 275]. (B) An example of compartmental model where characteristics of the arterioles, capillaries and venules are summarised by resistance (Ri
) and capacitance (Ci
) parameters which may vary due to the action of external factors (e.g. changes in IOP). Blood pressure (Pi
) is defined at given nodes within and between vascular compartments. (C) An example of an artificial, realistic microvascular network of the macula generated by a constrained constructive algorithm. Here, the vessels are represented explicitly.
Download figure:
Standard image High-resolution imageTakahashi et al's network has been adapted to further investigate the physiology of the retinal vessels, in conjunction with clinical experiments [25, 216]. One of these studies showed that dilation of larger retinal vessels does not necessarily induce a change in total retinal blood flow [25]. In fact, simulations of different vasodilation patterns suggested that the diameter of smaller vessels, which elude measurements, was the main determinant of blood flow [25]. However, the validity of the modelling assumption that capillaries are able to vary their diameter remains unclear [162]. Pappelis et al used clinical data (systemic blood pressure, radius of larger retinal vessels) to create patient-specific networks based on Takahashi et al's method [216]. This allowed prediction of the autoregulation capacities of retinas in patients treated for hypertension or in eyes subject to ocular hypertension. It showed that the retinas of both healthy and hypertensive patients were closer to the lower limit of autoregulation, suggesting that the retina may be more sensitive to decreases than to increases in perfusion [216]. However, the calculations of autoregulation limits are purely phenomenological as no mechanisms for vessel dilation is included in the model and assumes that autoregulation happens solely in response to changes in blood pressure. Furthermore, the limits are based on CRA diameter ranges measured within the healthy study population. An earlier study yielded similar results for the autoregulation ranges for normotensive and hypertensive patients [120], despite using a compartmental approach rather than a theoretical vascular network. However, the baseline values of vascular resistances and validation relied on Takahashi et al's network [275]. These models add to the evidence that the autoregulation of the retina may be disrupted by disease or cardiovascular conditions (e.g. glaucoma, hypertension [216]) and therefore, knowledge of its normal range is important to develop comprehensive disease models. However, the autoregulation capacity of the retinal vessels remain unclear and the contributions of several other autoregulation pathways need to be elucidated.
Additional autoregulatory pathways were included in the modelling work by Arciero et al [18, 21]. While the same representation was used for the vascular network, the models differ from Pappelis et al's model by their description of autoregulation mechanisms. Vessel diameter varies with vessel wall tension which is given by the sum of passive tension (the difference in pressure on either side of the vessel) and active tension (induced by contraction of the vessel walls, influenced by various regulatory mechanisms). This almost comprehensive description of autoregulation allows quantification of the contributions of regulatory mechanisms, individually or combined. While such knowledge is valuable to understand the onsets of certain pathologies [18], suppression of individual mechanisms is nearly impossible to achieve in vivo. Sensitivity analyses of the models demonstrated that not only arterioles autoregulated their diameter in response to carbon dioxide concentration in the surrounding tissue and oxygen saturation in the venules, but also that those mechanisms were essential to retinal autoregulation. With those two mechanisms included, the predicted autoregulation ranges are in line with the findings by Pappelis et al [216], though maybe wider. However, the description of autoregulation remains mostly phenomenological, with contraction of vessels expressed as a linear combination of all stimuli. The weights for each stimulus were either taken from similar in silico models or fit to animal data [18]. Moreover, in the absence of sufficient experimental data, the response to metabolic demand used in the model makes strong, phenomenological assumptions on the distribution of oxygen along the vasculature and, therefore, the resulting parameter estimates must be taken carefully. Despite this, model predictions matched the blood flow distribution and ratio of diameters reported by independent studies [18].
4.1.1.2. Effects of extravascular pressure on haemodynamics
Retinal haemodynamics is also influenced by extravascular pressures. Indeed, in addition to the resistance to blood flow caused by IOP, the central retinal vessels (artery and vein) which enter the retina along the optic nerve are under pressure from the surrounding tissue and the cerebrospinal fluid, while the artery and vein may also compress each other [206]. The lamina cribrosa's purpose is to act as a buffer, protecting the central retinal vessels where the pressures described above interact.
Compartmental models have been used to investigate the relationships between intravascular and extravascular pressures and haemodynamics in the retina and choroid [64, 93, 120, 205, 226, 233, 254, 256]. In these models, similar vessels are sorted into compartments, e.g. CRA, arterioles, capillaries, venules, CRV and choroid (see figure 4). The physical processes within compartments and the interactions between them are summarised by a small set of parameters. By analogy with electrical circuits, the haemodynamics in each compartment are characterised by a resistance (the combined effect of the vascular resistance of a compartment's vessels) and a capacitance (the total amount of blood that can be stored in the same vessels).
This paradigm has been used to investigate the links between gravity-induced shifts in intracranial fluids, ocular fluids and pressures, and the loss of sight observed in astronauts [205, 226, 256]. These models attempt at quantifying the loss of perfusion caused by increased pressures induced by biological fluids onto blood vessels. This increase of pressure is also relevant to retinal diseases, e.g. glaucoma (see section 4.1.2). Because blood flow measurements may not be able to capture shifts in blood volumes during experiments (head tilting or microgravity conditions), IOP or systemic blood pressure shifts have been used as metrics for validation and analysis. The interplay between systemic blood pressure, IOP and compression of the CRA by the lamina cribrosa were also investigated by Prud'homme et al [233]. In the context of a sensitivity analysis, they created three virtual populations (normotensive, hypertensive and hypotensive) which differ by their blood pressure waveform. The parameters forming each virtual patients were sampled from probability distributions for blood pressure (systemic, diastolic and mean arterial pressure), IOP and pressure induced by the lamina cribrosa. Except for the latter, data for these parameters are easily obtainable from the literature or standard clinical examinations.
Others have used finite element modelling, a technique suitable for modelling of mechanistic forces, to understand the blood flow in the central retinal vessels [119, 145]. Guidoboni et al simulated the displacement of the lamina cribrosa and the stress due to changes in IOP and pressure induced by the cerebrospinal fluid [119]. The simulation of blood flow in the CRA showed good agreement with measurements made during IOP elevation, suggesting that the observed decrease in blood flow velocity is caused by the lamina cribrosa compressing the artery. Note that this model assumed a constant blood pressure, averaging the systolic and diastolic blood pressures. Pulsatility may have a significant impact on IOP and, consequently, blood flow in the central retinal vessels, and has been investigated within a more comprehensive model of the ocular structures [145].
Whether the vascular plexi in the retina, namely, the SVP, ICP and DCP, are connected in series or in parallel is still unclear. The in parallel configuration supposes that both arterial and venous connections exist between plexi. Conversely, in the in series configuration, blood inflow comes solely from the SVP, while venous drainage occurs only in the DCP. We refer the reader to figure 1 in the paper by Chiaravalli et al for a schematic of these two configurations [64]. The compartmental models developed in this paper simulate haemodynamics between the CRA and the CRV in five vascular compartments [64]. The authors modelled both configurations and compared the responses of each plexus to IOP elevation and occlusion of the CRV. The results showed that the vascular plexi in the in parallel configuration shared a similar response in both scenarios, whereas in the in series configuration, blood could be redistributed in the deeper plexi, yielding a different response for each plexus. The haemodynamic response seen in the latter configuration was closer to experimental observations, suggesting a primarily in series organisation of the vasculature. However, measurements of capillaries and their haemodynamics would be required for further comparisons. Unfortunately, because of the location of the ICP and DCP, and the size of capillaries, quantified data is still missing.
4.1.1.3. Choroidal circulation
While the inner retinal vasculature feeds the inner two thirds of the retina, the remaining third is perfused by the choroidal circulation. The CC (see figure 1) provides oxygen across BrM to the photoreceptors and other neuronal cells of the outer retina through diffusion only. Therefore, a high vascularisation is necessary to provide enough oxygen despite the distance. Defects in choroidal blood flow are associated with major retinopathies such as nAMD and DR [225]. Despite its importance, little is known about the physiology of the choroid. Likewise, little work has been done on modelling choroidal circulation. Early work tried to decipher whether the choroid of rabbits was able to regulate its flow in response to changes in systemic pressure [156]. Simulations in conjunction with experimental evidence suggests a autoregulatory reflex in the choroid triggered by blood pressure. Since then, only Zouache et al have modelled the physiology of the choroid and its peculiar architecture [307, 308]. By simulating the lobular structure of the CC, they investigated the effects of the geometry of lobules on the flow of blood. Their work suggested that the distribution of flow separators in the CC and the location of inlet and outlets in individual lobules may explain the localisation of oedema or neovasculature in diseased eyes [307].
4.1.1.4. Oxygen transport and spatial models
The transport of oxygen in retinal vessels has been modelled by several groups [60, 106, 173], though most of them are intended to study tissue oxygenation and are therefore reviewed in more detail in section 5. The earliest model used a short arteriolar tree, taken from a retinal photograph of a healthy young volunteer, and solved the Navier–Stokes equations to obtain the haemodynamics in these vessels [173]. The downstream vasculature was represented as a branching tree similar to Takahashi et al's [275] extending the outlets of the segmented arterioles. This model reproduced the distribution of intravascular oxygen observed in vivo and could serve as a baseline to analyse oxygen distribution in realistic vascular networks. However, reproduction of the retinal vasculature is limited to larger vessels. Additionally, oximetric data in the retina is scarce, making model validation difficult. Therefore, the use of artificial vasculatures (such as the one displayed in figure 4) with similar topological characteristics as the retinal vasculature may be useful to model the whole extent of the retinal vasculature. For instance, Causin et al used the fractal similarity between retinal vessels and diffusion-limited aggregation processes to generate a three dimensional network of three of the retinal vascular plexi [60].
Several other studies have used vessels reproduced from images to analyse the distribution of haemodynamic parameters and the influence of the morphology [113, 183, 184, 239]. The use of realistic vascular networks provides a link between haemodynamics and clinically relevant indices. The effect of tortuosity has been investigated on short, segmented sections of the retinal veins [183]. Malek et al characterised the flow distribution in reproduced arterioles and veins to quantify the impact of vessel tortuosity (a measure of how much a vessel differs from a straight line) on haemodynamic parameters [183, 184]. The Navier–Stokes equations were used to find flow within the arterioles, while peripheral circulation was accounted for by an impedance condition at the outlets of the segmented tree. The deformation of vessels caused by the pulse of blood is a computationally complex mechanism to model and a simplified model has been developed and applied to a similar reproduction of the retinal vasculature, with a brief analysis of its effects on haemodynamics [6]. Notably, Rebhan et al have considered the interactions of retinal haemodynamics and tissue stress using reproductions of the large vessels of healthy and diseased eyes, an aspect previously overlooked that may have importance in, e.g. glaucoma and diabetes [239]. Because of the difficulty to recreate extensive vascular networks from images, synthetic vasculature generated algorithmically may be used as complement or substitute (see figure 4(C)) [60, 65, 106, 291]. Their validation, however, is challenging given the lack of data on the distribution of vessels and haemodynamic parameters.
4.1.2. In disease
In disease, the haemodynamics of the retinal circulations may change drastically; however, the exact role of haemodynamics in the aetiology of vascular retinal diseases is still elusive.
One of the consequences of diabetes is the degeneration of the microvessels, such as capillaries, in the retina. Eyes with DR see an increase in vascular permeability, a loss of the pericytes coating capillary walls, a thickening of the endothelial basement membrane adjacent to endothelial cells and a rarefaction of capillaries around the foveal avascular zone [191]. These microvascular degenerations may cause microvascular occlusions, haemorrhages and oedema, as well as macular ischaemia and consequent neovascular growth [191]. Haemorrhages, oedema, scarring and RPE or retinal detachment are characteristics of nAMD associated with macular neovasculature (MNV) [121, 143]. Similarly to DR, neovasculature in nAMD is believed to be a result of an upregulation of VEGF by RPE cells [143]. However, the pathogenesis of nAMD remains unclear. Dysfunctions of the retinal circulations and subsequent ischaemia could partly explain increased VEGF concentrations, though dysfunction of the RPE and BrM have also been suggested to play a role in the pathogenesis of nAMD [10, 174, 225].
4.1.2.1. Models of pathological geometries
Rebhan et al compared haemodynamics in a model of vascular networks segmented from a healthy eye and eyes affected by glaucoma or diabetes [239]. The embedding of vessels in tissue revealed an increase in wall shear stress in diseased eyes compared with an healthy eye. However, it was noted by Rebhan et al that the absence of downstream vasculature is likely to affect the quality of predictions [239]. Along the same lines, higher vascular tortuosity, a common sign of disease, has been shown computationally to increase the pressure drop across the vasculature [183]. However, in this work, inflow boundary conditions for the venules were linearly interpolated from vessel diameter, which is dependent on vessel segmentation and introduces unquantified uncertainty in the results. In both models, analysis is limited to few vascular networks comprising few large vessels. Furthermore, simulating mechanical stresses requires knowledge of the mechanical properties of the vessel and retinal tissue. In vivo values of these parameters are not currently available and therefore the model's predictions are relative to the assumed parameter values [239].
Eyes with visual impairments such as myopia see a progressive change of the shape of the retina and may develop neovasculature [191]. This suggests a link between the curvature of the eye and retinal perfusion. However, the effects of curvature have been assumed insignificant in most haemodynamics models to date. Dziubek et al modelled this curvature by representing the retina as a thin, curved surface, within which an artificial network of vessels is embedded [83]. The tissue is considered a porous medium—with the embedded vessels acting as pores—with pressure in the tissue described by Darcy's law. The model confirms clinical suspicions of a change in retinal haemodynamics due to ocular curvature. Furthermore it highlighted the non-uniform effects on the retina, with the temporal region being less affected by ocular shape [83]. However, in the absence of data, tissue properties were assumed and, though the predicted pressure and velocity fields are within physiological ranges, model validation is limited.
4.1.2.2. Models of glaucoma and vessel occlusion
Besides DR, a number of conditions may cause blood vessels in the retina to clog or collapse. Accumulation of plaque caused by, for example, cholesterol, or a blood clot (embolus) in blood vessels form an obstruction to blood flow [191]. Sickle cell retinopathy causes a stiffening of red blood cells which can also result in occlusion of arterioles or capillaries, but also of the CRA [191]. Mechanical pressures such as ocular hypertension can cause the collapse of veins, including the CRV, when the external pressure becomes higher than blood pressure [133]. Stiffening of the CRA is suspected to also compress the CRV [191]. Occlusion of arteries causes non-perfusion areas in the retina, stopping visual function in the affected areas. Irreversible damage to the retina starts appearing after 100 min of non-perfusion [133]. Other symptoms include retinal oedema and, in some cases, neovascularisation in various locations, including the optic disc and the retina [191].
Glaucoma is thought to be a result of a combination of ocular hypertension, and changes in cerebrospinal fluid pressure and retinal blood pressure, which creates a pressure gradient compressing the optic nerve [31, 206]. The increased mechanical stress on the tissue induced by these changes causes a degeneration of the ganglion cell bodies (in the ganglion cell layer (GCL), see figure 1) and axons (forming the optic nerve). Vision loss in glaucoma is due to the loss of connectivity between the retina and the brain and cannot be recovered [236].
Numerous models have been developed to explain alterations of blood flow observed in eyes presenting with those pathologies [65, 119, 252, 254]. Elevated IOP, a hallmark of glaucoma, is expected to affect the retinal circulation, causing loss of sight. Modelling of the interactions between the ocular structure surrounding the central retinal vessels has shown the role of a stiffened lamina cribrosa resulting from such conditions [119]. In addition, the model by Guidoboni et al showed that the geometry of the sclera and the lamina cribrosa affect the sensitivity of blood flow to elevation of IOP. This framework was extended by Sala et al's to create the 'Ocular Mathematical Virtual Simulator', a simulation environment for the interactions of haemodynamics and biomechanics in the eye [252–254]. This environment allows haemodynamics simulations of individual patients characterised by a handful of clinical parameters such as IOP, systolic/diastolic blood pressures and intracranial pressure [254]. These parameters can be sampled from probability distributions generated from large population wide studies to form virtual populations. Interestingly, the model showed that the perfusion of the lamina cribrosa is also negatively affected by ocular hypertension, a potentially significant mechanism in the understanding of glaucoma [254]. Perfusion and haemodynamics within the lamina cribrosa have been modelled separately using a large number of artificial capillary networks statistically representative of different morphologies of the lamina cribrosa [65]. For a review of the use of mathematical models in glaucoma research, we refer the reader to the review by Harris et al [129].
4.1.2.3. Models of DR
Microaneurysms are an early manifestation of DR where the walls of capillaries form outpouchings disrupting blood flow and rendering them susceptible to rupture. We found four studies investigating haemodynamics in reconstructed microaneurysms using computational fluid dynamics models [34, 75, 168, 169]. Bernabeu et al considered the shape of microaneurysms and how this influences haemodynamics, and in particular shear rates, in an attempt to determine predictors of the likelihood of leaking blood clotting [34]. Similarly, Czaja et al investigated wall shear stress in microaneurysms in the event of stiffened red blood cells, another symptom of diabetes [75]. A notable difference with the previous model is the use of cell-resolved blood flow simulations, where individual cells are modelled and transported by blood flow. This allowed separate investigation of red blood cell and platelet flows, demonstrating the differences in penetration through the microaneurysm between the two cell types. Stiffened red blood cells were found to induce higher wall shear stress, particularly at the bottlenecks formed at the inlet and outlet of a microaneurysm. In two studies, Li et al also simulated the flow of red blood cells and platelets in microaneurysms with a focus on platelet flow through the microaneurysm, as they may be linked with the formation of blood clots [168, 169]. These models recreate the geometry of the microaneurysms from medical images. Because segmentation of such a fine structure is highly challenging and time consuming, reproducing those works on a large sample of virtual geometries is difficult. However, mechanical properties of blood constituents have been studied experimentally and therefore parameters are mostly known, to the exception of blood flow velocity the vessels surrounding the microaneurysms and the exact haematocrit.
Panretinal photocoagulation therapy is a common procedure to treat ischaemia in retinas with proliferative DR. While practice has shown the efficiency of the procedure, its mechanisms of action remain unclear. It is thought that the procedure acts by reducing the oxygen consumption of the photoreceptors affected by the laser-induced burn [93, 115]. However, effects of the therapy on blood flow have been observed [93]. Fawzi et al used a simple compartmental model to show how surgery could increase macular blood flow [93]. The model differentiates macular and peripheral vascular compartments, with the vascular resistance of the latter assumed to be increased after surgery. This increased resistance forces blood flow to be redirected towards the macula. The model predictions are consistent with the seemingly increased flow in macular capillaries, which would then explain the decrease in VEGF concentrations and the subsequent regression of neovasculature [93]. However, quantitative comparison with image based metrics is not possible with this non-spatial model. Furthermore, OCTA quantification is dependent on the device and the segmentation procedure and suffers from artefacts [267], making interpretation challenging. The burn patterns used in panretinal photocoagulation are also subject to debate. Gast et al investigated the effects of different patterns on the propagation of ischaemia due to capillary occlusion [115]. The model showed how different burn patterns affect the propagation of ischaemia and suggested that targeting the non-ischaemic peripheral retina with appropriate patterns may be effective at containing it.
4.1.3. Summary, future directions and prospects for ISCTs
Numerous models of retinal haemodynamics have been developed. Most of these models use simplified representation of the vasculature, such as compartmental [64, 93, 120, 205, 226] or structured branching networks [18, 21, 216, 275], which allows to separate the response of arterioles, capillaries and venules in various scenarios. As evidence of dysfunction of the retinal microcirculation accrues for various retinal conditions, it becomes increasingly important to understand the distribution of haemodynamics parameters along the retinal vasculature. However, the current understanding of the physiology of the retinal circulation is still lacking. Experimental studies to elucidate the relationship between IOP and retinal haemodynamics by artificially elevating or lowering IOP reached inconsistent conclusions [71, 100]. The dependence of the results on systemic blood pressure and autoregulation capacity, as shown by in silico models [18, 21, 120], in combination with the small sample size in these studies may explain those inconsistencies.
Validation of haemodynamics models is limited by the availability of clinical data and, by extension, is dependent on technological advances. For instance experimental data, and therefore modelling work, is focused almost solely on the superficial (and larger) vessels while the DVC and the choroid are often disregarded, probably due to the difficulty to isolate those layers. This needs to be resolved as numerous studies have found microvascular metrics of the DVC and CC to be predictive biomarkers of disease (retinal and systemic) or treatment response [150]. Most of those studies use machine learning methods, therefore lacking a mechanistic understanding of those correlations. Additional, specific experimental work would be valuable to develop mechanistic in silico models of the retinal circulation, both in health and disease. In the meantime, many of the models reviewed here were calibrated or validated against haemodynamics data of the central retinal vessels.
Despite these limitations, virtual populations described by a few accessible clinical parameters are within reach. This is evidenced by the model framework developed by Sala et al [252, 254]. Indeed, uncertainty quantification and sensitivity analysis were performed for the framework [233] and showed noticeable differences in the haemodynamic response of the retina of the virtual populations tested (namely, normo-, hypo- and hypertensive populations) despite the low number of parameters. However, when modelling certain diseases or interventions, incorporating additional details may be required, e.g. details of the haemodynamics in capillaries (see figure 3) and physiology [60, 115] or retinal morphology [83, 239].
Overall, while additional work, both in silico and in vivo, is required to characterise the choroidal and deep retinal circulations, the large amount of work on retinal haemodynamics form a solid base to developing ISCTs. However, intervention models remain scarce [93, 115] and are not designed for ISCTs as they lack data to be validated against and parameters that can characterise a population. Similarly, specific disease models have yet to be developed. Development in this area is dependent on the understanding of retinal vascular diseases. Indeed, the actual contribution of vascular defects in diseases such as DR or nAMD remains unclear and needs to be elucidated.
4.2. Anti-VEGF therapy in neovascular AMD and DR
In proliferative DR and nAMD, haemorrhages, oedema, scarring and ischaemia cause a rapid degeneration of the photoreceptors and the RPE and subsequent loss of sight [121, 143, 249, 290] These are consequences of the growth of leaky blood vessels, referred to as neovasculature, in the neural retina, especially in the macula. Pathological angiogenesis is driven by gradients of VEGF. Binding of free VEGF molecules to receptors on the walls of existing blood vessels triggers the proliferation and migration of endothelial cells along those gradients [94]. To prevent or halt complications due to neovasculature, clinicians often resort to anti-VEGF drugs which bind to free VEGF molecules to prevent their binding to the vasculature. Anti-VEGF drugs are injected directly in the vitreous humour, though alternative delivery techniques are being investigated [158].
Molecules present in the vitreous are naturally eliminated through the aqueous humour flow, referred to as the anterior clearance route. The posterior clearance route refers to clearance through the choroidal circulation. In addition, the inner limiting membrane (ILM) and RPE, bounding the inner and outer retina respectively, act as barriers to the molecules [219]. Therefore, the presence of the drug in the retina and choroid is limited to a fraction of the injected dose.
Despite its general efficacy, current treatment strategies are sub-optimal for some patients in terms of dosage and intervals between injections. Indeed, in both DR and nAMD, the real-world visual outcome of anti-VEGF therapy has been shown numerous times to be inferior to those reported by controlled clinical trials [66, 67, 210]. Furthermore, VEGF induced angiogenesis is a natural response to inflammation and hypoxia, in the eye and the rest of the body. Therefore, repeated injections pose a number of problems. Firstly, the IVIs can cause further inflammations within the retina, triggering additional VEGF upregulation [142]. Secondly, with the current doses, the unbound anti-VEGF molecules that are cleared from the eye are found in significant levels in the systemic circulation, raising concerns about the safety of IVI. Indeed, while it is still a matter of debate, it has been suggested that the IVI of anti-angiogenic molecules could be linked with serious adverse effects including haemorrhages and strokes [27, 148, 185]. Knowledge of the total exposure of the retina and the CC to the drug is important to develop better therapeutic molecules and administration strategies and to reduce the risk and burden on the patient.
While aqueous and vitreous humours can be sampled in vivo, the concentrations of drug in the retina and choroid remain unknown. Therefore, estimates of the retinal kinetics of molecules are often based on either animal experiments or on samples of the aqueous humour, the vitreous humour and systemic plasma. Mechanistic PK and PD models can help overcome the issue of the lack of in vivo data in the retina and provide insight into the complex relationships between drug characteristic and physiological parameters. Those models simulate the concentration-time profiles of a molecule in the eye (see figure 5) and can be validated by comparison with data sampled from the systemic circulation or ocular fluids. This section is dedicated to computational models of VEGF and its inhibitors, both individually (PK models, VEGF production models) and combined (PD models).
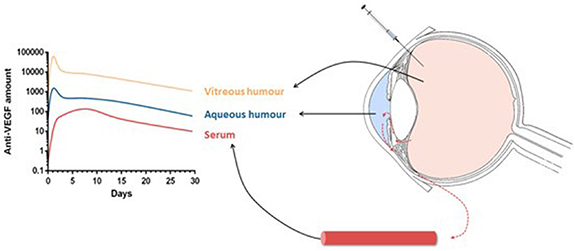
Figure 5. Schematic of anti-VEGF concentration profiles in compartments of a compartmental pharmacokinetics model. Reproduced from [114]. CC BY 4.0.
Download figure:
Standard image High-resolution image4.2.1. Compartmental PK/PD models
Often in PK analysis of ocular or systemic fluid, the half-life of a molecule is estimated by fitting exponentially decaying curves to the data in order to compute the total exposure to the drug (area under the concentration-time curve) and maximal concentration [29, 148, 219, 220, 301]. This assumes that the clearance rate of molecules in the eye is proportional to their concentration at all times and ignores potential effects of interactions with the tissue or the presence of multiple clearance pathways (e.g. the aqueous humour outflow and the choroidal circulation). Understanding the determinants of the PK of anti-VEGF molecules in the eye is essential to develop more effective molecules and such simple models do not provide this kind of insight.
Mechanical models have been used to determine the in vivo value of drug or physiological parameters (e.g. binding affinity or permeability coefficients), which may differ from in vitro values [45, 57, 139–141]. Analytical relationships between a molecule's characteristics and its ocular half-life can be derived from those models and can assist the design of longer lasting therapeutics.
In a series of papers, Hutton-Smith et al used two (vitreous and aqueous humours) and three (including the retina) compartment models to estimate the true, in vivo parameters of ocular anti-VEGF molecules [139–141]. They theoretically derived values of ocular half-life ( ) based on the diffusion time of a molecule within the vitreous, namely, the time required for a molecule to reach the boundary of a spherical vitreous chamber. The theoretical formulae elucidated that
  was approximately four times the vitreous diffusion time for all species considered, namely human, rabbit, rat and monkey. The relationship was confirmed by a linear regression on
  reported in experimental and clinical studies with the same species. In addition they developed a PK/PD model of IVI. Using this model to analyse the previous data, they attempted to determine the true, in vivo value of the dissociation constant between VEGF and its inhibitor. The dissociation constant is difficult to estimate experimentally but is an important determinant of the duration of VEGF suppression [139] and, as such, is essential to developing a mechanistic model of intervention. Analysis of the data of one drug with the proposed PK/PD model found it to range from 18 to 27 nm, a value orders of magnitude higher from the value found in vitro. This result highlights the difficulty of finding appropriate ranges for in silico models' parameters. Similarly, this difficulty is also evidenced by the work of Caruso et al [57] who reproduced Hutton-Smith et al's PK/PD analysis using additional, in-house data. In this work, the linear regression found a weaker dependence of
  on vitreous diffusion time (2.8 against 4.4 in Hutton-Smith et al's work). While this study incorporated additional data and an additional species, the main difference lay in the computation of the molecules characteristics, namely their hydrodynamic radius, which was found experimentally rather than derived theoretically. In addition to the dissociation constant, the diffusion times of anti-VEGF in the vitreous is expected to be sensitive to temperature and the viscosity of the vitreous humour, though this sensitivity is hard to quantify with a compartmental model.
4.2.2. Finite element PK models
While insightful on the relationship between ocular availability and molecular characteristics, compartmental models assume that VEGF, anti-VEGF and their compounds are well-mixed within each compartment. However, ocular fluid flow can impact the delivery of drug to the retina. Flows may be influenced by the structure of the eye and may differ strongly between species. A number of groups have developed finite element models of the eye, adding the contributions of ocular fluids, structure, heat and gravity to the PK analysis [164, 194, 305]. Such models can help make better use of experiments on animal eyes by providing a framework to translate data from one species to another or investigate spatial effects in PK, an aspect typically overlooked in most PK analyses [29, 57, 139–141, 148, 219, 220, 301].
Some of these models are reviewed here and a comprehensive review of those models and associated findings can be found in the review by Missel and Sarangapani [195].
Zhang et al used a simplified three-dimensional representation of the vitreous and the retina to investigate the distribution of molecules injected in the vitreous or under the choroid [305]. Their results support the well-mixed hypothesis of intravitreally injected molecules by showing the small effect the initial mixing has on the concentration-time profile. Furthermore, the model showed that suprachoroidal (between the sclera and choroid, see figure 1) injections were not suited for delivery of large molecules (such as anti-VEGF) due to the typically high clearance rate of the choroid (four times higher than vitreal clearance rates) and the lack of permeability of the RPE. Note that heavier molecules proved less sensitive to choroidal outflow rates and may therefore be suited for suprachoroidal injections. However, ocular anti-VEGF molecules are typically designed too small and are washed away quickly by the choroidal circulation. In addition, exposure of the retina is strongly impacted by the permeability of the RPE, both for suprachoroidal and IVIs. It was pointed out by Zhang et al that RPE permeability is likely to be affected in neovascular diseases. A reduced RPE permeability could make suprachoroidal injections more effective than their intravitreal counterpart. However, quantifying the permeability of the RPE is difficult due to its asymmetry (inward and outward permeability differ) and possible active transport mechanisms [229]. Similarly, it is difficult to find a physiological range for other molecule specific parameters such as diffusion in the various tissues modelled. For this reason, a plausible range for scleral permeability was found with a least-square fit to a single study's data and used to estimate diffusion coefficients in other layer based on an empirical formula. In addition to the use of the empirical formula for diffusion coefficients, only qualitative comparisons of model predictions and data was reported, therefore lacking in validation.
Missel created physiologically accurate three-dimensional geometries of the rabbit, monkey and human eyes to investigate the effect of inter-species structural differences on drug clearance [194]. They demonstrated the importance of the canal of Petit in the clearance of substances from the aqueous humour, particularly for molecules with slow diffusivity. Furthermore, they showed that an increase in IOP, within a normal range of 10–20 mmHg [28], significantly decreases the passage rate of the larger molecules from the vitreous to the aqueous. Here, too, plausible diffusion coefficients were extrapolated from the diffusivity of the drugs in the vitreous and aqueous humours. Another limitation is the absence of transport from the vitreous into the retina in most simulations. Indeed, as demonstrated by other models, for molecules of this size, an estimated 10%–20% of the injected drug exits the eye through the retina [141, 164]. Lamminsalo et al used the same geometry of the eye to quantify the contributions of anterior (through the aqueous humour outflow) and posterior (through the choroidal circulation) routes in the clearance of intravitreally injected molecules of similar weight to anti-VEGF molecules [164]. Moreover, this percentage increases with IOP, which might elevate with age and other systemic variables [23, 28, 131], due to the increased fluid flow in the posterior vitreous (i.e. at the surface of the retina). However, the transport rates of the injected molecules through the retina, RPE and BrM are not yet clear and may influence the posterior clearance rates. In later work, the group extended their earlier model to estimate the diffusion coefficients in those tissues using in vivo PK data and found an RPE permeability similar to the one found by Hutton-Smith et al [140, 165]. The parameter estimation in both those studies, however, relies on a single study in rabbit eyes and additional data from other sources is required for more robust estimations and validations.
4.2.3. Models of treatment outcome
Other models have simulated the effect of anti-VEGF therapy on clinically relevant features of nAMD, e.g. visual acuity and size of macular oedema [84, 136, 200]. These models can be compared directly with clinical trials and, potentially, can be used to run ISCTs, as discussed in section 7.
Using a compartmental modelling approach, Hoyle and Aslam showed that their model could reproduce the results from landmark studies of anti-VEGF therapy in nAMD [136]. This model is, to the best of our knowledge, the closest attempt at an ISCT for nAMD. Mulyukov et al attempted to model the response to therapy in terms of visual acuity with a mixed effects model [200]. The model was calibrated on a large dataset compiled from various clinical trials and captures the average trends of treatment response without using any patient-specific information other than visual scores and treatment strategy [200]. The addition of statistical variations in the model framework allows inclusion of random event in population wide simulations of anti-VEGF and the possibility to directly integrate future clinical observations into the model to increase robustness of the predictions. Building on this, Edwards et al added the buildup of tolerance to the drugs and its effect on visual outcome, using spatial and non-spatial models [84]. Using model parameters fitted to visual acuity readings for each patient in the clinical study, they were able to find a model-specific determinant of treatment response. This determinant of treatment response was described as 'the fraction of acuity the patient would expect to retain in the absence of any treatment' [84] and was found to be smaller than for almost all non-responsive individuals, suggesting a stronger disease activity in those patients. However, this parameter is found by fitting curves to data from clinical studies with specific treatment schedules and may therefore not generalise well to real-world data. The spatial model was not found to significantly increase the accuracy of predictions in terms of visual acuity, however, it highlights that drug concentrations in the retina are overestimated in non-spatial model that do not account for the spread of substances throughout the retina.
4.2.4. Summary, future directions and prospects for ISCTs
Overall, in silico modelling of anti-VEGF therapy is a well established area. Models have been designed to predict in vivo values of anti-VEGF drugs or tissue parameters, such as diffusivity, permeability and dissociation rates. Three dimensional models have been used to quantify spatial effects, such as pressure gradients, on the PK of ocular anti-VEGF, which are typically overlooked in classical PK/PD analyses. In addition, few groups have attempted at linking drug concentrations with clinically relevant biomarkers such as visual acuity or macular oedema sizes.
While the above mentioned models provide valuable insights into the PK of VEGF and its inhibitor, a number of issues need to be addressed. First, knowledge of physiological ranges for key parameters and understanding of their relation to disease and therapy is essential for robust, explainable ISCTs. The estimations provided by in silico models rely on measured concentrations in biological samples, mostly from ocular or systemic fluids or, more rarely, the retina. However, measurements of ocular concentrations are invasive and, therefore, are done mostly on animal eyes which may have very different properties compared to humans. The framework proposed by Missel [194] for translating experiments across species would be a valuable tool to make use of the wealth of animal data; however, additional validation by in vivo or in vitro experiments is required. Moreover, clearance through the retina was ignored in both Caruso et al's work [57] and the earlier model by Hutton-Smith et al [139]. This omission may have affected the quality of fit in those studies, overestimating the clearance rates through the vitreous humor. The retina was incorporated in later work to determine the distribution of transport and production rate in a population of nAMD patients [140, 141], an essential step towards a model of disease (see section 7.1). Determination of physiological parameters would require better understanding of the physiology of retinal tissue, in particular transport (active and passive) across the RPE.
A working model of disease, both for nAMD and DR is still lacking. Both neovascular diseases have been reduced to a non-mechanistic model of VEGF production, usually assuming a constant production rate. Edwards et al [84] proposed the most advanced model of nAMD to date. Still, all models of treatment outcome are almost purely phenomenological models and, as such, would be unsuited for ISCTs. It remains unclear what drives the neovascular growth seen in DR and nAMD, though oxygen deficiency and inflammation have been pointed out as potential explanations. The PD of anti-VEGF molecules needs to be modelled further to improve the generalisation of current models to new drugs. While most of the models account for the properties of drugs, their in vivo values may vary strongly from the values measured in vitro. This is exemplified by Hutton-Smith et al's estimation of the in vivo dissociation constant of ranibizumab [139] that lies orders of magnitude above the in vitro value. Lastly, three dimensional models have shown that pressure and temperature gradients in the front of the eye may be determinants of the exposure of the retina to intravitreally injected drugs [84, 164, 194, 305]. Whether these aspects need to be included in a model of intervention (see section 7.1) has to be clarified, taking into account that a spatial components increases tremendously the complexity of a model compared to a compartmental approach.
Finally, ISCTs of anti-VEGF therapy may be achievable in the next few years, provided that a mechanistic model of disease is developed for nAMD and DR. However, developing such models requires a better understanding of the pathophysiology of those diseases and therefore close collaboration with retinal physiologists. That collaboration would also help clear the uncertainty on certain key parameters. Nonetheless, a robust modelling framework is in place to estimate population parameters for ISCTs.
5. Retinal oxygenation, RP and non-nAMD
Retinal tissue oxygenation is one of the most highly modelled aspects of the retina and has important consequences for retinal diseases such as RP and non-nAMD, in which oxygen excess or starvation have been hypothesised to drive degeneration.
5.1. Retinal oxygenation
The retina has one of the highest rates of oxygen consumption per unit of tissue mass in the body [12, 13, 296, 303]. As described in section 2.1.2, it has a substantial vasculature to meet this need; nonetheless, supply and demand are finely balanced. It is therefore important to understand how this balance is maintained, and the ways in which it may be dysregulated in diseases such as retinitis pigmentosa (RP) and non-nAMD (see sections 5.2 and 5.3).
Two key techniques are frequently employed to measure retinal oxygenation. First, oxygen-sensitive microelectrodes can be used to measure the PO2, creating a spatially detailed profile through the depth of the retinal tissue [172]. Since this technique is invasive, it can only be employed in animal models. Second, oximetry can be used to measure the oxygen saturation of haemoglobin in the retinal vasculature [172]. As a non-invasive technique, this can be employed in both animals and humans.
Mathematical modelling of retinal oxygenation has great value. It enables us to get more information out of experimental data (e.g. calculating the rate of oxygen consumption of different retinal layers), to predict oxygen profiles in cases where these cannot be measured (e.g. in humans) and to determine how variations in retinal physiology or biochemistry may affect oxygen supply (e.g. in RP and non-nAMD).
A range of mathematical models have been developed to explore various aspects of retinal oxygenation. The most common approach is to model the 1D oxygen profile through the retinal depth using spatial ODE models, accounting for variations in oxygen supply and demand between layers (utilising anywhere between 1 and 8 model layers [42, 72, 82, 132, 171, 270]). These models have the advantage of being analytically tractable and can easily be fitted to microelectrode data. They can also be extended to incorporate other biomolecules such as neuroglobin, which has been suggested to play a role in enhancing oxygenation by transporting and storing oxygen [89, 246].
A similarly simple approach is to model each layer as a separate 0D compartment, predicting the evolving oxygen concentration in each compartment using time-dependent ODEs (see German et al [117] who also model nitric oxide concentrations).
More complex models also exist, extending into higher spatial dimensions (2D/3D) and/or incorporating more explicit representations of retinal vasculature, and blood flow mechanics and regulation (see figure 6, see also section 5.3 for models relevant to non-nAMD) [17, 20, 60, 103, 106, 107, 172, 189, 297]. These models are more computationally expensive than those described above; however, they have the advantage of more faithfully representing retinal physiology, and have the potential, in time, to be used in personalised medicine.
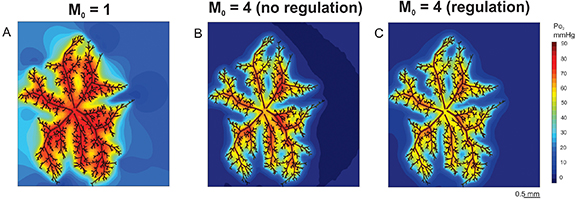
Figure 6. Oxygen distribution (PO2) within the arteriolar network and surrounding retinal tissue. Heatmaps are shown for low (A) and high (B and (C) tissue oxygen consumption rates, M0 (cm3O2/100 cm3 min−1), both with (C) and without (B) regulation (conducted metabolic response). Reprinted from [107], Copyright (2020), with permission from Elsevier.
Download figure:
Standard image High-resolution image5.2. RP
RP is a term used to denote a group of inherited retinal diseases that result in progressive vision loss [126, 130]. RP typically presents as a rod-cone dystrophy, in which rod photoreceptors malfunction and die before cone photoreceptors, though the term is often used to encompass cone-rod dystrophies, in which cones are affected first, and rarer cases where both rods and cones are affected on a similar timescale [126, 130]. In what follows, we shall focus largely on the rod-cone dystrophy form.
Rods degenerate because either they or the underlying RPE express a mutant gene; however, cones do not typically express a mutant RP gene, so the cause of cone death is unclear [76, 95, 126, 127, 130, 251]. Five complementary mechanisms have been proposed to explain secondary cones loss: 1. oxygen toxicity [273, 276, 281], 2. trophic factor depletion [3, 62, 167], 3. metabolic dysregulation [234, 235], 4. toxic substance release [241] and 5. microglia activation [122]. Thus far, mathematical models have been developed to explore the first four of these mechanisms. These studies demonstrate an important strength of mathematical modelling, namely its utility in isolating mechanisms in ways that would be difficult, if not impossible, experimentally.
Roberts et al have developed reaction-diffusion PDE models for the oxygen toxicity (1D and 2D) [247, 248] and trophic factor (1D) [243, 244] hypotheses. These models were the first to formally address the long-unanswered question as to which spatio-temporal patterns of retinal degeneration (and hence visual field loss), characteristically observed in RP patients, these mechanisms are capable of generating. It was found that oxygen toxicity may account for a subset of these patterns (see figure 7) [247, 248], while, under the simplest of assumptions, the trophic factor mechanism was unable to account for any of them [243]. Relaxing some of these assumptions, in particular, allowing the mutation-induced rod degeneration rate and cone susceptibility to trophic factor depletion to vary spatially, an inverse problem was solved, identifying biologically realistic conditions under which trophic factor depletion could recapitulate known patterns of retinal degeneration [244]. These models were also used to determine the conditions under which patches of retinal degeneration will expand or remain stable, and to predict the effects of treatment with antioxidants and trophic factors [243, 247, 248].
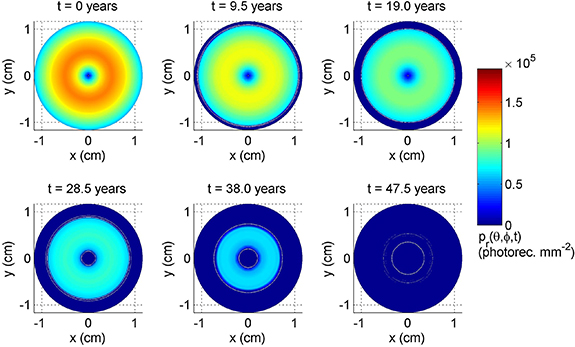
Figure 7. Exemplar spatio-temporal pattern of rod degeneration in RP, generated by the oxygen toxicity mechanism (the cone degeneration pattern is identical). The model replicates a classic pattern of retinal degeneration in RP, incorporating degeneration expanding inward from the retinal periphery (ora serrata) and outward from the parafoveal/perifoveal region. Reproduced from [248]. CC BY 4.0.
Download figure:
Standard image High-resolution imageCamacho et al have constructed a range of well-mixed and compartmental ODE models, each exploring one or both of the trophic factor depletion and metabolic dysregulation hypothesis, under both healthy and RP conditions. Under healthy conditions, their models replicated the rhythmic variation in rod and cone outer segment length observed in vivo [47, 49, 70, 298]. Further, these models predicted conditions under which rods and cones can stably coexist, revealing that the assistance provided to the cones by the rods via a trophic factor is crucial in this respect [47, 49, 70, 298]. This group's retinal metabolic models are the most biochemically detailed to have been generated to date, using sensitivity and bifurcation analyses to determine which processes are most important in maintaining a healthy homeostasis [16, 52, 54, 81]. Under RP conditions, their models clarify and elucidate the stages of retinal degeneration that may be traced on the road to complete atrophy, highlighting which processes must change to allow progression to the next stage [46, 50, 51]. Further, they apply optimal control theory to identify optimal treatment strategies under various constraints [48, 53].
Lastly, Burns et al have formulated a 1D hybrid model for the toxic substance hypothesis, containing both continuous-deterministic and discrete-stochastic elements [44]. This model is effective in capturing the initial patchy loss of photoreceptors observed in RP, and is also capable of replicating the exponential decline in photoreceptor numbers measured in RP mouse models [68].
5.3. non-nAMD
The retinal disease AMD can be divided into three stages: early, intermediate and late [98]. The early and intermediate stages are distinguished by the development of pigmentary abnormalities and the size of cholesterol-rich deposits known as drusen (singular, druse) which form between the RPE and BrM (hard and soft drusen), and between the RPE and photoreceptors (reticular pseudodrusen/subretinal drusenoid deposits), while the late stage may be characterised as dry or wet [69, 98, 143, 300]. non-nAMD, considered in this section, consists of the early and intermediate stages, together with the dry form of the late stage (see section 4 on nAMD) [98]. In the dry late stage, the central retina and choroid degenerate in a process known as geographic atrophy (GA) [69, 143, 180]. A number of mechanisms have been suggested to drive non-nAMD including oxidative stress, drusen accumulation, cholesterol accumulation and lipofuscin accumulation [10, 128]. Mathematical models have been developed to consider each of these mechanisms and this area has great potential for future modelling studies [128, 179].
Mazzitello et al [187] and Family et al [90] constructed a simple stochastic model for the accumulation of lipofuscin, a chemical which builds up within RPE cells and may eventually prove toxic to them [268]. They capture the aggregation of lipofuscin granules, though they do not link this to RPE cell death. Zekavat et al [304] and Scheepers et al [258] have developed compartmental ODE models for drusen and cholesterol accumulation. The models capture features such as the build-up of drusen and their macrophage-mediated elimination, and determine regions of parameter space in which a healthy homeostasis may be maintained. Linsenmeier and Zhang [172] and McHugh et al [190] have developed 2D and 3D PDE models (respectively) to predict the effects of soft and hard drusen upon retinal oxygen distribution (see figure 8). It was found that it is the size of a druse, rather than the diffusivity of oxygen within a druse, which has the greatest effect on photoreceptor oxygenation, and that wide (soft) druse are more likely to cause photoreceptor hypoxia (oxygen starvation) than tall (hard) druse. Further, Vercellin et al [285] have constructed a 2D PDE model predicting the effects of reduced blood flow on central retinal oxygenation, identifying the most vulnerable regions. Lastly, Shen et al [265] formulated a simple phenomenological model to predict GA progression based upon measurements of GA propagation rates within the literature. The model is successful in replicating some of the patterns seen in vivo, though it is not capable of explaining the mechanisms behind these patterns.
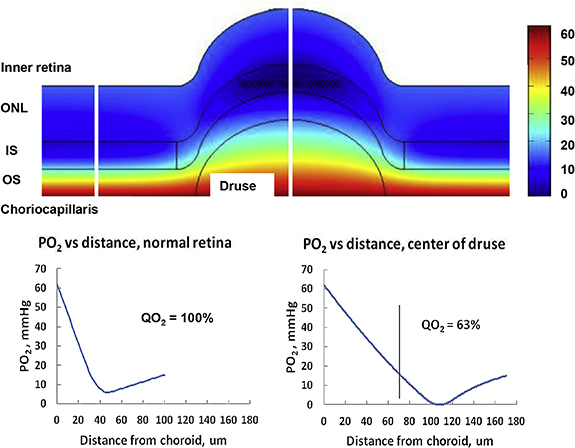
Figure 8. Oxygen profile (PO2) through the outer retina in the presence of a large druse. Top panel: 2D heatmap showing the oxygen profile across normal and druse-containing retinal regions. Bottom panels: 1D profile through the normal (left) and druse-containing retinal regions (right). Figure reproduced, with permission, from Linsenmeier and Zhang [172]. Abbreviations—OS: outer segment, IS: inner segment, ONL: outer nuclear layer. Reprinted from [172], Copyright (2017), with permission from Elsevier.
Download figure:
Standard image High-resolution image5.4. Summary, future directions and prospects for ISCTs
Retinal oxygenation and RP have both received substantive attention from the modelling community, though much work remains to be done. Non-nAMD, by contrast, has received comparatively little attention, though early work in modelling drusen biogenesis and the effects of drusen in the disruption of oxygen delivery show important steps in the right direction. Since the processes captured in many of these models are overlapping, some of these models could be repurposed for other applications. For example, Roberts et al [247, 248]'s models of hyperoxia-driven photoreceptor degeneration in RP could be applied to any retinal disease in which oxygen toxicity is thought to play a role in driving cell death (e.g. AMD), while Aparicio et al [16], Camacho et al [52, 54], Dobreva et al [81]'s metabolic models capture processes which are fundamental both in maintaining a healthy retinal homeostasis and in driving a range of retinal diseases, including RP and AMD. The increasing availability of clinical imaging data, especially SD-OCT and OCTA, together with a rise in omics data will furnish future modelling studies with a wealth of physiological and biochemical information, guiding model development, facilitating more detailed model testing and validation, and paving the way for ISCTs.
6. Drug delivery to the retina
In this section we review models aimed at optimising or developing drug delivery techniques for the treatment of retinal diseases. Ocular drug delivery, including delivery to the retina, has recently been reviewed elsewhere from a computational fluid dynamics point of view [37]. Thus, this section will focus on models that were not covered in said review.
6.1. IVIs
In silico models of the PK and PD of anti-VEGF molecules, mainly administered inside the vitreous, have been discussed in section 4.2. Here, we focus more specifically on models aimed at understanding and optimising the surgical procedure of injecting drugs in the vitreous humour and how the outcome may be affected by the eye's characteristics.
The effects of injection parameters such as needle shape, angle of insertion and speed of injection may affect the delivery of drug to the retina and are hard to assess in vivo. Several models have been developed to identify these effects using finite element meshes which realistically capture the geometry of the eye. Some studies assume the initial dose to be spherical with drug concentration equal to the dose [104, 105]. In these studies, the initial location of the dose was demonstrated to affect the time taken to clear the drug from the vitreous by almost four-fold for the configurations tested [104]. However, flow in the vitreous was neglected. Therefore, drug transport was solely due to diffusion and thus strongly dependent on the dose [104]. Needle type, injection speed and needle penetration angle were accounted for to describe the initial concentration profile in another finite element model of the human eye [146]. In this model, the drug was transported by flows in the vitreous as well as by diffusion. Furthermore, injection parameters affected the shape of the initial drug distribution, although the needle was not modelled explicitly. The model showed significant sensitivity to the injection parameters on the exposure of the macula to the drug. Slower injections and larger needle gauge were shown to increase the concentration peak at the macula by an order of magnitude compared to a model assuming a spherical initial dose distribution. Unsurprisingly, penetration angle strongly affects the concentration peak—by up to 80% for the macula [146]. This model showed the importance of considering advective transport of intravitreally injected drugs, as the velocity of the injected dose can increase peak concentrations at the macula by two orders of magnitude.
Injection parameters may also influence the risks of complications due to the procedure. By modelling the eye, the needle and their mechanical interactions, including deformation of the cornea, it was found that an angle of 45∘ between the needle and the optical axis was ideal to minimise complications [149]. To draw this conclusion, the authors assumed that post injection complications were correlated with the maximum principal stress, a stress component extensively used to predict material fractures. The increased stress caused by insertion angles closer to the vertical or horizontal axis seem to correlate with experiments which reported more injuries at those angles [149].
The vitreous humour undergoes changes causing its liquefaction [175]. Furthermore, in disease, vitrectomy may be performed to replace the vitreous humour by a substitute gel or oil in order to lower pathological traction at the interface with the retina [78]. Alterations in the properties of the vitreous humour, or its substitutes, have been investigated computationally with finite element models, where drug transport is modelled by advection-diffusion equations [2, 151, 196]. Point sources for the injection of the dose were used in these studies. The earliest model investigated the possibility of toxic levels of drugs in the retina [151]. The model showed that the exposure of the retina increases strongly in configurations with low diffusivity of the drug and low viscosity of the vitreous substitute, due to convection overtaking diffusion [151]. Shifts to predominantly convective transport of drug have been shown to occur due to saccadic movements typical of vitrectomised eyes [2, 196]. The finite element model showed that higher movement amplitude hastens the spread of the drug in liquefied vitreous, likely due to increases of secondary flow velocity with movement amplitude [2]. While homogenisation of drug concentration was reported to occur on a time scale of days, this may reduce to the order of minutes in vitrectomised eyes due to an increased advective transport [196]. Regardless, the availability of drug in the retina remains limited by the transport rates across the ILM, which is mostly unaffected by vitreal flows.
More recently, saccadic movement effects on intravitreally injected drugs have been simulated in a vitreous liquefied with age [99]. This model predicted that, in the presence of saccades, the drug concentration homogenised throughout the vitreous in less than a minute, where it would take about a day in the absence of saccades. Interestingly, it has been shown computationally that in locally liquefied vitreous (e.g. a substitute for the vitreous inserted surgically), fluid flow converges towards the liquefied region as it offers less resistance [154]. This result is of interest in understanding the kinetics of intravitreally injected drugs, especially larger ones such as anti-VEGF which are more subject to convection.
6.2. Implants/port-delivery
A number of models, including those discussed above, have been used to compare the efficacy of drug delivery to the vitreous by an injection or by a controlled release from a system implanted in the eye, typically in the vitreous or on the outer surface of the sclera [146, 151, 152, 218]. Overall, these comparisons highlight the capacity of controlled release systems to prolong the drug availability in ocular tissue. However, those models were not concerned with the mechanisms of drug delivery from those implants but rather assumed empirical release rates.
Understanding of the degradation process of vitreal implants is essential to control drug release. The effects of altered vitreous on this process have been modelled, coupling the degradation process of the implant to drug transport in the vitreous and retina [96]. Drug distribution profiles were simulated for two different vitreous humour substitutes, namely a silicone oil and a saline solution. The authors concluded that silicone oil substitutes could delay the degradation of the implant and provide higher mean concentration in the retina. By comparison, the saline solution substitute showed similar or lower concentrations compared to non-vitrectomised eyes [96].
In the model by Li et al the drug molecules were trapped within the mesh structure of a hydrogel, represented as a sphere [170]. Unlike the previous chemical degradation of the implant, degeneration of the hydrogel corresponds to loosening of the mesh over time, described as an empirical exponential law. Both the initial location and properties of the hydrogel were varied. Perhaps unsurprisingly, while the location did not affect the depletion of drugs within the hydrogel, positioning the hydrogel closer to the target site, e.g. the macula, caused higher and earlier peaks in concentration. However, higher peaks implied quicker clearance from the macula and therefore concentrations reach similar levels to other implantation sites within two weeks [170]. Hence, the location of the hydrogel has to be chosen wisely as to not induce toxicity while maintaining therapeutic levels of drug within the retina. In contrast, the hydrogel properties tested did not show a significant effect on macular concentrations, though tighter meshes cause a delay in the release of the drug.
Recently, a PK model specific to anti-VEGF molecules in the vitreous and aqueous humour, released from degrading spheres, has been simulated and validated against experimental data [135]. Note that, unlike some of the PK models of anti-VEGF described in the previous section, these models did not ignore convective transport in the vitreous or the other ocular tissues. Rather, these tissues are considered as porous media through which transport is driven by diffusion and a pressure gradient between the IOP in the anterior part of the eye and the lower pressure at the sclera [96, 97, 135, 153, 170]. In their noteworthy study, Khoobyar et al determine the depletion of drug from an implant [154]. Through rigorous mathematical analysis of a simplified drug transport model, they derived an analytical formulation for the estimated half-life of an implant in the vitreous which depends on the ratio of convective mass transfer to diffusivity. However, this estimate is valid only when diffusive transport dominates over convective transport.
The same equations can be used to describe the transport of molecules from the sclera to the vitreous, a scenario corresponding to implants inserted on the outer surface of the sclera. The case of a drug diffusing through such an implant to enter the sclera, later reaching the choroid and retina, was recently modelled in silico [1]. The model revealed the influence of implant porosity on the controlled release of drugs and suggested parameters that could be tailored to individual needs [1]. Kotha and Murtomäki also modelled drug release from a scleral implant, with the difference that choroidal blood flow was modelled explicitly [160]. The influence of diffusion coefficients in the sclera as well as the permeation coefficients regulating exchanges between each layer of tissue were quantified and demonstrated complex relationships between the parameters and the efficacy of the implant, however no comparison with experimental work was reported. In fact, neither model was directly validated against clinical data.
Of particular relevance to scleral implants are the retinal barriers to drug. The role of these barriers, namely the RPE-BrM complex, choroidal and retinal circulation, and the ILM, has been investigated in silico. Active transport by the RPE, along with clearance from the inner retinal blood vessels, were included in a model by Causin and Malgaroli [59]. The permeability of the blood vessels walls was shown to have little influence on clearance, though it is suggested by the authors that this could be a consequence of the simplifying assumptions made concerning mass transport between the retina and its vasculature. In contrast, active transport by the RPE was found to have a significant impact on drug concentration in the retina and vitreous. Other models came to the same conclusion, despite this specific transport mechanism being modelled differently [30, 160]. Despite this evidence, active transport across the RPE has generally been neglected in PK models of IVI and controlled-release devices.
6.3. Subretinal, periocular and systemic administration
While accumulating evidence suggests otherwise, the retina and the eye in general are thought to be isolated from systemically injected drugs, on account of the numerous biological barriers separating the eye and retina from the rest of the body. Therefore, systemic or intravenous administration of drugs for treatment of retinal pathologies remain uncommon. Accordingly, few modelling works have been published on the matter. However, understanding of the PK of intravenously injected drugs remains of interest since harmful effects on the retina have been reported [109].
In fact, significant ocular exposure, determined by a non-compartmental model (a type of model where the whole body is considered as a single homogeneous compartment), to intravenously injected antibodies has been reported [266]. The possibility of deducing vitreous concentrations after intravenous injection has been demonstrated by a compartmental model [284]. However, the transfer rate from systemic circulation to the eye compartment was taken from a previous model describing the rate of clearance from the eye compartment into the systemic circulation, which may differ from the clearance rate in the opposite direction. The same model applied to the analysis of experimental data on the permeability of the outer blood-retinal barrier found asymmetric exchange rates between the choroid and the vitreous [237]. Additionally, the analysis suggests that the RPE may not be the main route of clearance from the vitreous for drugs entering the retina via the systemic circulation [237].
In contrast, injections into the subretinal space have gained traction, especially for the delivery of cell or gene therapies. Subretinal injections provide direct access to the targeted cells, namely the photoreceptor and RPE cells. In both cases, the blood-retinal barrier plays an important role in the total exposure of the tissue to the therapeutics. Yet, the mechanisms of exchange between systemic circulation and the retina remain elusive and few in silico models of subretinal or systemic administration of ocular drugs have been developed. A computational fluid dynamics model for the transport of molecules across the RPE was developed and calibrated with an in vitro experimental setup [77]. Despite active transport not being considered in the model, this work provides a validated framework which can be built upon to incorporate such dynamics and to determine key RPE parameters.
Injection of anti-VEGF under the sclera (periocular), as a safer and less invasive alternative to the intravitreal route, is another promising technique. This method would also benefit from understanding of the ocular barriers. A one-dimensional, time-dependent, diffusion model was developed to simulate the transport of a protein across those layers in the mouse eye after periocular injection [112]. The diffusivity of each layer was estimated based on the fraction of extracellular space, while permeability of the barriers and clearance rates were fitted to experimental concentration data. Similar work modelling injections of anti-VEGF molecules into the space between the choroid and the sclera showed that the clearance rate from the episclera was negligible for large molecules [305]. However, it may still play a role for smaller molecules such as the fluorescent protein simulated in the previous model [112].
Of potential interest to the reader are two models of topical delivery and spray systems [197, 208]. Modelling work of these techniques remains scarce but the growing interest in cell and gene therapy may motivate modellers in the coming years.
6.4. Summary, future directions and prospects for ISCTs
While intravitreally injected drugs have been extensively modelled, other delivery techniques have received little attention. Furthermore, the exact availability of drugs in the retina remains elusive. This is due, in part, to a lack of understanding of retinal barriers. While some studies have attempted at resolving this issue with sensitivity analyses [59, 160] of the different parameters relating to retinal barriers, the results remain theoretical because of the lack of data to set their baseline values. Notably, three studies have used experimental data [30, 77, 112] to estimate RPE parameters. As a barrier, the RPE requires particular attention due to its polarity, which may allow mostly unidirectional transport [30].
Overall, in silico models of intervention for drug delivery to the retina are in place. A certain number of parameters pertaining to biological barriers and clearance rates need to be quantified. This may necessitate in vitro experiments, as direct, in vivo, measurements are nearly impossible in the retina, choroid or sclera.
7. ISCTs in the retina
The previous sections have detailed the vast literature that deals with modelling retinal haemodynamics, oxygenation, disease and the impact of drugs in both healthy and diseased retinas. However, there is currently very little research on formalising these models within the framework of ISCTs. ISCTs are simulations of clinical trials to test medical devices or drugs with the aim of eventually being used as digital evidence to reduce, refine and replace animal and human participants in preclinical and clinical experiments [288]. At each stage of clinical trials (preclinical, Phase I, II, III), ISCTs can be used: for early proofs-of-concept in the drug development phase; to simulate greater numbers of patients in each phase, hence representing greater biological variability in the trial; to augment trials such that fewer real-world patients are required; to run numerous trials that can optimise an intervention that would not be possible in reality; as well as to investigate rare events that might not occur in a real-world trial [214, 286, 287]. Another crucial aspect of an ISCT is the ability for a patient to act as their own control simulation-wise, introducing a new potentially more impactful/patient-specific way of running clinical trials.
The paradigm of an ISCT is very similar to that of a real-world clinical trial except the disease, intervention and trial setup are simulated. ISCTs require virtual populations of the disease of interest, a mechanistic model of the disease and treatment using the proposed intervention, and a statistical analysis plan that will analyse the output of the trial [7]. Figure 9 depicts a general schematic of how an ISCT might run for nAMD drug testing. This section will detail the building blocks of ISCTs as well as validation requirements and current positions of regulators such as the US Food and Drug Administration (FDA). It will end with a case-study of an ISCT applied to nAMD interventions.

Figure 9. Schematic of a generic ISCT with an example of nAMD drug testing. (1) In silico model development of disease with validation loop linked to patient data. (2) In silico model development of intervention with validation loop linked to in vitro and in vivo. (3) Virtual population generation using the disease model parameters. (4) ISCT run on intervention and control arms with appropriate outcomes and analysis.
Download figure:
Standard image High-resolution image7.1. Mechanistic models of disease and intervention
The central aspect of any ISCT is the mechanistic model that predicts the outcome of an intervention (or lack thereof). This is equivalent to the administration of the intervention in a real-world clinical trial. The mechanistic model is one that is based on the underlying physics and chemistry of the system being investigated. This model will usually simulate a disease, for example nAMD [136]. The intervention is then also simulated, in this case anti-VEGF therapies. Both the disease model and intervention model must be validated against in vitro or in vivo data in order to be used in an ISCT (figure 9).
Numerous disease/intervention models have been developed across different organs. Coronary stent models have been developed for occlusive heart diseases using finite element analysis to simulate the stent within a vessel environment [15, 36]. In vitro validation of the finite element model was used to confirm predicted behaviour. There is currently a large drive towards ISCTs of implantable medical devices due to the ability to validate predictions in vitro and the commercial benefit of speeding up stent trials where iterations in shape or geometry often require new clinical trials.
Example of other medical device ISCTs include coil placement in intracranial aneurysms [257] and ISCTs of thrombectomy/thrombolysis (the mechanical removal of the clot with a stent or the dissolution of the clot with drugs) in ischaemic stroke patients [159]. The intracranial aneurysm trial used a coupled model of thrombus formation with a fluid dynamics model to determine the efficacy of the coil in diverting flow and not generating thrombi. The flow and clot models were validated against in vitro phantoms and the results of the ISCT were compared to three real-world clinical trials. Crucially, this trial was able to make predictions on what different outcomes may occur if the population was primarily hypertensive or normotensive using individuals as their own control, leveraging a major strength of ISCTs. The ischaemic stroke clinical trials expanded to consider more than just the localised area of intervention, considering whole brain oxygen and perfusion models [147, 211]. Intervention models, such as thrombectomy, were developed and validated against in vitro models [178]. However, the more general dynamics of cell death and perfusion in the brain have proven harder to validate, in particular the primary outcome of lesion size [193]. Despite the difficulties involved in taking a more holistic overview of the entire brain, there are benefits in that new hypotheses can be tested which are unable to be done in vivo. For example, clot fragmentation post-thrombectomy was found to play a minor role in the potential lack of perfusion [86, 302] yet age had an impact on robustness to occlusion [118].
Drug-based ISCTs often revolve around testing differing dosing strategies either through having complex multi-arm ISCTs as is the case when studying optimal warfarin dosing [238], or through developing optimal control algorithms and testing those algorithms in an ISCT as with insulin control models [161]. Models have also been developed to look at treating rare bone conditions in children using agent-based models [56] and simulating the response of haemodialysis patients to treatment for anaemia with ODEs [110], as well as predicting the cardiotoxicity of drugs [224]. These models require an understanding of the kinetics of drug metabolism and interactions which can be determined in vitro and in animal models. For drugs that are well studied, like warfarin, there is plenty of data available to develop these models. For newer more complex drugs, developing these models may be more difficult without pharmaceutical collaboration. There are more ISCTs that are not covered here that have been developed for orthopaedic bone implants [92], interventions in respiratory tract infections [24], and delivering drugs in patients with COVID-induced pneumonia [293] amongst many more.
The methods used to simulate the disease and intervention range quite widely as demonstrated. Crucially, all models must undergo validation at this stage with experimental data—validation loops 1 and 2 in figure 9. The extent of validation is very much dependant on the context-of-use of the model with low consequence, low influence use-cases requiring far less stringent validation than high consequence, high influence applications (see section 7.4).
Within retinal model, it is this aspect of ISCTs (disease and/or intervention simulation) that is most developed and is detailed throughout this review. The next aspect of ISCTs is the generation of virtual populations.
7.2. Virtual Population
Virtual population generation is a nascent and rapidly developing field. To run clinical trials, sub-populations of the target population are required. A crucial first step is therefore to generate virtual populations (VPs) of the disease of interest that will eventually be used in the in silico clinical trials. For example, if an intervention for nAMD patients is to be tested in silico, a population of nAMD patients is required. VPs are effectively a group of digital twins, in silico individuals with unique parameters and demographics that define them. Virtual populations are therefore sets of patients with parameters that reproduce the statistics of interest of the clinical population of interest [9].
Broadly speaking there are two layers to virtual population generation—the patient demographics such as age, sex, comorbidities, and the patient parameters that define an individual for the purpose of the disease and/or intervention model. For example, with the ischaemic stroke trials, virtual populations from patient demographics were generated [193]. These were not explicitly used in the in silico simulation of stroke and intervention, where patient parameters such as vessel geometry or personalised clotting susceptibility could be altered. As such, there are two layers to VPs—the patient demographics, and the model parameters. Using either one or both depends on the purpose of the model.
One simple method of generating VPs—demographic and model parameters—is to assume a Gaussian distribution for each model parameter used to represent virtual populations. For each patient, a parameter value will be drawn from these Gaussian distributions to represent that patient [43, 144]. The mean and standard deviation of the parameters can be adjusted to match empirically observed data either manually or through optimisation [7]. Often, these patient parameters are not independent of each other—for example, sex and height are correlated. Therefore, more complex sampling strategies that maintain the relationships between patient parameters have been developed.
Bayesian statistics have been used extensively to generate patient parameter populations for the purpose of ISCTs. Haddad et al generated VPs using a Bayesian framework for augmenting clinical trials, demonstrating decreased sample size and trial length would be required for the real-world trial when using these VPs [125]. Models discussed in the previous section had various methods to generate virtual patient demographics. The ischaemic stroke trials used vine copulas to generate virtual stroke population demographics [193]. Vine copulas include constraints in high-dimensional dependence models, such that when sampling from the multivariate distribution the constraints between the variables are kept intact. For the warfarin trial, Bayesian Network Models were trained to learn and constraint the patient parameters with Monte Carlo simulation being used to sample to generate the VP [111]. Pezoulas et al also used tree-based methods (supervised and unsupervised) to generate VPs for cardiomyopathy drug development [227] but found that Gaussian Mixture Models with Variational Bayesian Inference outperformed supervised tree ensembles when comparing the VPs to the data [228].
As a virtual patient is effectively a set of parameters for the mechanistic model or for the patient demographics that represent a given individual, this can also be extended to 3-dimensional models of arteries or other physiological organs - where now the parameters might represent curvature of vessels, degree of stenosis or material properties of the artery. This introduces an added difficulty of modifying the computational mesh for each virtual patient. Because of this, most ISCTs involving patient meshes generate the mesh from patient-specific image data and simulate variability through variation in, for example, orthopaedic implant positioning [4], plaque growth over time on the arteries [230], and blood pressure and thrombus formation parameters applied on the mesh [257]. Note that the intracranial flow diverter trial used unmodified patient-specific images to generate the vessel meshes and as such cannot be considered a sampled virtual population.
However, statistical shape modelling is increasingly being used to generate VPs of the meshes themselves [250]. This method can morph geometrical objects within predefined constraints, allowing for a population of shapes to be determined from a baseline set of data. Statistical shape modelling has been applied to simulate virtual populations of atria in the human heart [203], as well as hips, mandibles, and aortic aneurysms [163, 223, 282].
VPs of retinal disease have yet to be extensively used in the literature due to the nascent fields of ISCTs and computational retinal modelling. The only attempt at generating VPs the authors found were that of Hoyle & Aslam [136] that generated 1000 patients with differing central retinal thicknesses for an nAMD trial. With appropriate data, however, VPs can be generated using the techniques documented. As can be seen later in our case study (section 7.6), the technology and capability of the models is present.
7.3. Running the ISCT at different trial phases
Once the mechanistic model and VPs have been developed, the ISCT protocol should be pre-defined - with a statistical plan, pre-defined primary and secondary outcomes, and trial inclusion and exclusion criteria. Current medical studies publish their protocols, with randomised clinical trials following the CONSORT guidelines [262]. Once the study protocol is in place, the ISCT can be run and analysed with the pre-defined methodology.
While technically running an ISCT can be done at any point, in practice this very much depends on where most benefit can appear in the pipeline. There are multiple phases in a clinical trial prior to regulatory approval - pre-clinical to phase 3 (with phase 4 trials looking at post-approval long term benefits and side effects).
Preclinical targets identified in testing are often invalidated at phase 2 or 3 clinical trials, at which point a huge among of time and effort has already been expended. ISCTs can be used to elucidate the mechanism of action and run more complex testing before the latter stage trials to improve the chances of success [214]. Preclinical trials will regularly require animal testing of the drug or device in question. It is at this stage where most ISCTs have been developed to date. An example of an FDA approved preclinical trial is that of closed-loop control of type 1 diabetes [161]. Whereas previously, new insulin control algorithms would have to be validated on dog models, the FDA approved this in silico preclinical trial after extensive validation [214]. Other ISCTs, whilst not yet approved, have shown promise in preclinical testing. Notably, Passini et al demonstrated improved accuracy over animal models when predicting clinical pro-arrhythmic cardiotoxicity for multiple drugs [224]. ISCTs have also been used to test different adjuvants for vaccines [213], as well as replacing, reducing, and refining mouse models of osteoporosis [176]. It is this stage of trial that can be simplest to validate or invalidate due to the availability of in vitro and in vivo animal testing.
Phase 1 trials assess safety and dosing effectiveness and often recruit fewer than 100 people. These trials can be augmented with an ISCT that can simulate numerous dosing procedures to optimise the best one as well as increase numbers and bolster the power of such a trial. Biological variability can be added into these small trials by simulating different demographics and edge cases that may not generally appear in such small trials. No ISCTs appear to have specifically simulated phase 1 trials although the principles of application will be the same for phase 2 and 3 trials.
Phase 2 trials involve a slightly larger group (100–300) where effectiveness, safety, and side effects of the drug or device are considered. Like in phase 1, we can use ISCTs to reduce the number of patients recruited into a trial, the duration of a trial, and the number of trials required. This is especially beneficial in rare disease trials where sufficient power to demonstrate effect will be lacking due to the low recruitment rates. An example of a phase 2 ISCT that obtained regulatory approval is that of an MRI safe pacemaker [91]. There is a risk that the leads in the pacemaker could act as antenna causing overheating and cardiac ablation whilst within the MRI scanner. However, this would have been a rare event requiring a very large clinical trial to prove safety. Instead, ISCTs were approved by the FDA to demonstrate that the pacemaker was safe to use within an MRI in conjunction with a smaller confirmatory trial. Another model that has simulated phase 2 ISCTs is that of Kiagias et al [155] which looked at testing novel therapeutic vaccine approaches for TB using in silico models as a prior to an in vivo trial. This type of augmented trial shows promise for reducing patient recruitment and increasing the power of clinical trials [125].
Phase 3 trials are the large multi-centre randomised control trials which are the final step before market approval. These trials can be very expensive to run and time-consuming. ISCTs can be used here to augment these trials. Whilst there are no regulatory approved ISCTs at this phase, the examples given earlier can be extrapolated straightforwardly to this phase. Examples of ISCTs that have attempted to model phase 3 trials include an ISCT comparing two drugs for attention-deficit/hyperactivity-disorder [123] and a multi-arm trial of warfarin dosage [238]. Others have attempted to augment phase 3 trials only through the control arm, avoiding the complexity of simulating disease and intervention yet still improving the power of trials [101, 292].
Unlike real-world trials, the benefit of running an ISCT is the ability to run any permutation of trial you like, without consideration for cost or ethics. This allows for deeper investigation of the intervention in various subpopulations, helping to optimise the application of the intervention. While an ISCT will not be able to fully replace a clinical trial, it can augment the clinical trial, increasing the power and speeding up time-to-market. There is a particular benefit concerning rare events, be they rare diseases or rare side-effects. Further reading for the contexts-of-use of ISCTs can be found in the review by Viceconti et al [288].
7.4. Validation of an ISCT
Validation, verification and uncertainty quantification (VVUQ) are necessary to give confidence in the models and ISCTs. Validation of the model depends on the context-of-use of the model and what risk is involved with its use, with higher risk models requiring higher validity [214]. Validity of the VPs should also be considered (external validity)—the VPs should be representative of the wider population of interest for that disease i.e. not constrained by overly stringent exclusion criteria. Similarly, the ISCT should have ecological validity, where the results translate to real-life settings in which the trial results will be applied. Recent research has looked at simulating hospital environments stochastically to determine ecological validity of an ISCT [110].
Verification of a model verifies that the numerical (computational) and mathematical implementation is correct and sufficiently accurate for the intended use. This is often done numerically by using the computational code to solve a problem where the solution is known i.e. an analytical solution exists, or through comparison with other known model solutions. Verification of the mathematical model can also be done through systematic model reduction and parameter asymptotics. Verification methods are usually well established for given models and their numerical implementation [74, 214]. Uncertainty quantification is also an essential step. This includes both aleatoric uncertainty (uncertainty in the data used to inform a model) and epistemic uncertainty (uncertainty in the knowledge of the physiological system used to build the model), as well as numerical uncertainty when solving approximated mathematical equations computationally. All of these uncertainties must be quantified to ensure that a good comparison with real-world data can be made.
There are two main aspects of validation for an ISCT: validation of the disease and intervention model (loops 1 and 2 in Fig 9) and validation of the outcomes of the ISCT itself. The validity of the mechanistic model and ISCT is an important factor in translating the ISCT paradigm to use in development. Guidelines have been published by the American Society of Mechanical Engineers, 'Verification & Validation 40 Assessing Credibility of Computational Modelling through Verification and Validation: Application to Medical Devices'. These guidelines use a risk-informed credibility assessment, where the influence and consequence of the model determine the extent of VVUQ required [26] (figure 10).

Figure 10. Process Diagram of the Risk-Informed Credibility Assessment Framework. Republished with permission of ASME, from [26]; ASME V&V 40-2018, by permission of The American Society of Mechanical Engineers. All rights reserved.
Download figure:
Standard image High-resolution imagePrevious reviews have detailed the process of VVUQ in the credibility assessment of closed-loop control devices for critical medicine [222]. Frameworks have also been published on how VVUQ should be implemented in ISCTs [40, 125]. In brief, a question of interest must be defined. What question will the computation model seek to answer? This must be followed by defining the context-of-use—how will the model be used? To what purpose? A risk analysis is then conducted to ascertain the consequences of the model decision along with its influence, with model risk being defined as low, medium or high (figure 11). Higher risk models will require more stringent VVUQ. Once risk is determined, credibility goals must be established. The credibility of the model must be proportionate to the model risk. A plan is then drawn up to achieve these credibility goals which includes verification of the numerical code and mathematics, validation of the computational results, uncertainty quantification, and applicability of the model within its context-of-use (it may have more than one). A review on the application of VVUQ using the Verification and Validation 40 standards can be found in Viceconti et al [289].

Figure 11. Risk matrix demonstrating the impact of influence and consequence of the model on risk.
Download figure:
Standard image High-resolution image
7.5. Regulation of ISCTs
ISCTs are a relatively recent concept and as a result there is little official guidance for establishing and running an ISCT for regulatory approval. It is useful here to make a distinction between drug and medical device ISCTs briefly. Whereas drug simulations have been frequently used by pharmaceuticals in the past with FDA and European Medicines Agency guidance existing for these submissions, these guidelines are not fully applicable to the emerging mechanistic in silico models and the ISCT paradigm [87, 280]. A recent white paper was published identifying the gaps in guidance and regulation for in silico drug development [202] with recommendations for standardisation based around the ASME Verification and Validation 40 guidelines [26].
Regulation for medical devices is sparser although draft guidance has recently been published by the FDA on assessing the credibility of the models in medical device submissions [278]. ISO standard ISO/DTS 9491-1 is also currently under development to provide requirements for predictive computational models in personalised medicine research. Despite the paucity of guidance for ISCT model development, regulatory bodies have been receptive to the idea of replacing clinical trials in part with simulation. In particular, the FDA has been amenable to assessing computational model use to augment or replace arms of clinical trials. A mock submission was made to the FDA assessing the use of augmenting clinical trials with simulations of virtual patients in assessing fatigue fracture of cardiac leads [124, 125]. Two main themes were highlighted from this mock submission to the FDA: early 2-way communication is required between the team submitting and the FDA to highlight any concerns early on and; model credibility (as discussed in section 7.4) should be integral to the development work. Examples where approval for devices based on simulations has been granted include approval of the safety of a pacemaker [91] and in insulin control-loop algorithms replacing preclinical animal trials [161].
Recent papers have introduced potential regulatory pathways for the acceptance of computational modelling and simulation for medical devices both in Europe [215] and the USA [198]. Whilst unified regulation does not exist yet for the acceptance of computational modelling and simulation in clinical trials, it appears that regulatory bodies are beginning to accept and draft regulation for this ISCT paradigm. For example, the FDA has the Medical Device Development Tool that can be used for the evaluation of novel technologies for regulatory submission [279]. It looks increasingly likely that such regulation will be developed around the context-of-use of the model and the ASME Validation and Verification 40 guidelines, providing an early indication as to how to setup future ISCTs.
7.6. Case study: Retinal ISCTs in nAMD
The closest form of ISCTs applied to the retina we found in the literature is in the work by Hoyle and Aslam [136]. They attempted at bringing together simple models of disease and intervention with treatment outcome in nAMD. In this section, we will discuss this model and the components that may be missing to run ISCTs of nAMD as demonstrated in figure 9.
7.6.1. Disease model
Clinically, eyes with nAMD are diagnosed using structural imaging (OCT) and angiograms (e.g. OCTA, FA) of the retina. Though the biomarkers differ between imaging modalities, the presence of MNV and the presence of oedema are characteristic of nAMD and are both associated with deterioration of visual acuity [261]. In their work, Hoyle and Aslam modelled both MNV and oedema sizes as biomarkers of disease progression. However, because segmentation, and therefore quantification, of MNV is challenging, oedema size is the main outcome measure for the model. The main outcome of classical clinical trials is visual acuity gains and oedema size alone is not sufficient to predict visual functions [261]. Developing a mechanistic model linking biomarkers reported by clinical trials with visual functions is challenging due to the numerous factors affecting vision in nAMD. However, statistical models such as the one proposed by Mulyukov et al [200] can be built on top of a mechanistic model of biomarker progression to bridge this gap. The second issue with the current model is the simplistic representation of the disease. Indeed, in the model, MNV appears and progress when an arbitrary fraction of receptors is bound with VEGF. Another arbitrary threshold is the likelihood of MNV penetrating the RPE/BrM barrier. The molecular targets of antiangiogenic therapy are evolving (e.g. ang2). Therefore, replacing the current phenomenological model with a mechanistic or agent-based model of angiogenesis is likely to be required for ISCTs.
7.6.2. Intervention model
As highlighted in sections 4.2 and 6, in silico modelling of anti-VEGF is well established. Modellers have repurposed the scarce clinical data to broaden the understanding of PK and PD of ocular drugs and lay the groundwork for a robust drug-based intervention model in nAMD. However, in light of recent progresses in the understanding of retinal physiology which may contradict certain model assumptions [186], additional validation is required to ensure that simulations generalize to novel drugs.
7.6.3. Virtual populations
As of now, most model parameters, to the exception of anti-VEGF injection times and doses and mean retinal thickness at baseline, are fixed. The parameters of the treatment and baseline thickness of the macula are matched to the values in the clinical study. Therefore, no VPs were generated at this stage for the model. A number of parameters could be tweaked to generate inter-individual variations in simulations. However, ranges for most of those parameters (e.g. VEGF production rates, RPE/BrM fragility) are difficult to determine experimentally. Furthermore, these parameters are likely to be insufficient. Eyes with nAMD are still not well characterised and therefore are hard to parametrise. In addition, for reasons unknown, a noticeable fraction of eyes is unresponsive to treatment. Parametrising nAMD populations would require consequent effort from clinicians and modellers. The VPs can be validated statistically against outcomes of previous clinical trials in terms of visual outcome, fluid volumes and oedema and GA sizes. These metrics may also be computed retrospectively from the large amount of clinical and imaging data available in ophthalmological clinics.
7.6.4. Running ISCTs
In its current state, the model only requires to define representative VPs to run an ISCT. It could then be used to test different treatment strategies (injection dose and interval) and different anti-VEGF drugs. With rigorous sensitivity analysis, parameter distributions could be estimated against the many clinical trials of intravitreally injected anti-VEGF. Calibrating the parameters for the sham arm (or control group) might present a challenge owed to the absence of such sub-group in clinical studies. A more mechanistic modelling of the disease is required for testing other drugs which may target different pathways of angiogenesis [5]. Crucially, this study compares the outcome of the model to a landmark clinical trial—the outcome of the model was comparable to the outcome measured clinically. This is an important factor when designing ISCTs as often mathematical outcomes do not correlate with what is measured in trials or in clinic. Therefore, careful planning to ensure trial outcome is comparable is required. It is increasingly likely that confirmatory clinical trials will be required to accept outcomes of ISCTs, as was the case for the MRI-safe pacemaker [91], and as such the outcomes of both the model and clinical trial must be comparable.
7.6.5. Summary
This brief case study has demonstrated that, whilst there are no complete ISCTs in the retina, there is an ecosystem that is well-positioned to exploit the development of ISCTs. By introducing more rigorous context-of-use planning for the models, refined validation, and developing the model with the outcomes of a confirmatory clinical trial in mind, the field of retinal ISCTs will grow rapidly.
8. Discussion
Throughout this paper, we have reviewed state-of-the-art models of the retina in both healthy and diseased conditions. In silico models have shed light on the interplay between biological mechanisms, such as autoregulation, necessary to maintain a healthy retina. In addition, they have provided us with quantitative understanding of the range of insults that the retina can withstand.
Furthermore, models have brought insights on the underlying mechanics of common retinal diseases, some of which may have been overlooked by traditional in vivo and in vitro investigation because of the difficulty of direct measurements.
Additionally, we have introduced the concept of ISCTs and the main components they require. Most of the building blocks for running an ISCT in the retina are already in place. When it comes to nAMD, there are already mechanistic models in place for the disease and intervention [136, 283]. However, two main gaps still exist that are required to run successful ISCTs in retinal disease:
- 1.Patient data linkage for comprehensive VP generation. For representative and valid VPs, imaging data needs to be linked to primary and secondary health records to give comprehensive disease populations [85].
- 2.Most clinical trials for retinal disease use visual acuity as a primary outcome, yet there is no in silico model that reliably links visual acuity to the disease. This is the main stumbling block that needs to be addressed if ISCTs are going to be used extensively in retinal disease.
Whilst the future is incredibly promising for ISCTs, it is unlikely they will ever replace clinical trials. However, they can help refine and accelerate trials by eliminating pre-clinical testing, targeting an intervention to specific sub-populations or improving an intervention through repeated in silico trial testing.
Acknowledgment
R H is funded by an EPSRC Doctoral Training Network in A I and Future Digital Health studentship. P A R acknowledges financial support from the University of Birmingham Dynamic Investment Fund.
Data availability statement
No new data were created or analysed in this study.