

Abstract
The influence of the loading/unloading rate on the indentation strain rate, hardness and elastic modulus in Cu-2wt%Be samples subjected to different aging treatments was analyzed. Homogenized samples were aged for 1 and 10 h at 400 °C to induce the formation of γ' and γ precipitates, and instrumented indentation tests were performed at different loading rates between 0.15 and 1 mN s−1. The indentation curves of all the samples were influenced by the loading/unloading rate, but the behavior of the samples with precipitates was different from that of the homogenized samples. Strain rate levels during loading were also influenced by the loading rate. The strain rate increased almost linearly with the loading rate in the homogenized sample and the sample with γ' nanoprecipitates, while it experienced a decelerated increase with the loading rate in the sample with γ phase. The hardness and reduced modulus were estimated from the indentation curves using the Oliver and Pharr method. Hardness remained almost constant at approximately 2.4 GPa as the rate was varied in the homogenized sample. On the other hand, the samples with γ' and γ phase exhibited higher hardness values at 0.15 mN s−1, while it remained approximately constant for the other rates. The reduced modulus increased with the loading/unloading rate and this increase was more pronounced for the sample with γ precipitates, with a higher sensitivity of the reduced modulus increase.
Export citation and abstract BibTeX RIS
1. Introduction
Copper-beryllium alloy (Cu-Be) with contents around 1.8 to 2.0% by weight of Be is an age-hardenable alloy widely used in high precision electronic components, sensors, non-sparking tools, springs with complex shapes, among others, due to its high strength and hardness, good electrical and heat conductivity, no magnetism and corrosion resistance [1–3]. Its excellent mechanical properties are due to the formation of metastable nanoprecipitates by aging treatments from the Cu solid solution [4]. The sequence of precipitation comprises the formation of metastable phases prior to the equilibrium γ phase [1, 3–5]: Guinier-Preston (GP) zones, γ'' phase and γ' phase. GP zones are areas of enrichment of solute atoms and γ'' metastable precipitates are formed from the piling up of GP zones [3, 4]. For longer aging times, γ' metastable nanoprecipitates are formed with a plate-like shape and semi-coherent with the matrix [1, 6].
The effect of cold rolling on the age-hardening behavior has been reported, and it was found that the formation of γ'' and γ' phases was accelerated by the effect of cold rolling [7]. Cold rolling also produces an increase in hardness at an early aging time. The evolution of the recrystallization microstructure in cold-rolled Cu-Be sheets during subsequent annealing has also been studied using an integrated finite element-microstructure-based model [8].
The mechanical properties, hardness, elastic modulus, strengthening and fracture toughness of Cu-Be alloys depend to a large extent on the microstructure of the material, which can be modified and improved by aging treatments that induce the formation of different precipitates [1, 9–13]. Metastable γ'' and γ' phases play a key role in alloy strengthening [1]. The maximum value of strength, hardness and elastic modulus has been obtained for a microstructure containing mainly γ'' and γ' phases [1, 11, 14, 15].
The instrumented indentation method allows the non-destructive characterization of the mechanical behavior of a material, being able to determine the elastic modulus and hardness using the Oliver and Pharr method [16, 17]. Both parameters can be obtained directly from the load-depth (P-h) curves, assuming that the deformation during loading is elastic and plastic, while unloading is only elastic.
The elastic modulus and hardness of Cu-2Be samples with different microstructures have been characterized by instrumented indentation measurements in previous studies [15, 18, 19]. Samples aged for 1 h at different temperatures between 267 °C and 407 °C were studied. It was found that the samples with γ' precipitates exhibit a significant level of pile-up after the indentations and the correction proposed by Loubet et al in the contact depth was performed for hardness estimation [15, 18–20]. It is known that hardness estimated by instrumented indentation measurements shows a strong dependence on the applied load, which is known as the Indentation Size Effect (ISE) [21–24]. A decrease in hardness for higher applied loads (normal ISE) has been reported in polycrystalline Cu [21], Cu-2Be [19], CuAlBe [19] and Cu-Zn alloys [25]. The influence of the load on the elastic modulus determined by the Oliver and Pharr method was also studied, and a decrease in the modulus with increasing maximum load was found [15]. However, this variation of the modulus is reduced by using the indentation work method [15]. On the other hand, the mechanical behavior and deformation of a material at nano-scale is a highly dynamic phenomenon, where the observed mechanical properties would be affected by the loading rate. Therefore, in order to properly characterize the mechanical properties of a material, such as elastic modulus and hardness, by means of instrumented nanoindentation measurements, it is necessary to know the dependence of these measured properties on the loading/unloading rate used.
The influence of the indentation loading rate on the hardness in copper samples has been analyzed in previous works [26, 27]. Chen et al [26] studied the loading rate effects on the indentation curves and the contact strain rate in polycrystalline copper samples. They found marked differences in the development of pile-up around the indentation sites, which are strongly rate-dependent. Mirahmadi et al [28] analyzed the hot deformation behavior of Cu-2Be alloy, within the temperature range of 650 °C–950 °C, and found that the flow stress under isothermal compression tests decreases as the deformation temperature increases or the strain rate decreases. However, to the best of our knowledge, no studies on the dependence of instrumented indentation measurements on the loading rate in Cu-2Be samples with different microstructures have been reported to date.
In this work, the influence of the loading/unloading rate on the indentation strain rate, hardness and elastic modulus in Cu-2Be samples with different microstructures has been analyzed. Cu-2Be samples were subjected to aging treatments to induced the formation of precipitates, and samples with different microstructures were measured by instrumented indentation tests at different loading rates.
2. Materials and methods
For this work, the polycrystalline Cu-2Be alloy with UNS number of C17200 (composition in table 1) provided by Roberto Cordes S.A. as bars of 10 mm diameter was used. Slices approximately 2 mm thick were cut using a diamond disc and an Isomet Low Speed Saw. Samples were homogenized at 800 °C for 10 min and quenched into water at room temperature (M1). The grain size of the homogenized samples was estimated by the linear intercept method from images obtained by optical microscopy. Micrographs were obtained using a Leica DMI3000M microscope on samples previously electropolished (at 4 V in a satured solution of CrO3 in H3PO4) and etched in a FeCl3 solution for 10 s to reveal the grains. To induce the formation of different metastable precipitates, some homogenized samples were subjected to different aging treatments: 1 h at 400 °C (M2) and 10 h at 400 °C (M3).
Table 1. Composition of Cu-2Be alloy (wt%).
| Element | Cu | Be | Co | Si |
|---|---|---|---|---|
| Content | Bal. | 1.98–2.15 | 0.35–0.65 | 0.2–0.35 |
The variation of the microhardness of the Cu-2Be alloy homogenized and aged at 400 °C for different times was obtained by Vickers microhardness measurements. Ten indentations were made on each sample using a Mitutoyo MVK-H11 tester under a load of 300 g and with a holding time of 10 s.
Nanoindentation measurements were carried out on samples previously polished using 600 and 1200 grit emery papers, a diamond paste (3 μm size) and alumina powder (1 μm size). After being polished, the surface impurities of the samples were removed by means of a washing and sonication process for 10 min. Nanoindentation tests were performed using a Hysitron triboindenter with a Berkovich diamond indenter. The nanoindentations were made according to the ISO 14577-1 test method and under load control at different loading/unloading rates (0.15, 0.30, 0.60 and 1 mN s−1), with a maximum load of 9 mN and without holding time. This load complies with the criterion that the maximum depth is greater than 10 times the value of the roughness measured in each sample. Ten indentations were made at each rate in different positions chosen at random from each sample. The surface morphology of the samples after indentations was recorded by atomic force microscopy (AFM) using the Hysitron triboindenter. Depth profiles were analyzed using the Gwyddion 2.62 software.
P-h curves were analyzed using the Oliver and Pharr method, from which the reduced modulus (Er ) and hardness (H) were determined [16, 17]:


where S is the elastic unloading stiffness, β is a correction factor (slightly greater than unity) and Pmax is the maximum load. Ac is the projected contact area and depends on the contact depth (h.c. ) following an experimentally obtained tip calibration function. h.c. can be estimate for a Berkovich indenter as follows [16, 17]:

where hmax is the maximum depth.
Small-angle X-ray scattering (SAXS) experiments were performed using a XEUSS 1.0 model equipment (XENOCS, France), with a Pilatus 100 K detector (DECTRIS, Switzerland) and a Cu Κα1,2 (λ = 1.5419 Å) X-ray source, at the Institute of Theoretical and Applied Physicochemical Research (INIFTA-CONICET-UNLP). SAXS experiments were performed at room temperature, in transmission configuration, supported on a solids sample holder, at a fixed sample-to-detector distance of 1354.37 mm. Each sample was measured in triplicate for 900 s and the values obtained were averaged. The intensity I(q), being q the scattering vector, was corrected by subtracting the Laue intensity from the Laue background. The Laue intensity was obtained from the slope on an I·q4 versus q4 plot, at highest q values [29, 30].
3. Results and discussion
3.1. Samples characterization
The Cu-2Be (wt%) samples homogenized for 10 min at 800 °C consist of an α phase matrix with some annealing twins and exhibit a grain size of around 40 μm (figure 1(a)). After an aging treatment at 400 °C, Vickers microhardness increases from around 100 HV to a maximum of 364 HV after 1 h of aging (figure 1(b)). For longer aging times, Vickers microhardness decreases slightly and reaches a value of 314 HV after 10 h of aging.

Figure 1. (a) Representative micrograph of the homogenized sample. (b) Variation of Vickers microhardness with the aging time at 400 °C.
Download figure:
Standard image High-resolution imageIn a previous study of the same alloy [11], and based on calorimetric studies, the homogenized sample was found to consist of an α solid solution phase. This was concluded since after heating the homogenized sample from room temperature to around 550 °C, the presence of exothermic reactions associated with the formation of GP zones, γ'', γ' and γ phase was observed [11]. Therefore, the homogenized samples (M1) correspond to an α phase matrix.
After 1 h of aging, the maximum Vickers microhardness was reached (figure 1(b)). The formation of γ' precipitates has been reported to produce the most effective hardening and strengthening among metastable precipitates in Cu-Be alloys [4, 9, 31]. On the other hand, the calorimetric results of a previous work on a similar alloy indicated the presence of γ' phase for the maximum value of Vickers microhardness and elastic modulus for an aging time in the range of 0.75 to 1 h at 400 °C [11]. Therefore, the sample aged for 1 h at 400 °C (M2) would correspond to an α matrix with γ' metastable nanoprecipitates.
To estimate the size of the precipitates formed after aging for 0.75 h at 400 °C, SAXS measurements were performed. Likewise, measurements were made on a homogenized sample to corroborate the absence of nanoprecipitates. In figure 2, the Kratky plots (Ic ·q2 versus q, where Ic is the corrected intensity) are shown for M1 and M2. In M2, a peak is observed at values of q close to 0.018 Å−1, which would be associated with the scattering due to the presence of γ' nanoprecipitates. The Guinier radius (Rg ) can be estimated from q, where the maximum value of Ic ·q2 (qmax) is reached [29, 30]:

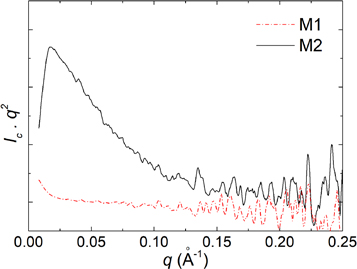
Figure 2. Kratky plots (Ic ·q2 versus q) for samples M1 and M2.
Download figure:
Standard image High-resolution imageThe value obtained for Rg was 98 Å in the sample M2. Rg is of the order of the radius of the precipitate (R): for monodisperse spherical precipitates Rg = (3/5)1/2 R [29]. In the case of ellipsoids with aspect ratios between 0.5 and 2, Rg obtained from equation (4) provides a good estimation of the precipitate size. For larger aspect ratios, Rg should be used to describe, with caution, the average precipitate size [29]. The area under the curve in the Kratky plot is related to the volume fraction of the precipitates. Therefore, the nanoprecipitates present in sample M2 would have sizes of the order of 10 nm. In contrast, the presence of precipitates was not observed in M1 (figure 2).
Longer aging times induce a softening of the material (figure 1(b)) due to an increase in the misfit angle between the γ' metastable nanoprecipitates and the matrix, and the increase in the length and width of the nanoprecipitates [6, 9]. As the aging time increases, the γ' nanoprecipitates transform into γ phase [4, 9]. Therefore, the sample aged for 10 h at 400 °C (M3) would correspond to an α matrix with precipitates close to the γ phase.
3.2. Nanoindentation measurements
Figure 3 shows representative P-h indentation curves at different loading/unloading rates of samples with different microstructures. The indentation curves of the sample in α phase (M1) were influenced by the loading/unloading rate (figure 3(a)). hmax for a load of 9 mN decreases slightly from 431 nm to 421 nm as the rate increases from 0.15 to 1 mN s−1 (figure 4(a)). However, the final depth (depth at the end of the unloading, hf ) remains almost constant with the rate, with a mean value of 369 nm and a standard deviation of 5 nm (figure 4(b)). The decrease of hmax with the rate is similar to the behavior reported for a polycrystalline copper sample subjected to different loading rates between 0.05 and 50 mN s−1 at a maximum depth of 10 mN [26] and to that found in a copper (110) single crystal subjected to loading rates between 2 and 25 mN s−1 at a maximum depth of 100 mN [27]. The indentation curves of the samples aged at 400 °C show a different behavior. In the samples with precipitates (M2 and M3), hmax increases very slightly with the rate (figurex 3(b) and 4(a)), while an increase in hf is observed between the lowest rate (0.15 mN s−1) and the highest rates (figures 3(b) and 4(b)).

Figure 3. Representative P-h curves at different loading/unloading rates for samples M1 (a) and M2 (b).
Download figure:
Standard image High-resolution image
Figure 4. Variation of hmax (a) and hf (b) with the loading/unloading rate in samples with different microstructures.
Download figure:
Standard image High-resolution imageAFM images are shown in figure 5 for samples M1 and M2 after the indentations at different loading/unloading rates. The sample without precipitates (M1) does not exhibit the presence of pile-up (figures 5(a) and 5(b)), while the samples with precipitates (M2 and M3) exhibit the presence of pile-up (figures 5(c) and 5(d)), which agrees with the results reported in [18] on samples with similar heat treatments. Differences in the size of the indentations after unloading can also be observed between the samples with and without precipitates, which may be related to the differences in hardness (figure 1(b)) and the final depth obtained (figures 3 and 4(b)). However, no differences were observed with the loading/unloading rate.

Figure 5. Representative AFM topographic images of the surface of sample M1 after indentations at loading/unloading rates of 0.15 mN s−1 (a) and 1 mN s−1 (b), and of sample M2 after indentations at 0.15 mN s−1 (c) and 1 mN s−1 (d).
Download figure:
Standard image High-resolution imageFor a Berkovich indenter, the indentation strain rate (SR) during loading can be obtained using the following equation [26, 32]:

where  is dh/dt, h is the depth and t is the time. The variation of SR with h for samples with different microstructures is shown in figure 6. At the initial contact, SR exhibits a high value and decreases rapidly at greater depths. The levels of SR are influenced by the loading rate. For sample M1 and at a rate of 1 mN s−1, SR reaches a value greater than 50 s−1 at a depth of 2 nm, decreasing to ∼11 s−1 at 10 nm and then to ∼5 s−1 at 20 nm (figure 6(a)). On the other hand, at a rate of 0.15 mN s−1, SR exhibits a value of only ∼10 s−1 at the depth of 2 nm, 1.5 s−1 at 10 nm and 0.8 s−1 at 20 nm. A similar behavior has been reported by Chen et al [26] in a polycrystalline copper sample. For the samples with precipitates, there is also an increase in SR with the loading rate for a given depth (figure 6(b)). Figure 7 shows the values of SR obtained for different loading rates from representative curves in figure 6 at depths of 2 nm (figure 7(a)) and 10 nm (figure 7(b)). SR shows an almost linear increase as a function of the loading rate for samples M1 and M2. On the other hand, SR experienced a decelerated increase with the loading rate in sample M3.
It has been reported that in polycrystalline copper samples, the most probable deformation mechanism is slip of independent slip systems at strain rates lower than 1 s−1 [26, 33]. In our case, these rates were reached for the lowest loading rate (0.15 mN s−1) and depths greater than 10 nm (figure 6(a)). For higher rates, higher strain rates are achieved, and cross slip and dislocation nucleation can occur [26, 33]. In the homogenized Cu-2Be samples studied in the present work, the interactions of the dislocations with the grain boundaries can be neglected since the grain size of the samples is around 40 μm, significantly greater than the size of the indentations, which are in the range of 1 to 2 μm (figure 5).

Figure 6. Representative curves of SR versus h at different loading rates in samples with different microstructures: M1 (a) and M3 (b).
Download figure:
Standard image High-resolution image
Figure 7. Variation of SR with the loading rate for depths of 2 nm (a) and 10 nm (b) of representative samples with different microstructures.
Download figure:
Standard image High-resolution imageEr and H were obtained from the P-h curves following the Oliver and Pharr methodology [16, 17]. As was observed in figure 5, and from the images obtained by AFM of the surfaces of the samples after the indentations, the samples with precipitates exhibit pile-up (M2 and M3), while the homogenized samples do not (M1). Therefore, the correction proposed by Loubet et al for h.c. was applied to the samples that exhibit pile-up, M2 and M3, for the calculation of H [18, 20]:

The variation of H with the loading/unloading rate is shown in figure 8. It can be observed that for the sample M1, H remains almost constant with the rate at a value around 2.4 GPa. Choi et al [27] found a similar behavior of H with the loading rate in a conventional copper single crystal over a wider range of loading rates from 2 to 25 mN s−1. Chen et al [26] reported a slight increase in H with the loading rate for a polycrystalline copper sample in the range of 0.05 to 50 mN s−1. For higher loading rates, higher strain rates are reached (figures 6 and 7), resulting in a higher strain gradient, and a high density of geometrically necessary dislocations near the surface would be expected according to the results of Chen et al [26]. However, according to our results, the influence of the loading rate on hardness would not be important in the range of rates studied in the present work, between 0.15 and 1 mN s−1.
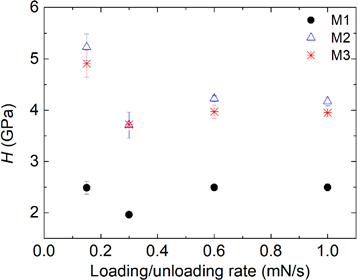
Figure 8. Variation of H with the loading/unloading rate in samples with different microstructures.
Download figure:
Standard image High-resolution imageOn the other hand, the samples with γ' and γ phase exhibit higher H values at 0.15 mN s−1, while H remains approximately constant for the other rates, with values of 4.3 GPa (M2) and 4.1 GPa (M3) (figure 8). As found with Vickers microhardness measurements (figure 1(b)), M1 is much softer, while the presence of γ' nanoprecipitates (sample M2) increases the hardness of the material, reaching the maximum value. The sample aged for a longer time (sample M3) has a slightly lower hardness compared to M2.
Huang et al [14] studied the contributions of different types of pinning effect on dislocations due to precipitation in a Cu-2Be alloy aged at 320 °C. They found that the strengthening effect consists of the dislocation by-shearing and by-passing mechanisms. During the initial stage of precipitation, the dislocation by-shearing would be the main strengthening mechanism, while the dislocation by-passing (Orowan mechanism) would gain importance for longer aging times (longer than 4 h at 320 °C, where γ' nanoprecipitates exhibit a size around 30 nm) as the fraction and dimension of the precipitates grow continuously [14]. Other authors have proposed that the by-passing mechanism would be the main strengthening mechanism in Cu-2Be alloys with γ' nanoprecipitates, and this mechanism does not change for longer aging times in which γ' transforms into γ phase [1, 9]. In this study, γ' nanoprecipitates with a size around 10 nm were found in sample M2. Based on the literature, the predominant strengthening mechanism in this type of sample would be expected to be the dislocation by-passing mechanism.
On the other hand, it is known that the dislocation movement is a kinetic process, and the stress necessary for deformation depends on the strain rate [26]. As observed in figure 8, a higher value of H is obtained for the samples with precipitates for the lowest loading/unloading rate, which would suggest that the plastic deformation process in the samples with precipitates would be hindered at the lowest rate.
The variation of Er with the loading/unloading rate is shown in figure 9(a). Er increases with the loading/unloading rate and this increase is more pronounced for the sample with γ precipitates (M3). Previous works have reported higher values of the elastic modulus for Cu-2Be samples with precipitates [10, 11, 34]. This effect can be clearly observed for the sample tested at 0.3 mN s−1.

Figure 9. (a) Variation of Er with the loading/unloading rate in samples with different microstructures. (b) Plot of ln of Er versus ln loading/unloading rate.
Download figure:
Standard image High-resolution image
According to equation (2), Er calculated from the Oliver and Pharr methodology depends on S and Ac . It was found that S increases with the loading rate, while Ac remains approximately constant, with a value around 3.5·106 nm2 for the sample M1, and around 1.7·106 nm2 for the samples M2 and M3. Therefore, the increase in Er calculated from the Oliver and Pharr methodology with the loading rate is due to the increase in S with the loading rate.
In previous studies, Cu-2Be samples with γ' precipitates have been reported to have low free energy, which includes elastic strain energy, interfacial energy between matrix and precipitates, and stored energy due to dislocations, which produces a higher elastic modulus [10, 34]. The transition from γ' precipitates to γ phase would be associated with an elastic strain accommodation [34]. In sample M3 with γ precipitates, the misfit angle between the precipitates and the matrix is greater and the precipitates would be longer and wider than γ' precipitates [6, 9]. The different behavior of sample M3 with respect to M2 would be associated with the differences between γ' and γ phases. It can be seen in figure 7, that for a given depth and loading rate, sample M3 exhibits lower values of strain rate with respect to M1 and M2, and this difference is more important for higher loading rates.
The sensitivity of Er to the loading/unloading rate (m) was obtained as the slope of the plot of ln Er versus ln loading/unloading rate (figure 9(b)). Two ranges can be observed, when the loading rate was between 0.15 and 0.3 mN s−1 and the range between 0.3 and 1 mN s−1. Sample M1 presents lower values of m (0.17 and 0.07) than sample M3 (0.27 and 0.10) for the first and second ranges, respectively.
4. Conclusions
The influence of the loading/unloading rate on the indentation strain rate, hardness and elastic modulus in Cu-2Be samples subjected to different aging treatments was analyzed. The following conclusions were obtained from this study:
- (1)From the images obtained by optical microscopy, the measurements by SAXS and the hardness measurements, the following results were found: The homogenized sample (M1) consisted of an α matrix. After aging for 1 h at 400 °C (M2), the maximum Vickers microhardness was reached due to the formation of nanoprecipitates with a size of around 10 nm, which would correspond to γ' phase according to the literature. After a longer aging of 10 h at 400 °C (M3), γ' nanoprecipitates would transform into γ phase. The presence of pile-up after the indentations was found in the samples with precipitates.
- (2)The indentation curves of all samples were influenced by the loading/unloading rate. The maximum depth decreased slightly as the rate increased and the final depth remained almost constant in M1. However, the maximum depth and final depth increased with the rate for samples M2 and M3.
- (3)Strain rate levels during loading were also influenced by the loading rate. The strain rate increased almost linearly with the loading rate in M1 and M2, while it experienced a decelerated increase with the loading rate in M3.
- (4)The hardness and reduced modulus were estimated from the indentation curves using the Oliver and Pharr method. The hardness remained almost constant at approximately 2.4 GPa as the rate was varied in the homogenized sample. On the other hand, M2 and M3 exhibited higher hardness values at 0.15 mN s−1, while hardness remained approximately constant for the other rates, with values of 4.3 GPa and 4.1 GPa, in M2 and M3, respectively. The reduced modulus increased with the loading/unloading rate and this increase was more pronounced for M3, with a higher sensitivity of the reduced modulus increase.
This work presents for the first time results about the influence of the loading/unloading rate on the mechanical properties (hardness and elastic modulus) obtained from instrumented nanoindentation measurements on the Cu-2Be alloy subjected to different heat treatments. These results contribute to the understanding of the mechanical properties determined by this technique and make it possible to compare the results obtained in different works under different conditions. However, future work should advance a more in-depth analysis that allows us to understand how strengthening mechanisms are influenced by the loading rate through studies using advanced microscopic techniques.
Acknowledgments
This work was financially supported by Consejo Nacional de Investigaciones Científicas y Técnicas (CONICET, PIP 11220210100560CO), Comisión de Investigaciones Científicas de la Provincia de Buenos Aires (CICPBA) and SECAT (UNCPBA), Argentina. The authors also like to thank to Technician Carlos Frosinini for his collaboration with the sample preparation for hardness measurements.
Data availability statement
All data that support the findings of this study are included within the article (and any supplementary files).
Author contributions
Conceptualization: Susana Montecinos, Sebastián Tognana; Methodology: Susana Montecinos, Sebastián Tognana; Formal analysis and investigation: Susana Montecinos; Writing - original draft preparation: Susana Montecinos; Writing - review and editing: Sebastián Tognana, Walter Salgueiro.
Conflict of interest
The authors declare that they have no conflict of interest.