

Abstract
Transference of the embedded water, so-called virtual water, in the trade of crops among regions within a country is often neglected, leading to no information about the impacts on the water resources of exporting regions, especially if those regions are water-stressed or, worse, water-scarce. Virtual water trade, if not considered through the lens of sustainability, could lead to adverse effects on the water resources of an exporting region. Previous related studies have quantified virtual water trade among the states in the United States providing valuable insights; however, information for specific crop trade among counties, its water footprint (WF) at the county scale, the resultant virtual water flow among counties, and the sustainability assessment of those virtual water flows are lacking. In this study, we calculate the green and blue WF of cereal and milled grain products at the county level and then, using trade data, calculate the virtual water flows among the counties. Then, we assess the sustainability of the import by introducing unsustainable import fraction (UIF), which is the ratio of virtual water imported from water-scarce counties to that of total virtual water imported in the form of cereal and milled grains. Finally, we quantify the change in UIF from the 2007–2017 period. A few of the significant insights discovered through this analysis include: (i) most of the cereal and milled grains trade is occurring among neighboring counties; ii) one-third of US counties import 75% or more virtual water from water scarce regions; (iii) in 2017, Texas and Missouri were the largest importer and exporter, respectively; and (iv) the number of counties importing cereals and milled grains from water-scarce counties increased from 2007 to 2017. Recommendations on alleviating the negative effects of the unsustainable import of cereal and milled grain are provided toward the end of the discussion.
Export citation and abstract BibTeX RIS

Original content from this work may be used under the terms of the Creative Commons Attribution 4.0 license. Any further distribution of this work must maintain attribution to the author(s) and the title of the work, journal citation and DOI.
1. Introduction
Population growth and the consequent increased food demand exert pressure on the limited freshwater resources [1–3]. In addition to the increase in food demand due to the rising population, the changing consumption patterns also add to the declining water availability problem [4–6]. Amid the growing population, sectoral competition for water is also a significant concern as the domestic, industrial, and agricultural sectors require more water [7–9]. Moreover, climate change is worsening the problem, especially in the already arid to semi-arid regions where the models show an increase in evapotranspiration, hence a reduction in the available green water [10–12].
On top of the external stressors impacting water availability, systemic issues such as the unsustainable usage of water or the economic water scarcity in water-abundant regions can also hinder the achievable production of food and affect other uses of water [13–16]. Economic water scarcity is critical in regions where sufficient water is hydrologically available, but its access is limited due to the lack of infrastructure. Economic water scarcity and its adverse effects are not confined to the agriculture sector alone. Drinking water access can also be limited if people's socio-economic conditions prevent them from accessing the water [17].
Globally, the extent of water-scarce regions is expanding [18, 19], and the already scarce areas are experiencing increased water scarcity [20, 21]. To offset the effects of increasing demand on available water resources, efforts are now being undertaken to incorporate and implement sustainable food production systems and responsible consumption [22–25]. Many studies have looked at the world's growing water scarcity problem [26–30]. Even in developed countries such as the US, unsustainable water resource exploitation has been a concern for quite some time. Efforts are being made to mitigate the impacts of low water availability on the agricultural sector through efficient irrigation, crop rotation, and other measures [31–33].
However, unsustainable food production and its impact on local water resources is not the only concern. As regions have become more interconnected, food trade has been increasing, especially imports by rapidly growing countries and economies such as China, the Middle East, and North African nations [34, 35]. Thus, the scale of the problem of sustainability of food production and the resulting water scarcity has become more prominent. In addition to food trade, other agriculture raw products grown in developing countries for industries like textiles, which are ultimately exported elsewhere are also affecting the water resources in the exporting regions [36]. The effects are more pronounced in regions where there is overuse relative to the available quantities of water [37]. There is a growing concern about addressing the water sustainability issues from the perspective of the water movement across different regions [22, 38, 39] through the embedded water in a product called virtual water [40].
Virtual water and water footprint (WF) are the most widely adopted and acceptable approaches to quantify and assess the sustainability of food production and consumption [22, 41], the trade of food commodities [42], and their relationship to the adverse effects on the water resources of the origin regions [43–46]. The virtual water converts the agricultural products into the amount of embedded water in a product. Thus, it quantifies and assesses the sustainability in terms of the amount of water used versus that available. Ultimately any required sustainability or scarcity-based indexes can be derived after the calculation of virtual water volumes.
At a national scale, in the Continental United States (CONUS), studies have employed the WF and virtual water concept to calculate the virtual water flow among the states [47, 48]. In this study, we move beyond the macro-level analysis at the state level to a much finer scale at the county level. We first employ the concept of WF to calculate the green and blue WF of cereal and milled grain products at the county level and then, using trade data, calculate the virtual water flows embedded in the grains among the counties. Finally, we assess the sustainability of the import based on the ratio of virtual water imported from water-scarce counties to that of total virtual water imported in the form of cereal and milled grains. We also look at the change in import sustainability from the 2007–2017 period. Finally, we discuss the sustainability of cereal and milled grains trade at the county level and provide recommendations for reducing the unsustainable trade of these agricultural commodities.
2. Methodology
In this study, we estimated the virtual water flows between counties as a result of cereal grains and milled grain products trade and assessed its sustainability for 2007 and 2017. We collected data on the trade of cereals and milled grain products between counties from Karakoc et al [49] that quantified the food flow of seven food commodity groups among US counties for the years 2007, 2012, and 2017. A weighted average WF of cereals and milled grains was calculated by combining the crop water use data [51] and harvested area and production data obtained from U.S. Department of Agriculture (USDA) [52]. The calculated WF and the mass traded of cereals and milled grains were used to compute the virtual water inflow and outflow between the counties which was used to identify the net virtual water exporting and importing counties. The steps followed to undertake the study, data, and data source are summarized in figure 1 and described in detail in the following sections.

Figure 1. Methodology flow chart.
Download figure:
Standard image High-resolution image2.1. WF of cereal and milled grain production in US counties
2.1.1. Cereal WF
Gridded data on crop water use (m3 ha−1) and harvested area (ha) for the cereal crops were obtained from Mekonnen and Hoekstra [53] and aggregated to the county-level average cereal crop water use (CWUcereal in m3 ha−1). The ten cereal crops considered in this study are wheat, rice, barley, maize, rye, oats, millet, sorghum, buckwheat, and triticale. To convert the cereal crop water use to WF per unit production, we used harvested area and crop production data from the USDA—National Agricultural Statistics Service for 2007 and 2017. For each county, the cereal WF was calculated by multiplying the cereal crop water use by the total cereal harvested area (ha) and dividing it by the total cereal production (kg):

where, WFcereal is the average cereal WF (m3 kg−1) and CWUcereal is the average cereal crop water use (m3 ha−1) in the counties.
2.1.2. Milled grains WF
In addition to cereals, the second category of food commodity considered is standard classification of transported goods (SCTG) category 6 (milled grain products and preparation and bakery products). We followed a step-wise accumulation approach to calculate the WF of milled grain products [54]:

where, WFprod[P] is the water footprint of output product p in volume per unit mass, WFprod[i] is the water footprint of input product i, WFproc[p] is the water footprint of the processing step in volume per unit mass of product p, fp[p,i] is product fraction of output p processed from input i, fv[p] is the value fraction of output p and y is the total number of output product. While the group includes milled grains (flours), bakery products, cereals, starch or milk, and baked products, we used the milled grain WF to represent the entire group due to lack of data on the share of each product in the group. As a result, the WF of the traded products may be slightly underestimated.
Product fraction and value fraction of milled grain products of the cereal crops were obtained from Mekonnen and Hoekstra [53]. The county-level weighted average value fraction to product fraction ratio was calculated based on the production and value fraction to product fraction ratio of milled grain products of each cereal crop (equation (3))

where, (Vf /Pf )mg is the average value fraction to product fraction ratio of the milled grain category, and (Vf /Pf )c is the value fraction to product fraction ratio of milled grains produced from each cereal crop c.
After calculating the average cereal value fraction to product fraction, assuming that the cereals are processed to one output product that is milled grain and assuming the process WF is zero, the step-wise accumulation equation (equation (2)) was simplified to equation (4) and used to calculate the WF of milled grains for all the counties under study

where, WFmg is the average water footprint of milled grains in m3 kg−1.
2.2. Flow of virtual water embedded in cereals and milled grains trade
The WF of the two SCTG categories (cereals and milled grains) calculated using the methods described above was used to convert the food flow from Karakoc et al [49] to virtual water flow. This was done by multiplying the WF of the food categories by their corresponding flow in mass (equation (5))

where, VWF is the volume of water virtually transported with traded goods, WF is the water footprint of the good and MF is the mass of cereal or milled grain traded.
2.3. Sustainability assessment of the trade
The sustainability of the cereal and milled grain import was assessed based on the ratio of virtual water imported from water-scarce counties to the total virtual water imported by a county (equation (6)). It is important to note that only blue virtual water is used while calculating UIF. The fraction of virtual water coming from water-scarce counties is considered the unsustainable import fraction (UIF)

where, VWTws and VWTtot are the amount of blue virtual water imported from water-scarce counties and total blue virtual water import, respectively. The blue water scarcity data is obtained from Mekonnen and Hoekstra [29] at the spatial resolution of 30 arc min and aggregated to the county level.
Export sustainability is considered if a water-scarce county has a net negative virtual water import i.e. exports more virtual water than import. Net import in a county is calculated by subtracting the virtual water import from export. A county is considered a net importer if the value of net import is more than zero otherwise it is considered a net exporter. We assume that the export from a county is not sustainable if the county is a net exporter and faces blue water scarcity.
3. Results
3.1. WF of cereal and milled grain production in the CONUS counties
Cereal production accounts for 685 km3 of water use in the CONUS in 2017 (figure 2) which consists of 69 km3 of blue water and 616 km3 of green water. Most of the water use is concentrated in the Great Plains and Midwestern states with Kansas being the largest water consumer. Most of the counties with crop water use larger than 0.5 km3 are situated in Kansas, Iowa, Nebraska, Illinois, and Minnesota. These five states account for about 44% of the total cereal crop water use in the CONUS. These five states are also the largest cereal producer states contributing about 46% of the cereal production in the CONUS (figure S1). A large fraction of crop water use for cereal production in the eastern US comes from green water, in contrast to the water use in the western US, which mostly relies on blue water (figure S2). Overall, about 90% of the water used for cereal production is green water in the CONUS. The average WF of cereal production is 1500 m3/ton in the CONUS counties which is around 91% of the global cereal WF [50] (ton is referred to as the short ton (2000 lbs) in this study).

Figure 2. Water footprint of cereal and milled grain production in CONUS counties in 2017.
Download figure:
Standard image High-resolution imageThe average milled grain production WF in the CONUS is 1549 m3/ton. Oklahoma has the largest WF of both cereal and milled grain production followed by Montana and Texas, while Midwestern states have a comparatively small WF (figure 3). The difference in the WF of cereal crops among states is due to difference in the climate (evaporative demand) and cereal yield.

Figure 3. Water footprint in CONUS counties for cereal production (a), and milled grain production (b).
Download figure:
Standard image High-resolution image3.2. Virtual water flows through cereal and milled grain trade among CONUS counties
We find that around 70% of the virtual water trade in cereal and milled grain products occurs within the states (figure 4(a)). In fact, most of the trade transactions occur when the origin and destination counties are close (figure S3). Only around 6% of the virtual water flows between the counties that are more than 1000 km apart. On the other hand, trade in cereal and milled grain products between counties within 500 km of each other accounts for around 86% of the virtual water flow in the CONUS. For long-distance trade (more than 2000 km), California and Minnesota are the largest virtual water importer and exporter states, respectively.

Figure 4. Circos plot showing the water transfer from one state to another, (a) includes within-the-state virtual water transfer while (b) considers out-of-the-state transfer only. Most of the water transfer occurs within the states. The figure was created using the freely accessible Circos online tool [55].
Download figure:
Standard image High-resolution imageThe largest virtual water transfer due to trade in cereal and milled grain outside the state occurs from Missouri to Texas (62 km3), followed by Oklahoma to Kansas (22 km3) and Kansas to Texas (20 km3) (figure 4(b)). However, the top three states with the largest intrastate virtual water transfer are Kansas (181 km3), Texas (151 km3), and Nebraska (122 km3). Texas is the largest virtual water importer, followed by Louisiana, importing 95.6 km3 and 48.3 km3 from other states, respectively, while Missouri is the largest virtual water exporter, followed by Kansas, exporting 74.8 km3 and 48.5 km3 to other states through cereal and milled grain trades, respectively.
Figure S4 shows the spatial distribution of the top 500 virtual water importing and exporting counties in the CONUS. Kanas and Texas have the highest number of top 500 exporting and importing counties, respectively. Great Plains states have a high number of importing and exporting counties due to high within-state trade while the Western and Eastern US states have high water importing counties.
About 90% of the Kansas counties are net exporters while 100% of the counties in New Hampshire are net importers (figure S5). The majority of counties in Midwestern and Great Plains states are net exporters while counties of western and eastern coastal states are largely net importers. In terms of total net water imported or exported by the state, Texas is the largest net importer followed by Louisiana while Missouri is the largest net exporter of virtual water followed by Montana (figure 5).

Figure 5. Net virtual water import (import-export) through cereal and milled grain trade in the states. States shown in red import more virtual water than they export, hence net importers and states shown in green are net exporters.
Download figure:
Standard image High-resolution image3.3. Import and export sustainability of cereal and milled grain trade
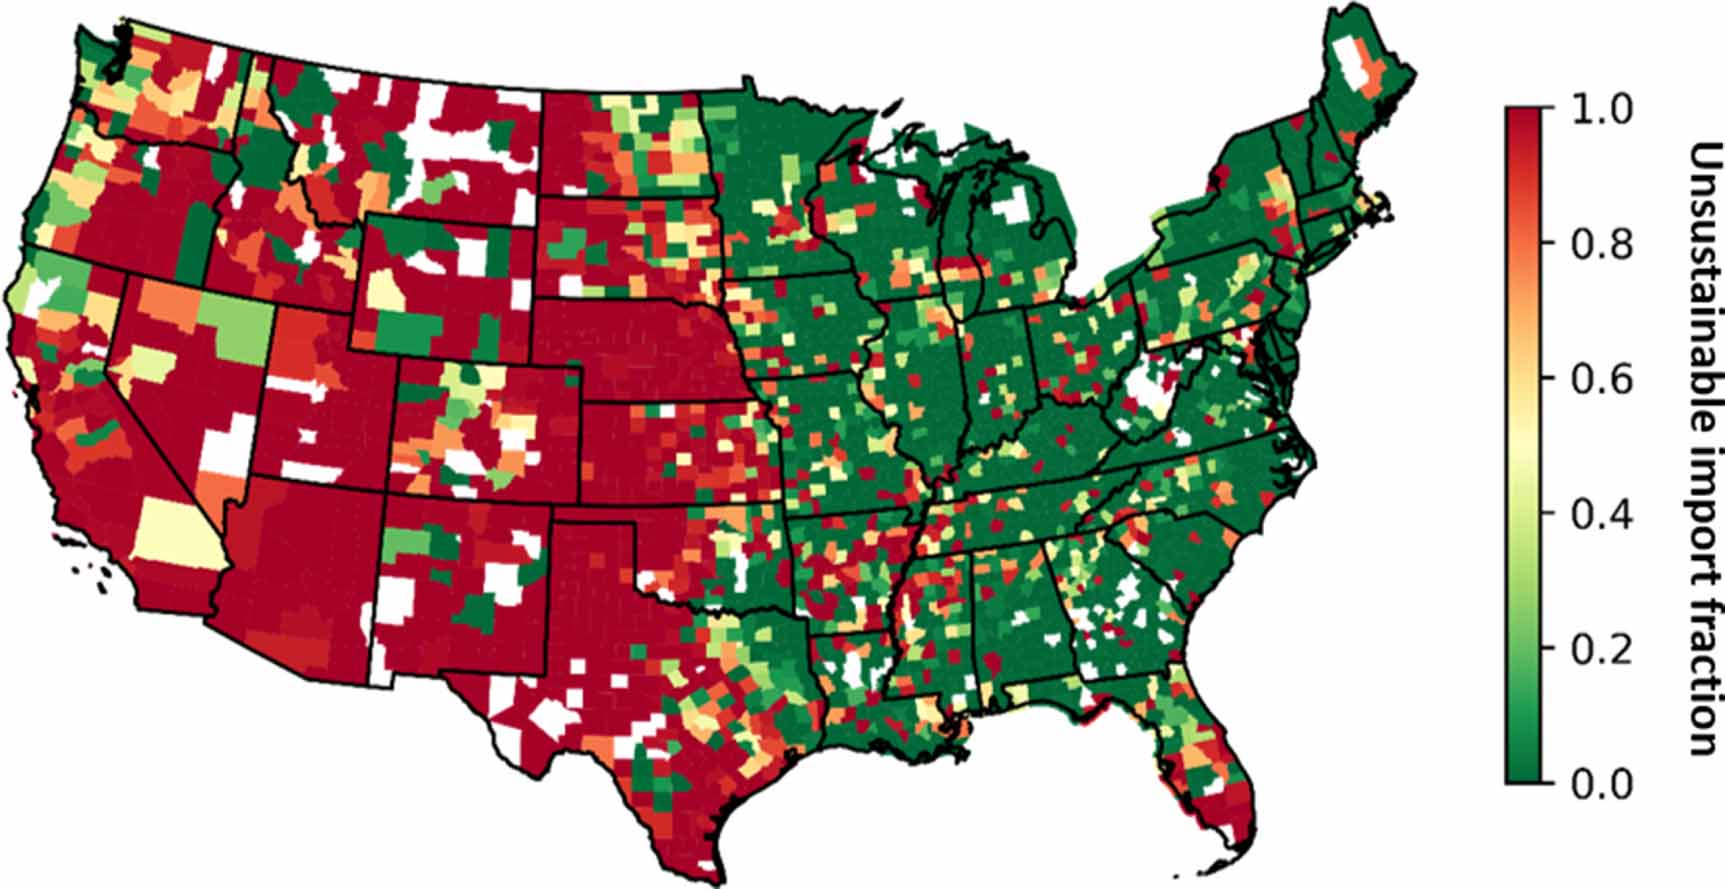
Virtual water import from a water-scarce region may exert pressure on the exporter's resources. The importer may also face supply and demand imbalance due to unsustainable imports from water shortage in the exporter region. We find an eastern and western split in the unsustainable virtual water import fraction (figure 6).

Figure 6. Unsustainable import fraction of cereal and milled grain products across the CONUS.
Download figure:
Standard image High-resolution imageThis is because most of the water-scarce counties in the CONUS are situated in the western part of the country. The Western US counties are largely net importers and most of their import comes from water-scarce regions while Eastern counties import a low percentage of their total virtual water import from water-scarce counties. Around 54% of the CONUS counties have a UIF less than 0.25 and about half of the CONUS counties have UIF < 0.10. These counties are mostly situated in the eastern US. Around 36% of the total counties have a UIF more than or equal to 0.50, moreover, 31% of the total counties in the US have UIF more than or equal to 0.75, or in other words, 31% of the counties imports 75% of the total virtual water flow from water-scarce regions. Further, 7% of the CONUS counties have UIF equal to 1 indicating all of the cereal and milled grain products imported from water-scarce regions.
One-third of the counties having UIF more than or equal to 0.75 are situated in only three states—Texas, Nebraska, and Kansas. Moreover, Nebraska, Arizona, Utah, Kansas, California, Nevada, Idaho, and New Mexico have more than two-thirds of their counties having UIF more than or equal to 0.75 (figure S6). The states facing high import unsustainability have their major originating regions from the Great Plains or arid water-scarce states (figure 7).

Figure 7. Top three virtual water-originating states for other CONUS states.
Download figure:
Standard image High-resolution imageWe define export unsustainability condition when a county faces blue water scarcity and still export virtual blue water. Our results show that 26% of the cereal and milled grain exporting counties export unsustainably and 19% of the counties face severe blue water scarcity (figure 8). Most of these counties are situated in the Great Plains region and one-third of them are in Texas, Nebraska, and Kansas. With 90% of the counties facing blue water scarcity and exporter of virtual blue water, Nebraska has the highest fraction of unsustainable exporter counties. This is followed by Utah and Wyoming with 72% and 70% of counties being unsustainable exporters, respectively.

Figure 8. Spatial plots showing the unsustainability of the export of cereal and milled grain products from counties across the US.
Download figure:
Standard image High-resolution image3.4. Change in virtual water flow and import-export sustainability
The flow of cereal and milled grain products between the US counties was reduced by around 10% from 2007 to 2017 due 36% reduction in trade instances. That results in a reduction of virtual water to 1750 km3 in 2017 from 2396 km3 in 2007. The green virtual water reduces by 31% while blue virtual water reduces by 36%, however, the contribution of green water in total virtual water remains the same, i.e. 92%, in both years.
The WF of cereal and milled grain has substantially decreased over the last ten years. The county-level average WF of cereal grain reduces to 1797 m3/ton in 2017 from 3694 m3/ton in 2007. The reduction in WF can be attributed to the increase in the state average cereal crop yield which increased by 64% in 2017 from 2007 [52]. The mean center of WF shifts 34 km towards the north and 662 km towards the west in the ten years. This suggests that the cereal WF of southeastern states was reduced with time. Also, the average yield of cereal crops in the five southeastern states of Alabama, Georgia, South Carolina, North Carolina, and Tennessee grew more than twofold from 2007 to 2017. Also, North Carolina has the largest average WF of cereal and milled grain in 2007 which shifts to Texas in 2017 (figure S7). The total crop water use for cereal grain production reduces by 88 km3 from 2007 to 2017. However, the location of the mean center of crop water use does not change largely as it shifts by 18 km towards the north and 16 km towards the west.
In 2017, Missouri and Texas were the largest virtual water importers and exporters, respectively, while Illinois and Texas were the largest in 2007. Further, Missouri exports the most virtual water to Texas in 2017, while Montana to Idaho transfer was the largest in 2007. The total number of counties with UIF larger than or equal to 0.75 increased to 962 in 2017 from 902 in 2007, however, the number of counties facing export unsustainability remains almost the same. From 2007 to 2017, the value of the UIF decreased in 1021 counties while increasing in 1208 counties. A decrease in UIF indicates an improvement in a county's import sustainability; conversely, an increase in UIF indicates more virtual water import from water-scarce regions. UIF decreases primarily in counties of southeastern states, and northeastern states while increasing in Midwestern and west coast state counties (figure 9).

Figure 9. The difference in UIF from 2007 to 2017. Increased UIF indicates improving sustainability in imports.
Download figure:
Standard image High-resolution image
4. Discussion
We calculated the virtual water embedded in the trade of cereal and milled grain products in the US using previously developed datasets of food flow between the US counties [56] and the WF of crops and derived crop products [53]. Cereal and milled grain products account for around 42% of the total food flow between US counties. Our analysis shows that the cereal and milled grain trade resulted in 1756 km3 of virtual water flow within the US in 2017. One-third of US counties import a large fraction of the cereal and milled grain products from water-scarce counties and are categorized as severely unsustainable importers. About 46% of the total virtual water of cereal and milled grain products are imported by counties that import more than 75% of their products from water-scarce regions. Further, one-fourth of the US counties export virtual water through cereal and milled grain transport, despite facing blue water scarcity. The majority of unsustainable trading counties are located in Great Plains states and Midwestern states. We find that counties in the Corn Belt are large virtual water exporters, while counties in eastern and western coastal states are importers. Midwestern states also include counties that are highly unsustainable in terms of exporting and importing. The number of counties with unsustainable imports increased from 2007 to 2017.
Our study uses UIF to identify unsustainable importing and exporting counties based on the fraction of virtual water imported from water-scarce counties to the total water imported by a county. Export unsustainability refers to the trade that originates from an already water-scarce county. In this study, we focus on cereal and milled grain products, hence the sustainability in trade pertains to only these two categories. Therefore, UIF indicating import unsustainability in a county does not imply unsustainability in overall food import. One of the main uses of the UIF is to identify counties that are heavily dependent on imports from water-scarce counties. These counties may be at a greater risk of unsustainability in their food systems, and the UIF can help to highlight this issue. Additionally, the UIF can be used to track changes in the sustainability of imports over time, which can be useful for policy makers and other stakeholders. Moreover, a county may trade cereal and milled grains in an unsustainable manner being a sustainable importer of total food products. A comprehensive study incorporating all major food categories may determine the overall sustainability of the trade between counties. Additionally, UIF may results in high values and its conclusion may not be rational if a county imports little virtual water. In conclusion, while the UIF has limitations, it is still a useful metric for assessing the sustainability of food product imports in a specific context.
We use the WF of cereal crops and annual blue water scarcity data [29] from circa 2000 and the county food flow data for 2017. This study assumes that county-level crop water use (actual evapotranspiration) and blue water scarcity do not change significantly since 2000. Moreover, because we assume that milled grain products constitute the majority of the SCTG category 6 food products, we did not include the bakery products such as pasta, baked snacks food, and other baked products in the WF calculation, resulting in a slight underestimation of the WF.
Oklahoma, Montana, Texas, Missouri, and North Dakota are the top five states with the largest WF (m3/ton) of cereal, with Oklahoma having more than twice the cereal WF in Kansas, the state with the largest total water use (m3/year) for cereal production. The large WF makes the virtual water content high for exporting states. The largest out-of-state virtual water transfer occurs from Missouri to Texas, but the food amount traded is in the 72nd percentile. Kansas exports about half the cereal amount that Illinois exports but the water used for cereal production in Illinois is around 60% of that in Kansas.
The import unsustainability in the counties can be reduced by either alleviating water scarcity in the origin counties or lessening the dependency on food imports from Midwestern counties. Blue water scarcity in those regions can be reduced by improving water productivity, precision agriculture, building water infrastructure, avoiding water-intensive crops, etc.
5. Conclusion
Cereal and milled grains are important sources of nutrition and a major contributor to the calorie requirement for people all over the world. Around 60% of the calories are derived from cereals in developing countries [57]. Trade of food commodities such as cereals not only involve the flow of the foods but also the water embedded in them. This study assessed the sustainability of virtual water flow among US states and counties due to the cereal and milled grains trade. The study revealed that the majority of virtual water flows in the US occur through the trade of cereal and milled grains within neighboring counties. In 2017, Texas was the largest virtual water importer, while Missouri was the largest exporter. Results of this study indicate that about one-third of the US counties import cereal and milled grains unsustainably. The majority of counties in the Great Plain states and the Western US import unsustainably. In addition, counties in the Great Plains states face export unsustainability too due to high blue water scarcity in the region. WF and crop water use distribution changes in the ten-year span from 2007 to 2017. The number of counties importing in an unsustainable manner increases in 2017. This calls for measures regarding changing the direction of trade of goods. Water scarcity level, available water resources and water productivity of the states and counties should be considered as one factor for export and import activities.
Acknowledgments
Demeke B was funded through the Global Water Security Center (GWSC), Alabama Water Institute, University of Alabama.
Data availability statement
The data cannot be made publicly available upon publication because they are not available in a format that is sufficiently accessible or reusable by other researchers. The data that support the findings of this study are available upon reasonable request from the authors.
Conflict of interest
The authors have no competing interests.
Supplementary data (1.1 MB DOCX)