
Abstract
Potentiostatic cathodic electrodeposition of CdTe on gold substrate was studied using basic aqueous electrolytic baths in which Cd(II) and Te(IV) species were dissolved to form  and
and  ions, respectively (en: ethylenediamine). The stoichiometry of electrodeposited CdTe can be controlled by changing the Cd(II)/Te(IV) concentration ratio, pH, and/or the ethylenediamine content of the baths. Differences in the deposition behavior between two basic media with different complexing agents, ethylenediamine and ammonia, were discussed thermodynamically with potential-pH diagrams drawn for the
  and the
  systems. All the deposits with near stoichiometric composition prepared at −0.70 V vs. standard hydrogen electrode had a flat and smooth morphology. The use of ethylenediamine instead of ammonia made it possible to raise the temperature of electrolytic baths to 363 K, resulting in highly crystalline CdTe deposits without any post-treatment under a wide range of experimental conditions. © 2001 The Electrochemical Society. All rights reserved.
Export citation and abstract BibTeX RIS
Cadmium telluride (CdTe), a well-known II-VI compound semiconductor, has a direct bandgap of 1.44 eV at room temperature, and is thus suitable for solar energy conversion material with photovoltaic cells. In addition to some dry processes such as screen printing and close-spaced sublimation, the preparation of cadmium telluride deposits by electrochemical processes has been well investigated by many research groups,1
2
3 and a solar cell device with an n-CdS/p-CdTe heterojunction with about 14% efficiency has been reported.4 Although aqueous sulfate solutions of pH 0-2 have historically and almost exclusively been employed for the electrolytic baths for CdTe electrodeposition, we recently proposed that ammoniacal basic aqueous solutions are also suitable for CdTe electrodeposition5
6
7
8
9 since the basic solutions have a relatively high solubility of Te(IV) species as  ions.
ions.
The electrodeposition of stoichiometric CdTe from the basic solutions took place at potentials positive of the Nernst potential for bulk Cd deposition,7 just as in the case of acidic baths,1 and we devised a potential-pH diagram for the  system,10 by which the deposition behavior was well described.9 A set of polarization curve data demonstrated that the deposition of not only bulk Te but also CdTe is poisoned by the addition of Cd(II) ions. According to these findings, we figured out the electrodeposition mechanism as: (i) cathodic electrodeposition of tellurium atoms
  is followed by (ii) an immediate adsorption of
  ions on the tellurium, and (iii) underpotential deposition of the
  ions to form CdTe
  9 It is necessary for the formation of stoichiometric CdTe that the deposition of Te is quantitatively followed by that of Cd. If Te atoms deposit on previously deposited Te, bulk-Te forms. Therefore, adsorption of Cd(II) ions on deposited Te should occur immediately to prevent a codeposition of bulk-Te, although an over-adsorption of Cd(II) ions sometimes poisons the Te deposition not only on Te but also on previously deposited Cd, resulting in a small overall rate of CdTe deposition. Deviation from stoichiometric composition of CdTe electrodeposited from ammoniacal baths was controllable by the Cd(II)/Te(IV) concentration ratio, pH, or ammonia content, i.e., concentration of ligand, of the baths.8
9 The cadmium content of the resulting deposit increased with increasing Cd(II)/Te(IV) concentration ratio, rising pH, or decreasing ammonia content of the electrolytes; the deposition behavior was also well accounted for in terms of the potential-pH diagram and the deposition mechanism.
9 It is necessary for the formation of stoichiometric CdTe that the deposition of Te is quantitatively followed by that of Cd. If Te atoms deposit on previously deposited Te, bulk-Te forms. Therefore, adsorption of Cd(II) ions on deposited Te should occur immediately to prevent a codeposition of bulk-Te, although an over-adsorption of Cd(II) ions sometimes poisons the Te deposition not only on Te but also on previously deposited Cd, resulting in a small overall rate of CdTe deposition. Deviation from stoichiometric composition of CdTe electrodeposited from ammoniacal baths was controllable by the Cd(II)/Te(IV) concentration ratio, pH, or ammonia content, i.e., concentration of ligand, of the baths.8
9 The cadmium content of the resulting deposit increased with increasing Cd(II)/Te(IV) concentration ratio, rising pH, or decreasing ammonia content of the electrolytes; the deposition behavior was also well accounted for in terms of the potential-pH diagram and the deposition mechanism.
Cadmium(II) species are hydrolyzed to form insoluble  in basic aqueous media without appropriate ligand(s), i.e., complexing agent(s).11 Ammonia is an inexpensive compound which functions as a complexing agent for Cd(II) species and thus is suitable for electrolytic mass production. Furthermore, the use of ammoniacal-basic solutions will be favorable, since the solutions do not contain alkaline metal ions, which sometimes act as impurities in semiconductor devices. However, the ammoniacal baths is somewhat troublesome to handle due to the high volatility of ammonia during high temperature depositions. For example, 4.0 M
  ammonia water boils at about 355 K12 and, therefore, CdTe electrodeposition from ammoniacal baths at temperatures higher than 343 K (70°C) was not examined in our recent work. In the present study, we tried to use ethylenediamine
  a less volatile bidentate amine ligand, in place of ammonia. Based on the electrolytic conditions9 found for the ammoniacal baths, conditions to give a stoichiometric CdTe deposit, which has a flat and smooth morphology as well as a relatively high crystallinity without postdeposition annealing, were investigated using basic ethylenediamine-based baths. Differences in the deposition behavior between the ammoniacal and ethylenediamine-based basic media were discussed thermodynamically in terms of potential-pH diagrams and of the deposition mechanism. Attempts to electrodeposit CdTe at 363 K (90°C), a temperature higher than 343 K (70°C), were also made under some conditions.
Experimental
Basic aqueous electrolytes containing 
 and ethylenediamine (en) were employed for the CdTe electrodeposition. All the chemicals (Nacalai Tesque, Inc.) were of reagent grade and used without pretreatment; the aqueous electrolytes were prepared by dissolving the chemicals in deionized water with a specific resistance larger than
  Tables I and II summarize the concentrations of Cd(II), Te(IV), and ethylenediamine and the pH of the basic electrolytes prepared for this work. The pH of the electrolytes was adjusted by the addition of sulfuric acid. The pH of electrolytes ranged from 9.5 to 12.5 and the Cd(II) and Te(IV) species were thus dissolved as
  and
and  ions, respectively. The pH was measured at room temperature, 298 K, with a conventional glass electrode calibrated using both saturated
  (pH 12.45 at 298 K) and 0.01 M
  (pH 9.18 at 298 K) aqueous solutions. All cathodic electrodepositions were carried out at 343 or 363 K (see below) under potentiostatic conditions using a conventional three-electrode setup, which comprises a potentiostat (Hokuto Denko HA-151) connected to a function generator (Hokuto Denko HB-111) and a coulometer (Hokuto Denko HF-201). An Ag/AgCl electrode immersed in 3.3 M KCl was used as a reference. The electrode potentials were recalculated for standard hydrogen electrode (SHE). The deposition potential and the total quantity of charge passed during the electrodeposition were kept at −0.70 V vs. SHE and 1.5 C, respectively, for all experimental runs. Gold-plated copper sheet
  and platinum sheet
  were employed for the working and counter electrodes, respectively. The gold plating (thickness ca. 3 μm) was carried out using a

 aqueous plating bath under galvanostatic conditions of 15 mA cm−2 at 343 K; before the gold plating, the copper sheets were polished with 0.3 μm alumina abrasive, degreased with

 surfactant aqueous solution, and rinsed with 10%
  A part of the working electrode surface was covered with Teflon adhesive tape so that a known area
  was exposed to the electrolyte as the surface of the working electrode. A cylindrical glass vessel (capacity 250 cm3) with a silicon rubber lid was used as an electrolytic cell. The vessel was placed in a light resistant box in order to eliminate any photoinduced effects13
14 on the growing CdTe. The electrolyte was agitated at 500 rpm with a magnetic stirring unit, and the temperature of the solutions was kept constant with a rubber heater controlled by a thermoregulator. When electrolyzed at 343 K, the electrolyte and the KCl solution of the reference were connected electrically with an agar bridge prepared with saturated KCl solution. At 363 K, however, since the agar was not stable, the reference electrode fitted with a ground glass liquid junction was immersed in an attached glass vessel filled with ethylenediamine-based electrolyte of 298 K having the same composition as that in the main electrolytic cell, and the two solutions in the attached vessel and the main cell were connected with an U-shaped liquid bridge. Cyclic voltammograms (CVs) for stagnant electrolytes were obtained by scanning the potential of the working electrode at a constant scan rate of 10 mV s−1 using the same electrolytic setup.
was exposed to the electrolyte as the surface of the working electrode. A cylindrical glass vessel (capacity 250 cm3) with a silicon rubber lid was used as an electrolytic cell. The vessel was placed in a light resistant box in order to eliminate any photoinduced effects13
14 on the growing CdTe. The electrolyte was agitated at 500 rpm with a magnetic stirring unit, and the temperature of the solutions was kept constant with a rubber heater controlled by a thermoregulator. When electrolyzed at 343 K, the electrolyte and the KCl solution of the reference were connected electrically with an agar bridge prepared with saturated KCl solution. At 363 K, however, since the agar was not stable, the reference electrode fitted with a ground glass liquid junction was immersed in an attached glass vessel filled with ethylenediamine-based electrolyte of 298 K having the same composition as that in the main electrolytic cell, and the two solutions in the attached vessel and the main cell were connected with an U-shaped liquid bridge. Cyclic voltammograms (CVs) for stagnant electrolytes were obtained by scanning the potential of the working electrode at a constant scan rate of 10 mV s−1 using the same electrolytic setup.
Table I.
| List of aqueous electrolytes containing ethylenediamine (en) employed for potentiostatic electrodeposition of CdTe (1). | ||||||||
|---|---|---|---|---|---|---|---|---|
 b
(M)
b
(M) | pH | [Te(IV)](mM) | [Cd(II)] (mM) | |||||
| 40 | 60 | 100 | 150 | 200 | ||||
| 2.5 | 11.00 | 10 | a1a | b1 | c1 | d1 | e1 | |
| 1.5 | 11.00 | 10 | a2a | c2 | ||||
| 1.0 | 11.00 | 10 | a3a | c3 | ||||
| 0.5 | 11.00 | 10 | c4 | |||||
 b
(M)
b
(M) | [Cd(II)](mM) | [Te(IV)](mM) | pH | |||||
| 11.00 | 11.25 | 11.50 | 11.75 | 12.00 | 12.50 | |||
| 2.5 | 40 | 10 | A1a | B1 | C1 | D1 | E1 | F1 |
| 1.5 | 40 | 10 | A2b | B2 | C2 | |||
| 1.0 | 40 | 10 | A3a | B3 | C3 | E3 | ||
| a Conditions a1, a2, and a3 are the same as A1, A2, and A3, respectively. | ||||||||
b 
| ||||||||
Table II.
| List of aqueous electrolytes containing ethylenediamine (en) employed for potentiostatic electrodeposition of CdTe (2). | ||||||||||
|---|---|---|---|---|---|---|---|---|---|---|
 a
(M)
a
(M) | [Cd(II)](mM) | [Te(IV)](mM) | pH | |||||||
| 9.50 | 9.75 | 10.00 | 10.25 | 10.50 | 10.75 | 11.00 | 11.50 | |||
| 1.00 | 10 | 10 | S1 | T1 | U1 | V1 | W1 | X1 | Y1 | Z1 |
| 0.75 | 10 | 10 | S2 | T2 | U2 | V2 | W2 | X2 | ||
| 0.50 | 10 | 10 | S3 | T3 | U3 | V3 | W3 | |||
| 0.25 | 10 | 10 | S4 | T4 | U4 | V4 | W4 | |||
a 
| ||||||||||
The morphology of the resulting deposits was examined with an X-ray diffractometer (XRD) equipped with a molybdenum X-ray tube  and with a scanning electron microscope (SEM). The composition of the deposits was determined within error of 1% by electron probe microanalysis.
Results and Discussion
Comparison with the deposition behavior from ammoniacal baths
Our recent study9 concluded that ammoniacal baths of pH 10.7-11.0 with composition: 
 and
and  where
where  give CdTe deposits of near stoichiometry under potentiostatic electrodeposition at −0.70 V vs. SHE. Considering that ammonia is a monodentate ligand while ethylenediamine is a bidentate, it seemed that the situation of
  might simply correspond to that of
  that is the same concentration of coordinating atoms. Based on this concept, we began an investigation on ethylenediamine bath with solution a1 (or A1; see Tables I and II), i.e., the solution of pH 11.0 containing
 and
and  Figure 1 summarizes the XRD patterns of deposits obtained from solution a1 (Fig. 1a) as well as those from corresponding ammoniacal solutions of pH 10.5 (Fig. 1b), 10.7 (Fig. 1c), and 11.0 (Fig. 1d), each of which contains
 and
and  In addition to diffraction peaks attributed to the substrate materials, Au15 and Cu,16 there was a peak at around 2θ of 10-13°. In this 2θ range, diffractions from CdTe(111)17
  and/or Te(101)18
  planes may appear.
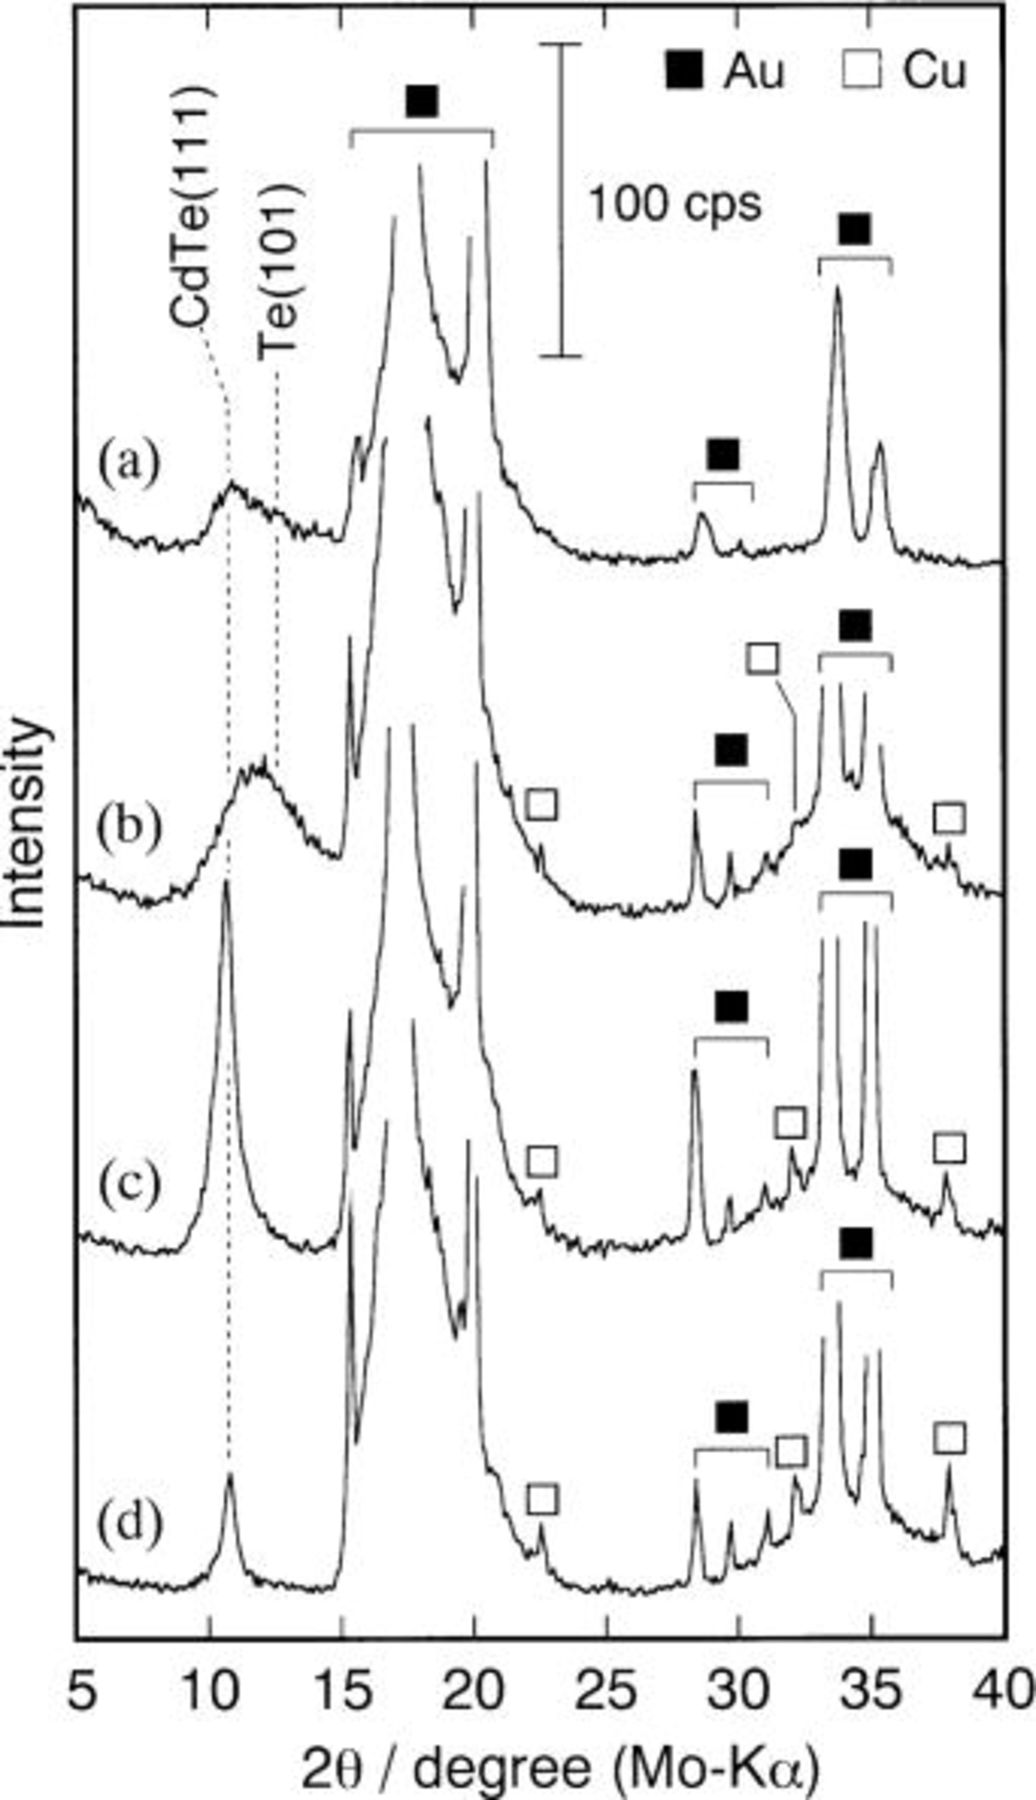
Figure 1. XRD of deposits obtained at 343 K from (a) ethylenediamine bath (

 ) of pH 11.0 and ammoniacal baths (

 ) of (b) pH 10.5, (c) pH 10.7, and (d) pH 11.0. Cathode potential was −0.70 V vs. SHE. Total quantity of charge was 1.5 C.
The three deposits obtained from ammoniacal baths with different pH gave a set of characteristic diffraction peaks: (i) a broad halo-like peak ranging between 8-15° (Fig. 1b), (ii) a relatively sharp diffraction from the CdTe(111) plane (Fig. 1c), and (iii) a sharp but rather weak diffraction due to CdTe(111) (Fig. 1d). Since the compositions of the deposits (i), (ii), and (iii) were 37.9, 49.1, and 50.7 mol % Cd, respectively, they were categorized in the previous work9 as Te-rich amorphous, Te-rich CdTe, and Cd-rich CdTe. The Cd contents  of the Te-rich amorphous deposits were usually
  while those of the Te-rich and Cd-rich CdTe were
  and
and  9 On the other hand, XRD for the deposit obtained from ethylenediamine solution a1 (Fig. 1a) provided a rather broad peak, like that of Fig. 1b, and the Cd content of the deposit was 31.4 mol %, indicating that the deposit fell into the category of Te-rich amorphous. Therefore, it can be concluded that the deposition of cadmium from an ethylenediamine bath is hindered compared with that from the corresponding ammoniacal bath.
To compare the thermodynamics of CdTe electrodeposition from ethylenediamine with that from ammoniacal baths, a potential-pH diagram of the  system was constructed in the same manner described previously10 for the
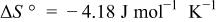
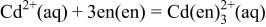
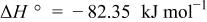
  system. Table III summarizes the equilibrium reactions and conditions concerning Cd(II)-en complexes considered to construct the diagram in the pH range of 8-14.5 and the potential range of −1.0 to +1.0 V vs. SHE. Formation enthalpy and entropy data of Cd(II)-en complexes used to calculate the reaction conditions were as follows19

Equilibrium reactions, in which Cd(II)-en complexes do not participate, and chemical potential data of other species which were also used for the  system,10 e.g.,
 and
and  are summarized in Tables II and I of Ref. 10, respectively. For simplicity, it was assumed that protonated ethylenediamine species
  were not coordinate to
  ions, although one of the amino group of
  is still active as a coordination site. Doubly protonated species
  of which acid dissociation constant
  is
is  19 is not dominant at pH 8-14.5 and thus we considered
The  of
of  19 (i.e.,
  gives the relationship

and Eq. 1 and 2 then provide the relationship among pH, [en], and  as
as

Since ethylenediamine is a neutral molecule above  all the
  values used for the calculations were those under ionic strength of 0.1 for the sake of convenience, though the bath sometimes contains a concentrated amount of ethylenediamine, e.g.,
Table III.
List of equilibrium reactionsa and conditionsb,c concerning Cd(II)-en complexes,  and and  considered to construct potential-pH diagram of the considered to construct potential-pH diagram of the 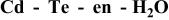 system. Molar concentrations (mol dm−3) of dissolved substances are designated in brackets, e.g., system. Molar concentrations (mol dm−3) of dissolved substances are designated in brackets, e.g.,  | ||
|---|---|---|
| Equilibrium reactions | Equilibrium conditions | |
| 1 |
 |
 |
| 2 |
 |
 |
| 3 |
 |
 |
| 4 |
 |
 |
| 5 |
 |

 |
| 6 |
 |
 |
| 7 |
 |
 |
a For other reactions, where  and and  do not participate, see Table II of Ref. 10. do not participate, see Table II of Ref. 10. | ||
b Cd,  Te, and CdTe were considered to be solid with activity of 1. Te, and CdTe were considered to be solid with activity of 1. | ||
c  since the acid dissociation constant since the acid dissociation constant  of ethylenediamine is of ethylenediamine is   for pH > 10.89 and for pH > 10.89 and  for for  protonated ethylenediamine protonated ethylenediamine  was considered not to coordinate to cadmium ion (see the text). was considered not to coordinate to cadmium ion (see the text). | ||
Figure 2 depicts potential-pH diagrams of the  and
and  systems devised under the following conditions: activity of dissolving cadmium species
  and tellurium species
  temperature 298 K,
  1.0, 2.5 M (Fig. 2a) or
  (Fig. 2b); here, we identified the activity
  of dissolved substances M with their molar concentration [M] in molarity (mol dm−3). Potentials for the deposition of elemental Cd are also indicated in the diagrams. Deposition potential of CdTe at pH 10.5-11.0 for ethylenediamine and ammoniacal solutions are determined by the following reactions


It is clear that the potential of Reaction 4-1 at  M is about 85 mV negative than that of Reaction 4-2 at
  M. The same negative shift of 85 mV is evident for the potential of the deposition of elemental Cd

taking into account that the potential difference of Reactions 4-1 and 5-1 and that of 4-2 and 5-2 are both 516 mV, which is determined as  1 and is independent of the type of ligand to Cd(II); here,
  is the free energy of CdTe formation
  and F the Faraday constant. As mentioned in the Introduction, the deposition mechanism of CdTe is (i) the reductive deposition of Te atoms

followed by (ii) adsorption and (iii) underpotential deposition of Cd atoms on the resulting Te atoms to form CdTe (Reaction 4);9 here, the word underpotential means the potential positive of the Nernst potential for bulk Cd deposition (Reaction 5). The composition of the resulting deposit at potentials positive of bulk Cd deposition is, therefore, governed by both the overpotential of Te deposition (Reaction 6)  and that of Cd deposition on the surface Te (Reaction 4)
  or, to be specific, by the difference in overpotentials
  and
and  which corresponds to the width of the domain of stability of Te on the potential-pH diagram. The two potential-pH diagrams manifest that, under the same potentiostatic condition, e.g.,
  vs. SHE, the overpotential
  in the ethylenediamine solution of
  M is smaller than that in the ammoniacal solution of
  while the
  for the ethylenediamine solution is identical to that for the ammoniacal one. This indicates that the width of the domain of Te on the diagram of the
  system (Fig. 2b) is narrower than that of corresponding
  system under
  M (Fig. 2a). In consequence, the deposition of Cd atoms on previously deposited Te atoms in the ethylenediamine solution does not occur fast enough to prevent the deposition of Te on itself and, thus, the deposit from the ethylenediamine solution is expected to have a composition poorer in cadmium than that from the corresponding ammoniacal bath.
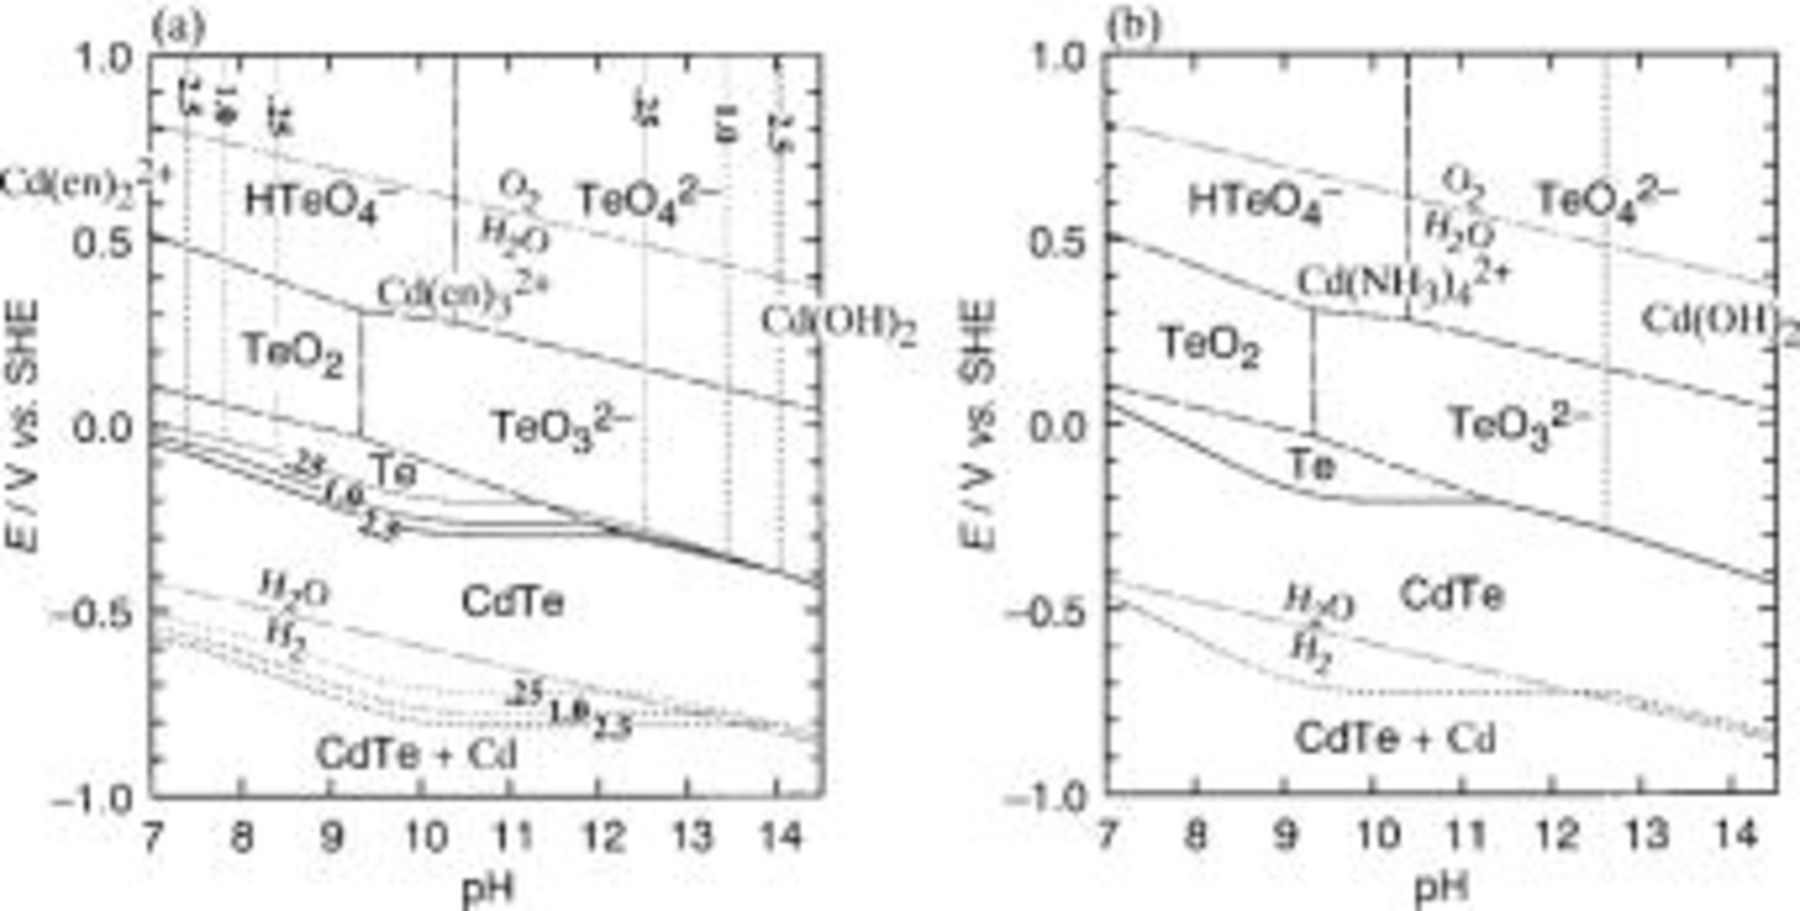
Figure 2. Potential-pH diagrams of (a) the  and (b) the
  systems at 298 K calculated assuming that the activities of dissolved cadmium and tellurium species are
  and
and  respectively, that the total ethylenediamine concentrations
  are 0.25, 1.0, and 2.5 M, and that the total ammonia concentration
  is 5.0 M. (--------) and (—) are boundaries of cadmium- and tellurium-containing species, respectively, (⎯) boundary of CdTe, and (—-—-—) an electrochemical window of water.
Figure 3 shows typical CVs for basic ethylenediamine  and ammoniacal baths
  containing both Cd(II) and Te(IV) ions. In the voltammogram of the ethylenediamine bath (Fig. 3a) there are two cathodic
  and two anodic
 waves. Comparison of the voltammogram with that of the ammoniacal bath (Fig. 3b)10 revealed that the waves
  and
and  corresponded to the forward processes of Reactions 8 and 4, respectively, while
  and
and  corresponded to the backward ones. A large peak separation of waves A (or
  ) and F (or
  ) due to
  redox showed that Reaction 8 is irreversible. The deposition and stripping features, each of which exhibited two waves during formation and decomposition of CdTe, demonstrated the presence of the stability domain of elemental Te between the domains of CdTe and
  in the potential-pH diagrams. It is noteworthy that the cathodic wave
  deposition of CdTe, and anodic wave
  decomposition of CdTe to elemental Te and
  appeared at potentials more negative than the case of the ammoniacal bath, i.e., waves B and E, while anodic dissolution of resulting elemental Te
  occurred at almost the same potential as wave F. These observations coincide with the fact that, while Reaction 8 is identical for ethylenediamine and corresponding ammoniacal baths, the Nernst potential of Reaction 4 is more negative than that of Reaction 4, as calculated above. The deposition of bulk-Cd (C) and its stripping (D) did not appear for the ethylenediamine bath in the potential range scanned beyond −0.8 V vs. SHE, also suggesting the validity of the potential-pH diagrams. Although the anodic peaks F and
  appeared at identical potentials, corresponding cathodic peaks A and
  were recognized at different potentials: Te deposition
  from the ethylenediamine bath was shifted negatively compared with that (A) from the ammoniacal bath. This is not consistent with the above discussion that Reaction 8 should occur at the same potential unless [Te(IV)] is different. We have no definite interpretation of the shift, but it might be due to a difference of irreversible nature of
  redox between ethylenediamine and ammoniacal baths. The small anodic peak of the stripping of underpotential deposited Te layer on the Au substrate, i.e., peak G, was unclear for the ethylenediamine bath. This seemed to be attributed to a difference in deposit obtained from the ammoniacal and ethylenediamine baths employed for the voltammetry; the former gave a Te-rich polycrystalline deposit, and the latter a Te-rich amorphous deposit which does not have a well-ordered Te structure on the Au surface.
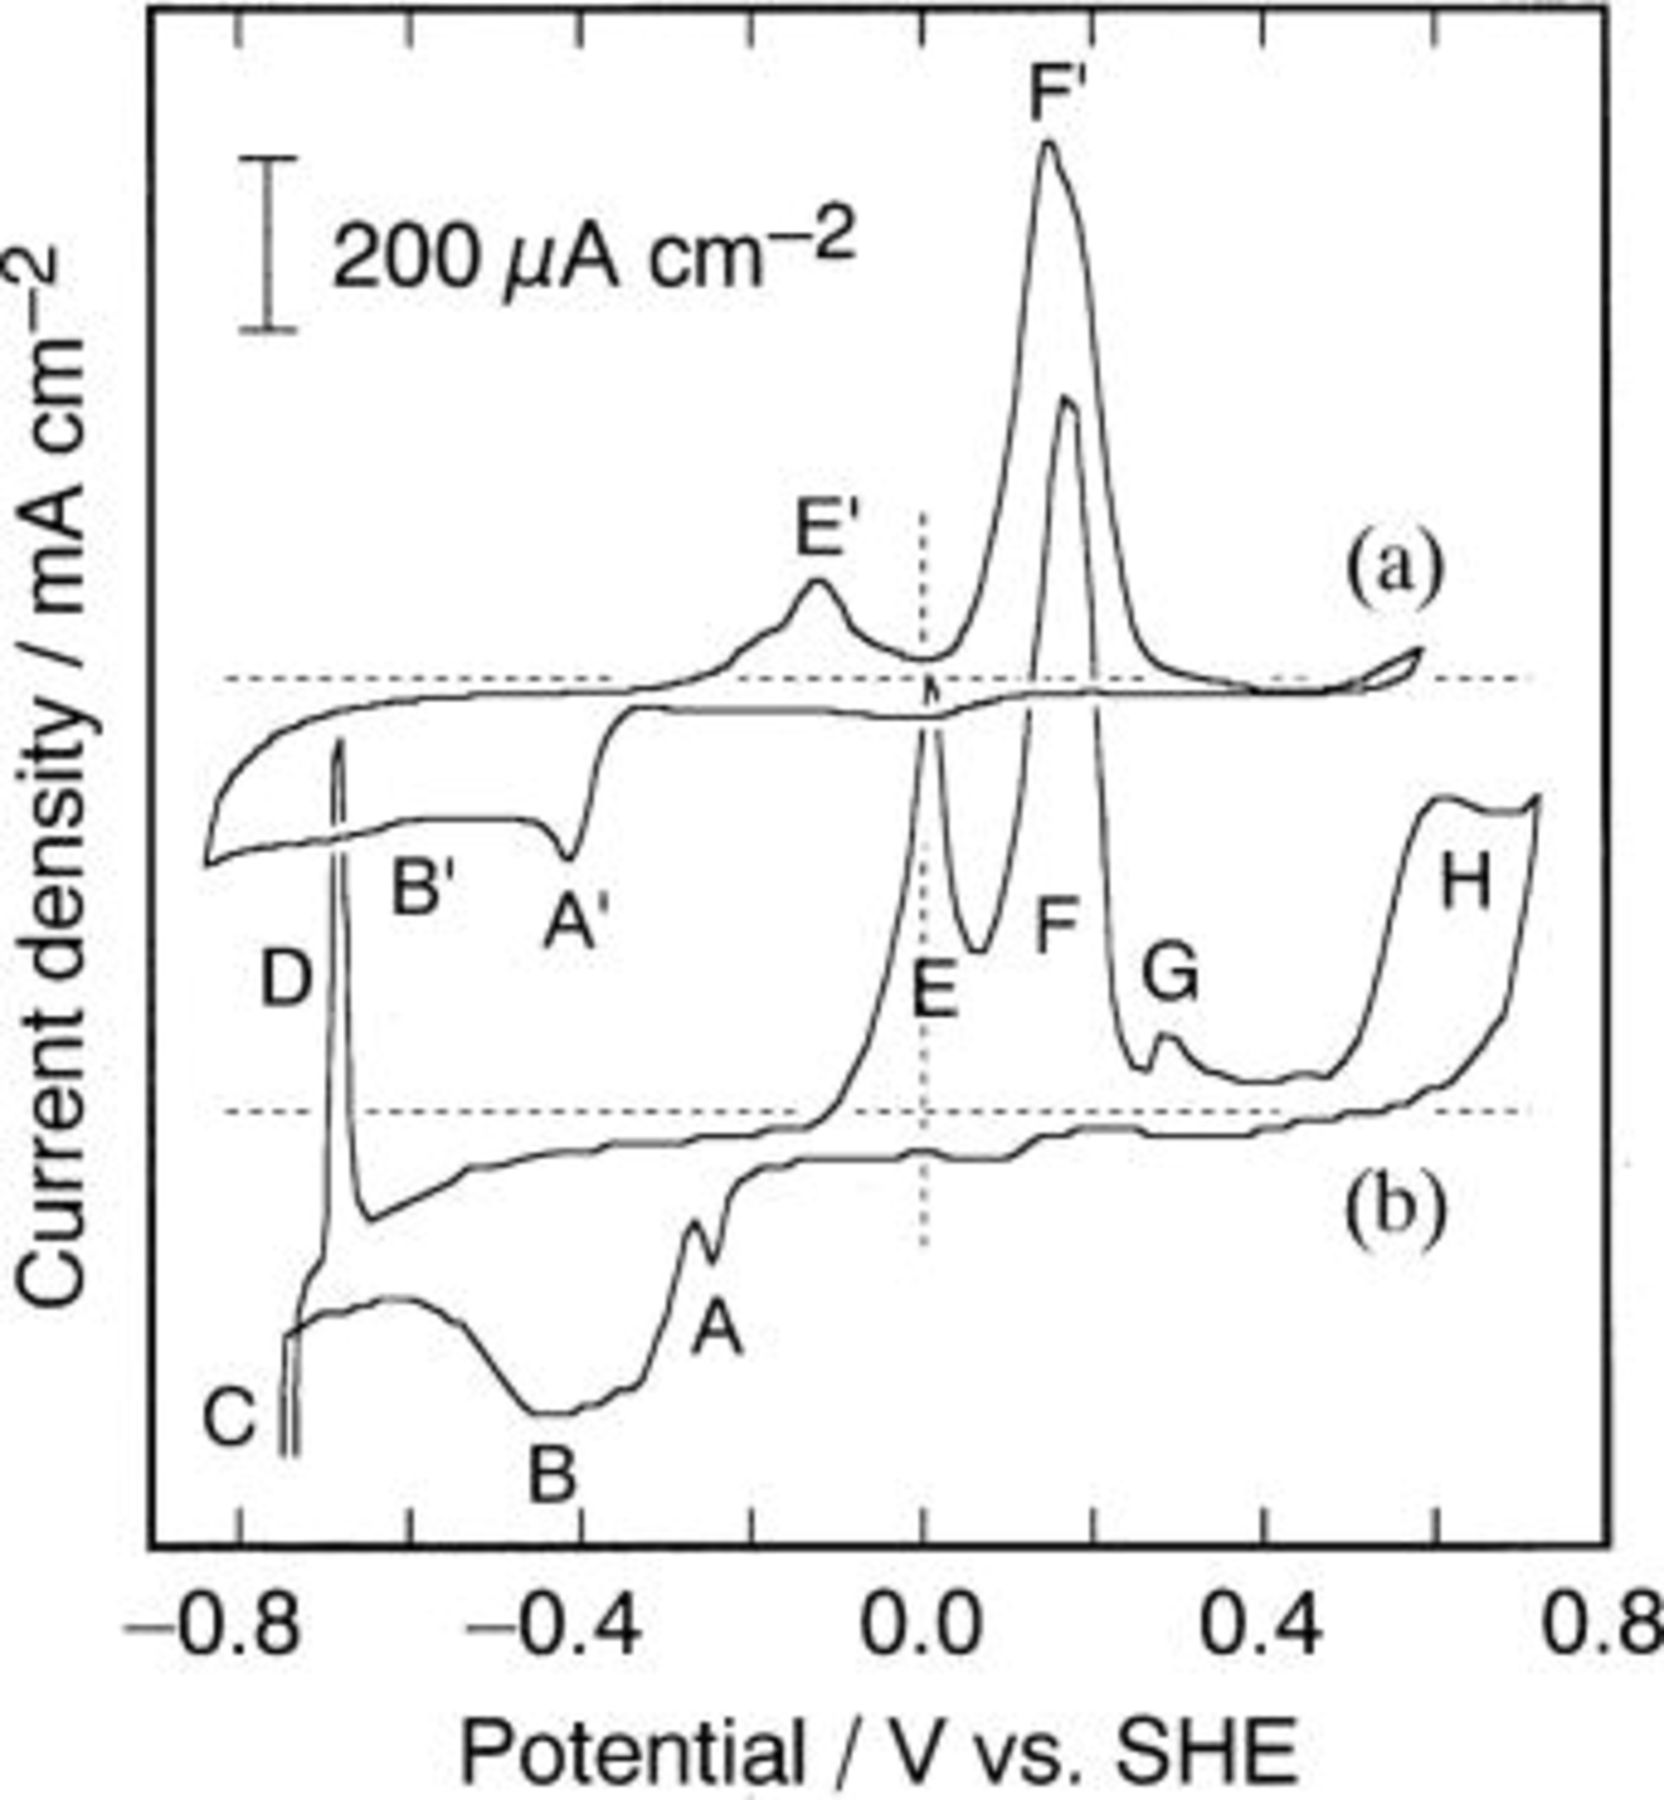
Figure 3. CVs for (a) the ethylenediamine solution (

 ) and (b) the ammoniacal solution

 ) at 343 K.
Effect of composition and pH of ethylenediamine baths
Based on the results described in the preceding section, the deposition condition was modified so as to promote the deposition of cadmium or to suppress the deposition of tellurium, in order to obtain a stoichiometric CdTe deposit from ethylenediamine-based solutions. The most straightforward way to promote the deposition of cadmium would be to increase the Cd(II) concentration, i.e.,  keeping [Te(IV)] constant. From a thermodynamic point of view, increasing
  corresponds to a positive shift of the Nernst potential for the deposition of Cd atoms on Te to form CdTe according to Reaction 4. The potential of Reaction 4 given by

suggests that not only increasing  but also decreasing ethylenediamine concentration, i.e., [en], leads to a positive shift of the potential and to a promotion of the cadmium deposition. On the other hand, a negative shift of the potential of Te deposition (Reaction 8), of which the potential is defined as

by rising pH or decreasing Te(IV) concentration, i.e.,  is practical to suppress the deposition of tellurium. Consequently, based on the initial conditions,

 and pH 11.0 (i.e., solution a1 or A1 in Table I), attempts to deposit stoichiometric crystalline CdTe were made by (i) increasing [Cd(II)] up to 200 mM, (ii) decreasing
  to 1.0 M, and/or (iii) raising pH to 12.50, keeping [Te(IV)] constant for all runs at 10 mM. It should be noted that all these approaches corresponded to make the domain of Te narrower. Figure 4 shows a part of the XRD patterns,
  of deposits obtained under various electrolytes. Compositions (mol % Cd) of the deposits determined by EPMA are also summarized in the figure.
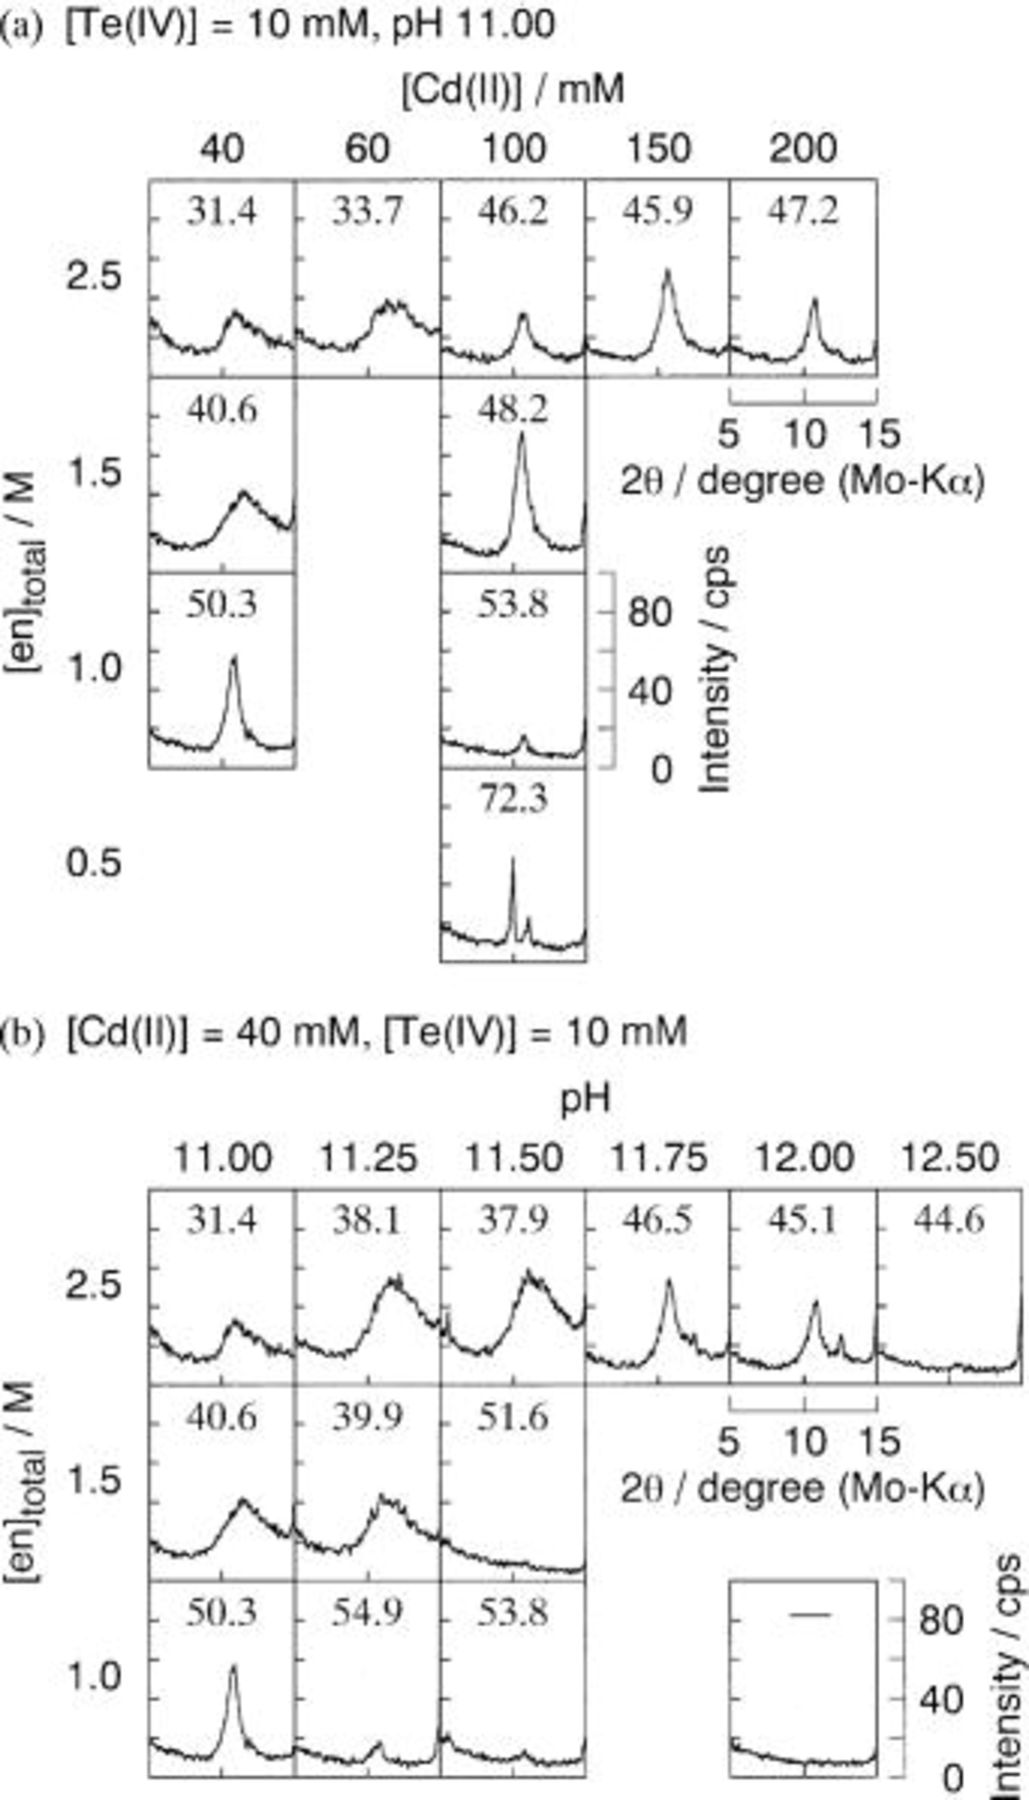
Figure 4. XRD and Cd content (mol %) of the deposits at 343 K from ethylenediamine baths summarized in Table I: (a) 

 pH 11.00 and (b)

 pH 11.00-12.50. Cathode potential was −0.70 V vs. SHE. Total quantity of charge was 1.5 C.
When the Cd(II) concentration increased from 40 mM (solution a1) to 200 mM (e1), the morphology was changed from amorphous with broad diffraction ranging 8-15° to crystalline with relatively sharp diffraction due to CdTe(111) peaking at  (Fig. 4a, the first row). At the same time, the cadmium content was increased from 31.4 mol % (a1) to 47.2 mol % (e1), but did not go up to or exceed stoichiometric composition, i.e., 50 mol % Cd, within the [Cd(II)] range investigated. In contrast, the cadmium content of deposits from ammoniacal electrolytes (pH 10.8,
  M,
M,  ), for example, could be varied from Te-rich (49.0 mol %) to Cd-rich (53.0 mol %), by changing [Cd(II)] from 40 to 100 mM.9 Therefore, [Cd(II)] concentration of the ethylenediamine solution here is not a decisive factor in providing stoichiometric CdTe.
The effect of ethylenediamine concentration was examined using electrolytes with [Cd(II)] of 40 mM (solutions a1-a3) and 100 mM (c1-c4) (Fig. 4a, the first and third columns). The cadmium contents of deposit in each case were increased with decreasing  Polycrystalline CdTe with compositions near stoichiometry were deposited from solutions a3 and c2. The deposit from solution c3 had a composition richer in Cd, i.e., 53.8 mol % Cd, and exhibited a relatively weak XRD peak due to CdTe(111), suggesting that the deposit belongs to the category of Cd-rich CdTe. Our recent study9 using ammoniacal baths revealed that a thinness of the CdTe electrodeposited at relatively low current efficiency less than 30% is responsible for such a weak XRD peak of Cd-rich CdTe. As clearly seen in the potential-pH diagram (Fig. 2a), a decrease in
  makes the domain of elemental Te narrower and the overpotential
  increases to approach
  Under such a condition, the adsorption of Cd(II) ion inhibits the deposition of Te atom not only on itself but also on previously deposited cadmium atoms, resulting in a small overall rate of CdTe deposition. An extreme case was the deposit from solution c4, exhibiting relatively sharp diffraction peaks at 2θ of 9.9 and 11.1°, which can be assigned to the (110) and (111) planes of
  intermetallic compound.20
21 In this case, CdTe deposition was thoroughly depressed and Cd(II) ions adsorbed on Au substrate underwent an underpotential reduction to form the Cd-Au intermetallic compound.
intermetallic compound.20
21 In this case, CdTe deposition was thoroughly depressed and Cd(II) ions adsorbed on Au substrate underwent an underpotential reduction to form the Cd-Au intermetallic compound.
The cadmium content of the deposit also increased with rising pH (Fig. 4b, the first row). However, it can be concluded here that increasing pH beyond 11.00 is not appropriate for deposition of single-phase polycrystalline CdTe with stoichiometric composition. Deposits from solutions D1 (pH 11.75) and E1 (pH 12.00) gave a diffraction from CdTe(111) at  but at the same time, a small diffraction peak due to (101) plane of elemental Te was recognized at
  This indicated that the deposits were not a single phase. Further, the deposit at pH 12.50 (solution F1) did not have sufficient thickness to provide a clear diffraction. In the cases
  and 1.0 M (solutions A2-C2 and A3-E3), only solution A3 with pH 11.00 provided near stoichiometric CdTe with a sharp CdTe(111) diffraction.
In consequence, the composition and morphology of the deposit from the ethylenediamine bath could be controlled by the Cd(II)/Te(IV) concentration ratio, pH, and concentration of ligand,  as already found for ammoniacal alkaline baths. Among these three variables, however,
  seemed to be the most reasonable factor affecting the composition and morphology of the resulting deposit. It is required that, in order to deposit stoichiometric CdTe, the concentration of the coordinating atom be low enough for ethylenediamine baths compared with that of ammoniacal baths, since bidentate ethylenediamine acts as a ligand stronger than monodentate ammonia due to the so-called chelate effect.
There was a tendency for the current density during each electrodeposition of Te-rich and Cd-rich CdTe to decrease monotonically with the elapse of time, while a sudden increase of the current at the beginning of electrodeposition was recognized during the deposition of the Te-rich amorphous phase. The initial current density decreased with (i) increasing Cd(II)/Te(IV) concentration ratio, (ii) rising pH, or (iii) decreasing the concentration of complexing agent, ethylenediamine. In most cases, the current density finally settled at 10-100 μA cm−2. These features regarding current density were completely the same as those recognized for ammoniacal baths.9
The deposits from ethylenediamine baths usually appeared as silver-gray (Te-rich amorphous), glossy blue-black (Te-rich CdTe), or interference-colored (Cd-rich CdTe); the interference color of the Cd-rich CdTe was due to the thinness (less than 1 μm) of the deposits as can be seen from the weak XRD intensity, while others had a thickness of 1-2 μm. Such a characteristic color dependent on the composition was also observed for the deposits from ammoniacal baths.9 It is possible to obtain thick CdTe deposits, if electrolysis is extended to longer times. Although we have not determined current efficiency for each deposit from ethylenediamine baths, it is reasonable to consider that the efficiency is at the same level as found for ammoniacal baths:9 >95% for Te-rich amorphous; 45-90% for Te-rich CdTe; 10-30% for and Cd-rich CdTe.
Deposition at higher temperature, 363 K
Since ethylenediamine is less volatile than ammonia, it is possible to electrodeposit CdTe at temperatures higher than 343 K (70°C). Potentiostatic electrodeposition at 363 K (90°C) was thus carried out and the resulting deposits were compared with those obtained at 343 K. Table II summarizes the ethylenediamine electrolytes employed for the deposition. Each electrolyte contains 10 mM Cd(II) and 10 mM Te(IV); the Cd(II) concentration and pH were lower than those summarized in Table I except for solutions with pH of 11.00 or 11.50, while the ethylenediamine concentration was reduced to 1.00-0.25 M instead, in order to deposit near stoichiometric CdTe.
Figure 5 summarizes the XRD patterns in the 2θ range 5-15° and the Cd contents of the resulting deposits. The sharp diffraction peak recognized occasionally at  is due to a Teflon adhesive, which could not be completely peeled off from the cathode surface before XRD measurement. As already found in Fig. 4b, there was a tendency for the Cd content of the deposit obtained at 343 K (Fig. 5a) to increase with rising pH and/or decreasing
  and that, at the same time, the morphology was changed from amorphous to polycrystalline. Electrolytes with relatively low pH and large
  e.g., solutions S1-W1 and S2-T2, provided typical Te-rich amorphous deposits with broad diffraction ranging from 8 to 15°, those with high pH and small
  e.g., Y1 and W2-W4, yielded Cd-rich CdTe deposits with very weak or almost no CdTe(111) diffraction, and those in between gave Te-rich crystalline CdTe deposits with clear CdTe(111) diffraction at
  In particular, solution T3 (pH 9.75,
  gave an intense Cd(111) diffraction, indicating that the Te-rich deposit was obtained with a high current efficiency.
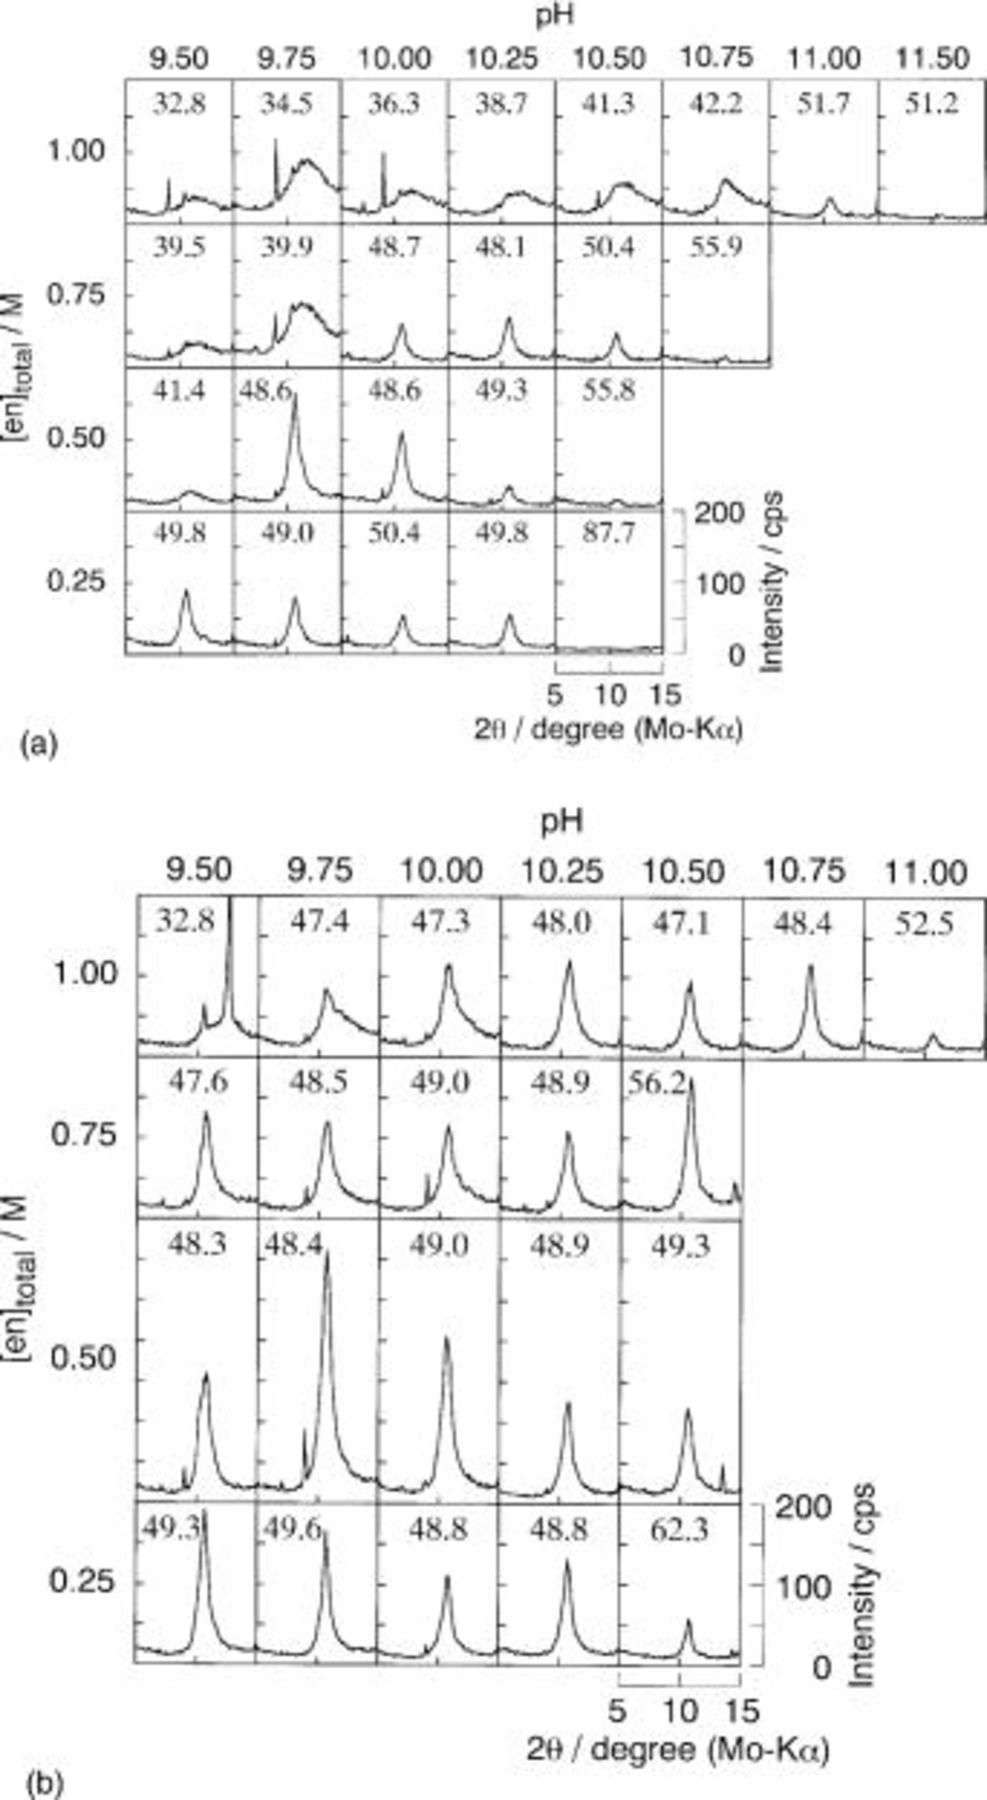
Figure 5. XRD and Cd content (mol %) of the deposits at (a) 343 K and (b) 363 K from ethylenediamine baths summarized in Table II: 

 M, pH 9.50-11.50. Cathode potential was −0.70 V vs. SHE. Total quantity of charge was 1.5 C.
In contrast, most of the electrolytes at 363 K gave deposits with relatively intense CdTe(111) diffraction. In many cases, the composition of resulting deposits could approach stoichiometric composition by rising the deposition temperature from 343 to 363 K. Electrolytes which provided Te-rich amorphous deposit at 343 K, e.g., solutions S1-W1, S2, T2, and S3, yielded more or less crystallized CdTe deposit at 363 K with Cd(111) XRD peak, except for solution S1 which gave a two-phased deposit with two diffractions due to CdTe(111) and Te(101). Electrolytes which provided polycrystalline Te-rich or Cd-rich CdTe deposits even at 343 K usually gave deposits with more intense CdTe(111) diffraction, compared to those at 343 K. Among them, the deposit from solution T3 gave the most intense CdTe(111) diffraction.
Since all the XRD measurements were performed under the same 2θ/θ arrangement, the integral intensity of the CdTe(111) peak corresponds to the thickness of deposits, unless the orientation of the deposits is varied by deposition conditions. Considering that the total quantity of charge passed during the electrodeposition was kept at 1.5 C for all runs, the rise of diffraction intensity of the CdTe(111) peak suggests an increase in current efficiency for the electrodeposition. Thus, it can be said that the current efficiency increased with rising deposition temperature. Current density during the deposition of Te-rich CdTe is usually in the order of 10-100 μA cm−2. For example, the current densities for solution T3 after ample time had elapsed settled to 40 and 100 μA cm−2 at 343 and 363 K, respectively. This suggests that, unlike the case of acidic baths,1
22 the deposition currents are not a mass transfer-limitation of the Cd(II) or Te(IV) ion, because the limiting current expected from the Cottrell's equation  under
under  for instance, is around 20-40 mA cm−2, given that the number of electrons n, the diffusion coefficient D, the concentration of ions C, and the thickness of diffusion layer δ are 2-4,
  10 μmol cm−3, and
  respectively. Since adsorption of Cd(II) is a fairly fast process, as mentioned above, the slowest step, i.e., the rate-determining step, of CdTe electrodeposition is deposition of Te through the Cd(II) layer adsorbed on the cathode surface or underpotential reduction of Cd on previously deposited Te to form CdTe. These steps during the electrodeposition of crystalline CdTe involve an incorporation of reduced atoms in the crystal lattice. The rate of the incorporation was promoted at higher deposition temperatures, e.g., 363 K, and, therefore, the overall rate of CdTe deposition was accelerated, resulting in the increases of thickness and current efficiency.
SEM photographs of CdTe deposited from solution T3 at 343 and 363 K are shown in Fig. 6. Both deposits had a granular structure with a diameter of about 1-2 μm, which was closely grown on the surface. However, the grain of the deposit at 363 K (Fig. 6b) appeared clearer and larger than that at 343 K (Fig. 6a); this coincides with the fact that the amount of deposit at 363 K was larger than that at 343 K. Such a granular structure was recognized for the Te-rich deposits from the ammoniacal bath. According to an observation using high resolution SEM, it turned out for the deposits from the ammoniacal bath that each grain is not a single crystal but an aggregate of small crystallite of diameter less than 100 nm.8 We have not yet observed the deposit from ethylenediamine baths by high resolution SEM, but it seems that the granular deposits as a similar aggregate.
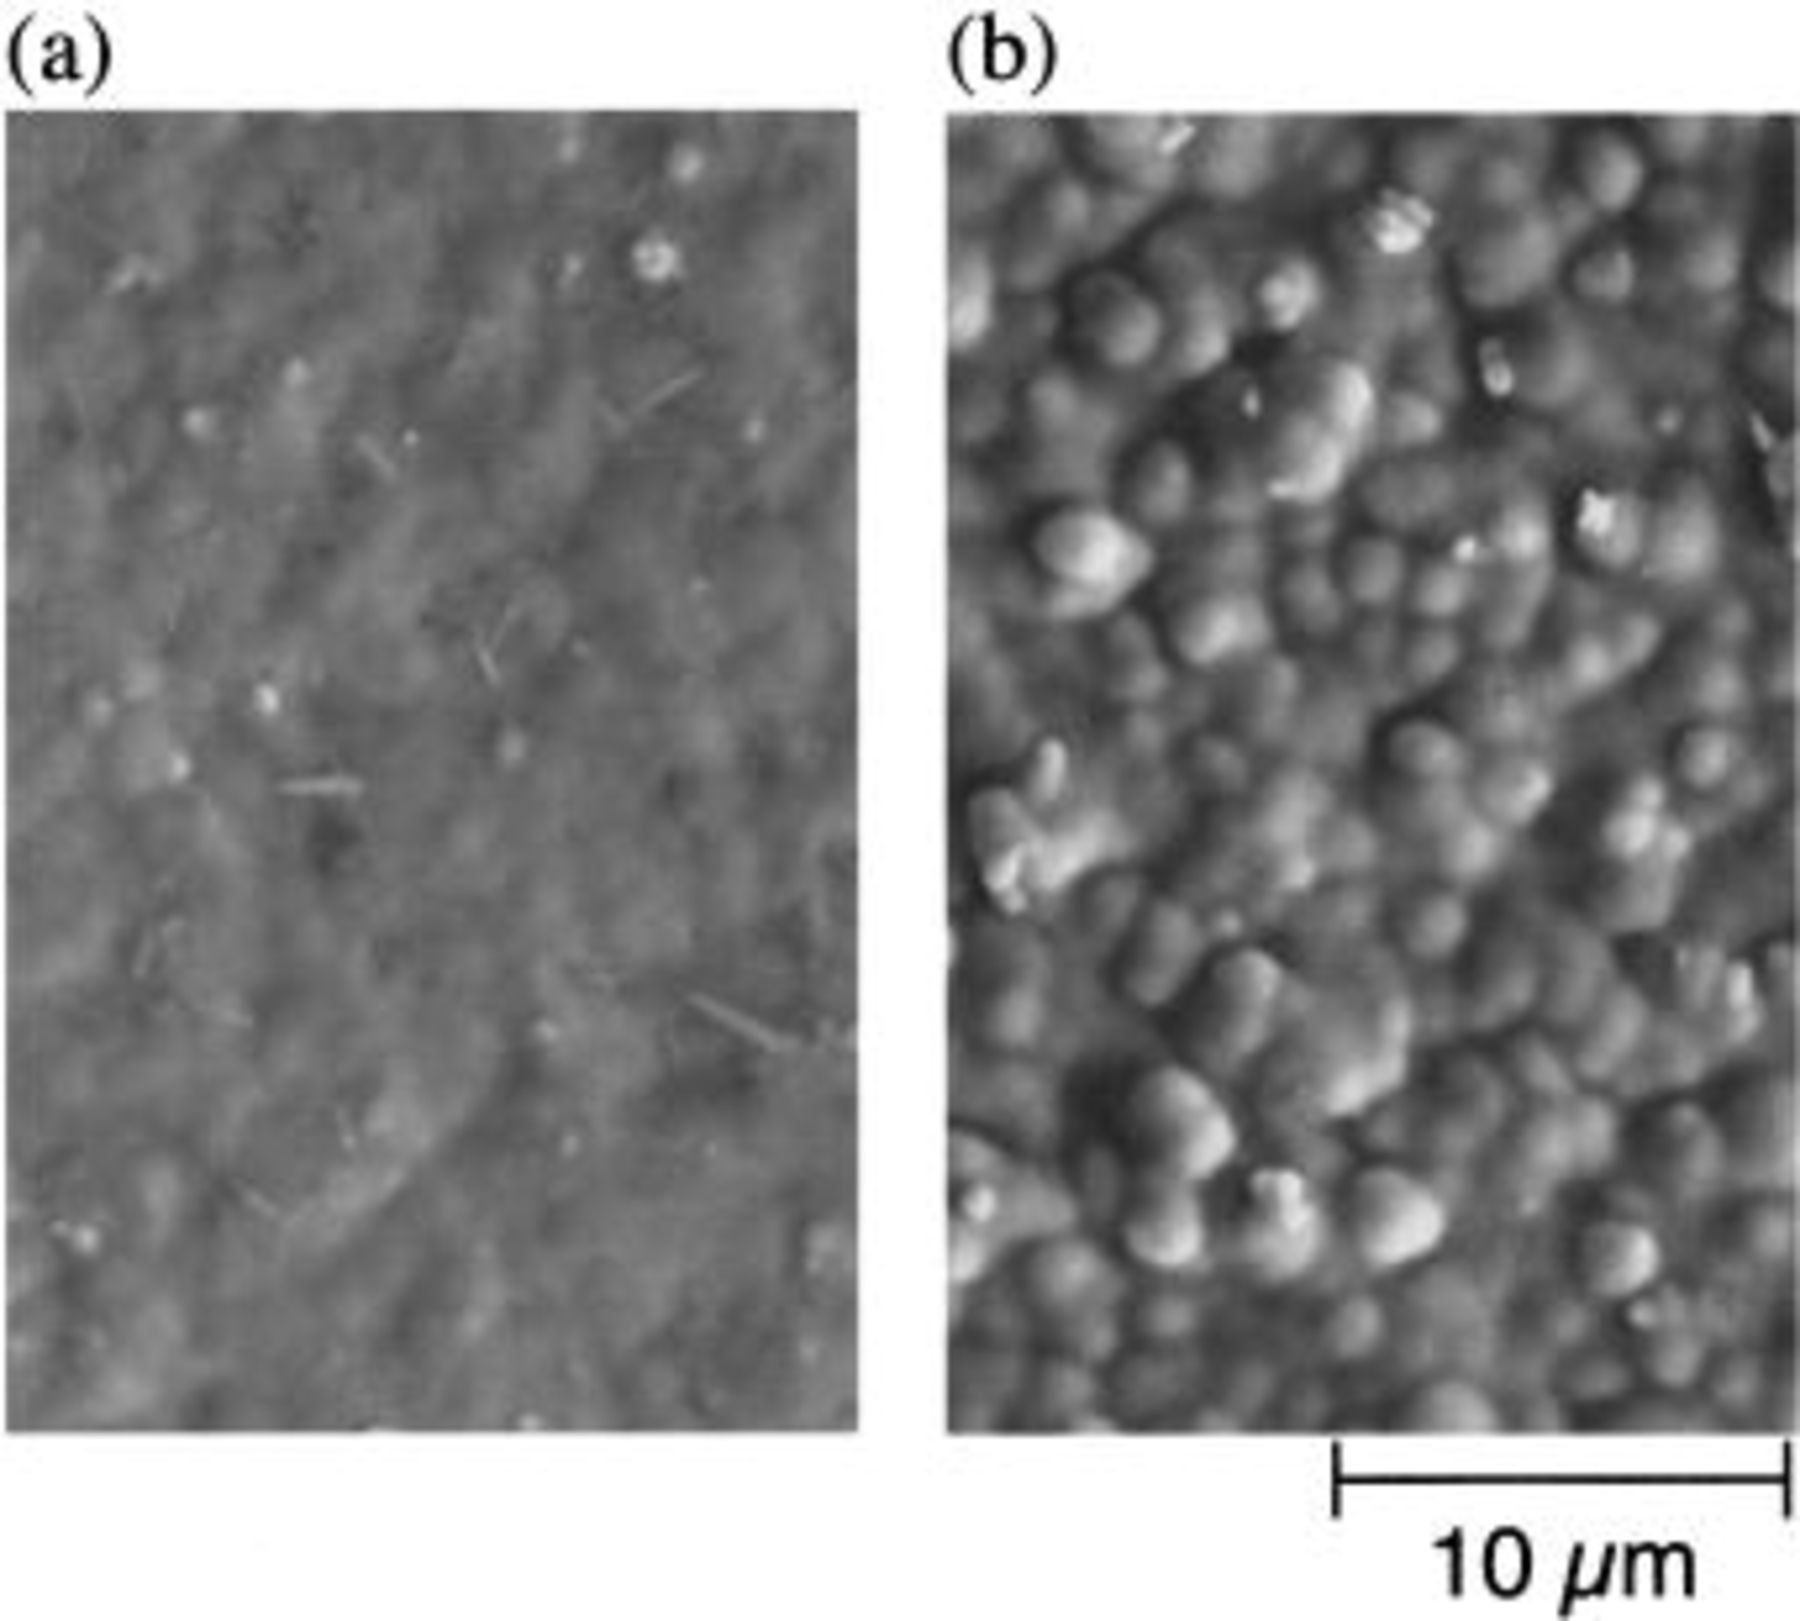
Figure 6. SEM micrographs of CdTe electrodeposited at (a) 343 K and (b) 363 K from ethylenediamine bath  M, pH 9.75) containing 10 mM Cd(II) and 10 mM Te(IV) (i.e., solution T3 in Table II).
Conclusion
Electrodeposition of CdTe from basic aqueous solution containing ethylenediamine as a ligand to  ion was studied. Based on the condition established for CdTe deposition from ammoniacal solution, the Cd(II)/Te(IV) concentration ratio, pH, and concentration of ethylenediamine of the electrolytic bath were optimized so as to electrodeposit CdTe with near stoichiometric composition. There was a tendency for the Cd content of the deposit from ethylenediamine baths to be lower than that from corresponding ammoniacal ones. Among the above three variables, decreasing the ethylenediamine content was the most effective factor in promoting the deposition of cadmium. To discuss the deposition behavior, which primarily follow the same trends as already found for ammoniacal baths, a potential-pH diagram of the
  system was constructed. The deposition behavior was then discussed on the basis of the elemental-Te domain, of which width corresponds to the difference in overpotentials of Te deposition,
  and Cd deposition on Te,
  under the mechanism of deposition of tellurium atoms followed by underpotential deposition of cadmium atoms to form CdTe. The use of ethylenediamine instead of ammonia rendered it possible to raise the temperature of electrolytic baths up to 363 K, resulting in a highly crystallized CdTe without any postdeposition treatments under relatively wide experimental conditions, i.e., pH and ethylenediamine content.
Acknowledgment
The present work was supported by a Grant-in-Aid for Scientific Research (no. 11750753) from the Ministry of Education, Science, Sports and Culture, Japan. The financial support of the Kurata Research Foundation is also acknowledged.
Kyoto University assisted in meeting the publication costs of this article.