

Abstract
High temperature 
 1.10;
1.10;  0.03, 0.06, and 0.10) phases were synthesized by solid-state chemistry. Their characterization by X-ray diffraction and galvanostatic measurements shows that 3% of Ni ions substituted for Co in the
  lattice suppress the two-phase domain, related to the semiconductor-to-metal transition, that is observed at the beginning of the charge process in
  These ions, trapped in the lattice, prevent the phase separation. On the other hand, more than 10% of Ni ions need to be substituted for Co in order to inhibit the monoclinic distortion due to a lithium/vacancy ordering in the interslab for
  Besides, a
  ratio
ratio  strictly higher than one in
  leads, as in the case of the unsubstituted
  phase, to the disappearance of all the phase transitions upon deintercalation.
  magic angle spinning nuclear magnetic resonance measurements show that
  ions are the only paramagnetic species in the
  phases while in the overlithiated
 phases,
  and intermediate spin
  are present. This suggests the existence of structural defects associated with O vacancies which are responsible for the suppression of the electronic delocalization and of the lithium/vacancy ordering upon lithium deintercalation. © 2002 The Electrochemical Society. All rights reserved.
Export citation and abstract BibTeX RIS
 is the most widely used positive electrode material in commercial Li-ion batteries.1
2 The high-temperature form of
is the most widely used positive electrode material in commercial Li-ion batteries.1
2 The high-temperature form of  crystallizes in the trigonal system (space group:
  with the ideal layered
  structure in which
  and
and  octahedra share their edges and are stacked alternately along the
  axis direction with an AB CA BC oxygen packing.3 Numerous investigations have reported the phase changes upon lithium deintercalation in
  with the existence of a two-phase domain for
  due to a macroscopic semiconductor-to-metal transition and the presence of a monoclinic distortion for
  due to the establishment of an interslab Li/vacancy ordering.1
4
5
6
7 However, since the earliest work, in an effort to improve its electrochemical performances, substitution of numerous metallic elements for cobalt has been attempted (Cr,8 Al,9
10 Mg,11
12 Fe,13 or Mn14
15). However, only the derivatives of the mixed
due to the establishment of an interslab Li/vacancy ordering.1
4
5
6
7 However, since the earliest work, in an effort to improve its electrochemical performances, substitution of numerous metallic elements for cobalt has been attempted (Cr,8 Al,9
10 Mg,11
12 Fe,13 or Mn14
15). However, only the derivatives of the mixed  oxide, for which a complete solid solution exists between the two end members
  and
and  seem to be an interesting candidate from the electrochemical point of view.5
16
17
seem to be an interesting candidate from the electrochemical point of view.5
16
17
In this context, in 1993 Reimers et al. studied the effect of Ni doping in  They showed that 2% of the nickel ions substituted for cobalt suppress the occurrence of the monoclinic distortion in
  concluding that phase transitions are very sensitive to impurity levels and could be used as a quality control check on the material.18 More recently, we observed that both phase transitions upon deintercalation can be suppressed as well in the unsubstituted lithium cobalt oxide by using nominal Li/Co ratios strictly higher than 1.0 in a high-temperature synthesis.19
In this general context, we performed a study on the combined effects of Ni doping and Li overstoichiometry in  We synthesized
 1.10;
1.10;  0.03, 0.06, and 0.10) materials and characterized them using X-ray diffraction (XRD), galvanostatic intercalation/deintercalation tests, and
  magic angle spinning nuclear magnetic resonance (MAS NMR) spectroscopy.
Experimental
The 
 1.10;
1.10;  0.03, 0.06, and 0.10) materials were prepared by calcination at 600°C under
  for 12 h of
  (Rho⁁ne Poulenc Rectapur % min 99),
  [calcination at 450°C for 12 h under
  of
of  Carlo Erba % min 99], and NiO (calcination at 450°C for 12 h under
  of
of  Carlo Erba % min 99);
  denotes the nominal
  ratio of the mixture; two compositions were considered in this study,
  and 1.10. Two successive heat-treatments at 900°C for 24 h with an intermediate grinding were done after the calcination.
Electrochemical measurements were carried out at room temperature (22°C) with  -propylene carbonate
  cells. The positive electrode consisted of a mixture of 88% by weight active material, 2% polytetrafluorethylene (PTFE), and 10% carbon black. The first series of cells, assembled in an argon-filled dry box, was charged at
 the second series, for long-range cycling, was cycled at
 C/20 rate). The
 deintercalated materials for XRD characterization were recovered in an argon-filled dry box, washed in dimethyl carbonate (DMC) and dried under vacuum.
The XRD patterns of the  starting materials were recorded using a Siemens D5000 powder diffractometer using the Cu Kα radiation and a graphite diffracted beam monochromator. Rietveld refinements were performed using the Fullprof program with a pseudo-Voigt fitting function.20 XRD patterns of the
 deintercalated materials were recorded on a Philips PW1820 powder diffractometer using the Cu Kα radiation, in a special airtight holder under argon atmosphere in order to prevent any reaction with air moisture.
 MAS NMR spectra were recorded on a Bruker MSL200 spectrometer at 77.7 MHz, with a standard 4 mm Bruker MAS probe. The samples were mixed with dry silica (typically 50% by weight), in order to facilitate the spinning and improve the field homogeneity, since they may exhibit metallic or paramagnetic properties. The mixture was placed into a 4 mm diam zirconia rotor in the dry box. Spinning speeds
  of 10 and 15 kHz were used. For all phases, a Hahn echo sequence
  was utilized in order to facilitate the phasing of all the signals and of their spinning side bands and to ensure the observation of possibly very wide signals which would be lost during the receiver dead time in single pulse experiments. The 90° pulse duration used
  was equal to 3.05 μs. In order to synchronize the spin echo with the first rotational echo,
  was fixed to the rotor period
  With such a Hahn echo sequence, phasing can be done easily, with only zero order correction if required, and no baseline correction is needed. A 200 kHz spectral width was used, and the recycle time
  is long enough to avoid
  saturation effects. The isotropic shifts reported in parts per million are relative to an external sample of 1 M LiCl solution in water.
Since the purpose of this study is to emphasize the combined effect of Ni doping and Li overstoichiometry on the properties of  phases, all the results reported in this work were obtained for the same batch for each
  material. Furthermore, in order to control the reproducibility of the experimental results, two different batches of each material were characterized.
Results and Discussion
X-ray diffraction study. Rietveld refinements.—
All the starting  materials were characterized by XRD. In all cases, pure phases are obtained without any trace of synthesis reactants or parasitic phases. All materials exhibit narrow diffraction lines whatever the percentage of nickel ions in the structure. They crystallize in the trigonal system (space group:
  , with the ideal
  layered structure of
  Since the XRD patterns are very similar and close to those reported in the literature for the
  system,5
16
17
21 only that of the
system,5
16
17
21 only that of the  material is shown in Fig. 1.
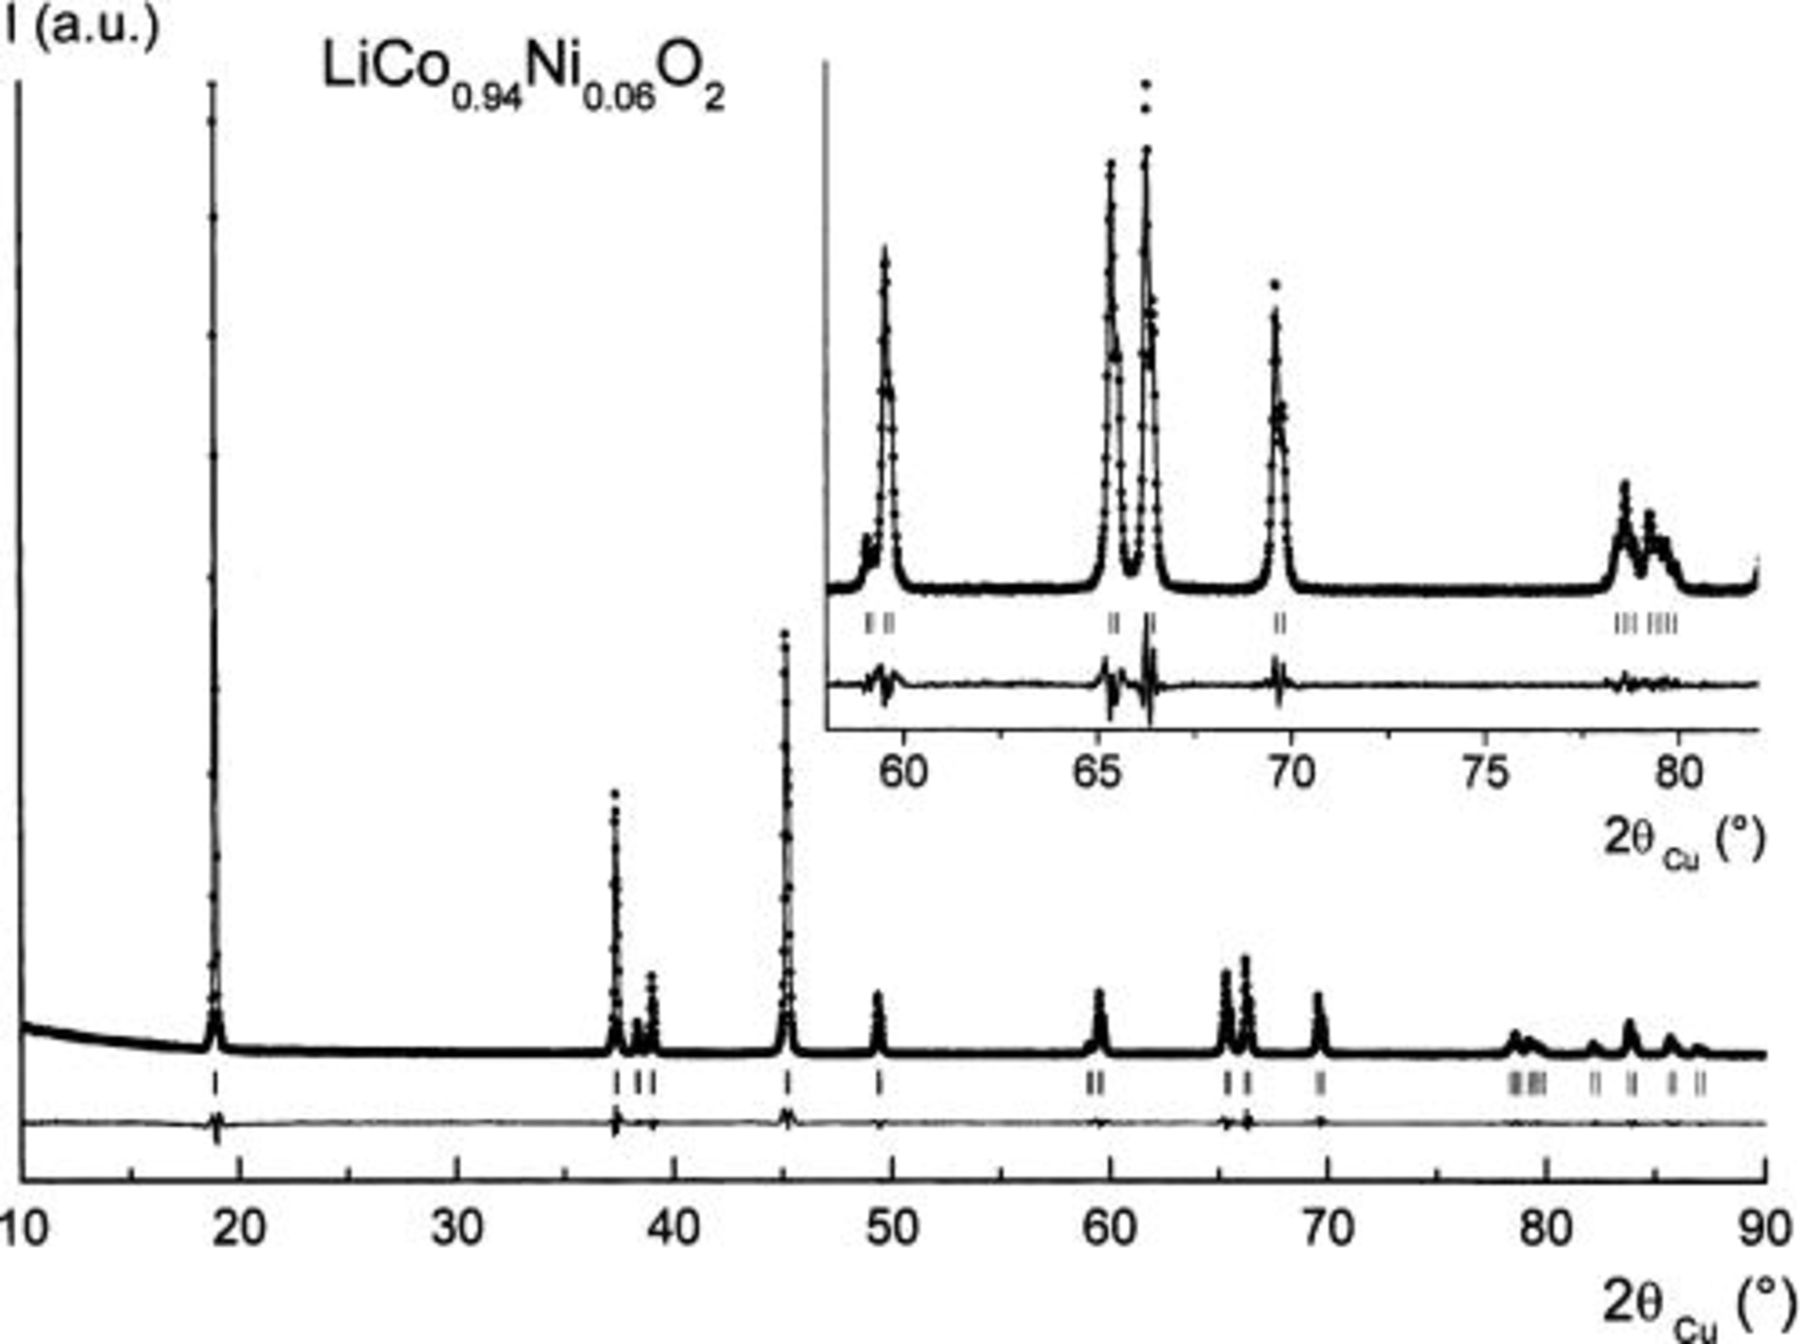
Figure 1. Observed and calculated XRD profiles for  filled circles: observed; solid line, calculated; lower trace, difference plot; bars, reflections.
All the  samples were characterized by Rietveld refinement of powder XRD data. As the morphology of the crystallites could influence the line intensity ratios on diffraction patterns, all the Rietveld samples were prepared in such a way that preferred orientation was minimized.22 The refinement was led, in a first step, using a strictly 2D model. Global occupancies for the 3a
  3b (Li), and 6c (O) sites were fixed to 1.0. Due to Co absorption, the release of the occupancy values of the 3a and 3b sites always leads to a decrease of the Co/Ni (3a) site occupancy, no significant change in the occupancy value for the Li 3b site being observed. The results are presented in Table I for the
  phase and are in agreement with the structural data reported for pure
 phases by Rougier et al.21 In our
  phases, the hypothesis of a fraction of Co and/or Ni ions in the lithium 3b site is rejected since the fits invariably lead to a negative occupancy. However, due to the impossibility of quantifying Co absorption in the Bragg-Brentano geometry, no conclusion could be drawn about the presence of Li ions in the 3a crystallographic site of Co/Ni. Nevertheless, in agreement with the previous neutron diffraction studies on pure
  one can consider the amount of
  ions in the Co/Ni 3a site as negligible.3
19 The very good fitting of the profile of the XRD lines and the small intensity of the line in the difference pattern emphasize the quality of the Rietveld refinement.
ions in the Co/Ni 3a site as negligible.3
19 The very good fitting of the profile of the XRD lines and the small intensity of the line in the difference pattern emphasize the quality of the Rietveld refinement.
Table I.
Rietveld refinement of the  XRD spectrum. XRD spectrum. | ||||||
|---|---|---|---|---|---|---|

| ||||||
| Wyckoff positions | ||||||
| Atom | Site |
 |
 |

| Occupancy |
 |
| Li(1) | 3b | 0 | 0 | 1/2 | 1.0 |
 |
| Co(1) | 3a | 0 | 0 | 0 | 0.94 |
 |
| Ni(1) | 3a | 0 | 0 | 0 | 0.06 |
 |
| O | 6c | 0 | 0 |
 | 1.0 | 0.05(16) |
Profile function: pseudo-Voigt       
| ||||||
Conventional Rietveld factors:    14 refined parameters. 14 refined parameters. | ||||||
The standard deviations were multiplied by the Scor parameter  to correct for local correlations. to correct for local correlations. | ||||||
The structural parameters of the various  materials are presented in Table II. Both the
  and the
  parameters increase smoothly with Ni doping due to the difference in size between the trivalent nickel and cobalt ions
 23). Furthermore, in all materials, the
  ratio close to five
  for a cubic lattice) confirms the 2D character of the structure of the Ni-doped
  phases,21
24 in good agreement with the high and constant value of the oxygen
phases,21
24 in good agreement with the high and constant value of the oxygen  position
  and the consequent difference in the slab
  and interslab space
  thicknesses
  for
for  phases).25
Table II.
Hexagonal cell parameters and oxygen  position from refinement of XRD patterns for the various position from refinement of XRD patterns for the various  phases. phases. | ||||
|---|---|---|---|---|
| Sample |
 (Å) (Å) |
 (Å) (Å) |
 a
a |
 |
 b
b | 2.81506(16) | 14.0516(8) | 0.2603(4) | 4.99 |
 | 2.8177(1) | 14.056(1) | 0.2582(9) | 4.99 |
 | 2.8176(2) | 14.062(1) | 0.2597(5) | 4.99 |
 | 2.8182(2) | 14.067(1) | 0.2584(9) | 4.99 |
 b
b | 2.81605(18) | 14.0511(8) | 0.2593(6) | 4.99 |
 | 2.8172(1) | 14.058(1) | 0.2597(7) | 4.99 |
a 6c oxygen  position. position. | ||||
| b Ref. 19. | ||||
Electrochemical Study
Lithium-stoichiometric  phases (y0.0, 0.03, 0.06, and 0.10).—

Figure 2 shows the first galvanostatic charge curve of  cells
cells 
 0.03, 0.06, and 0.10) at low rate
 C/160 rate (160 h are required to exchange one equivalent of electron)].
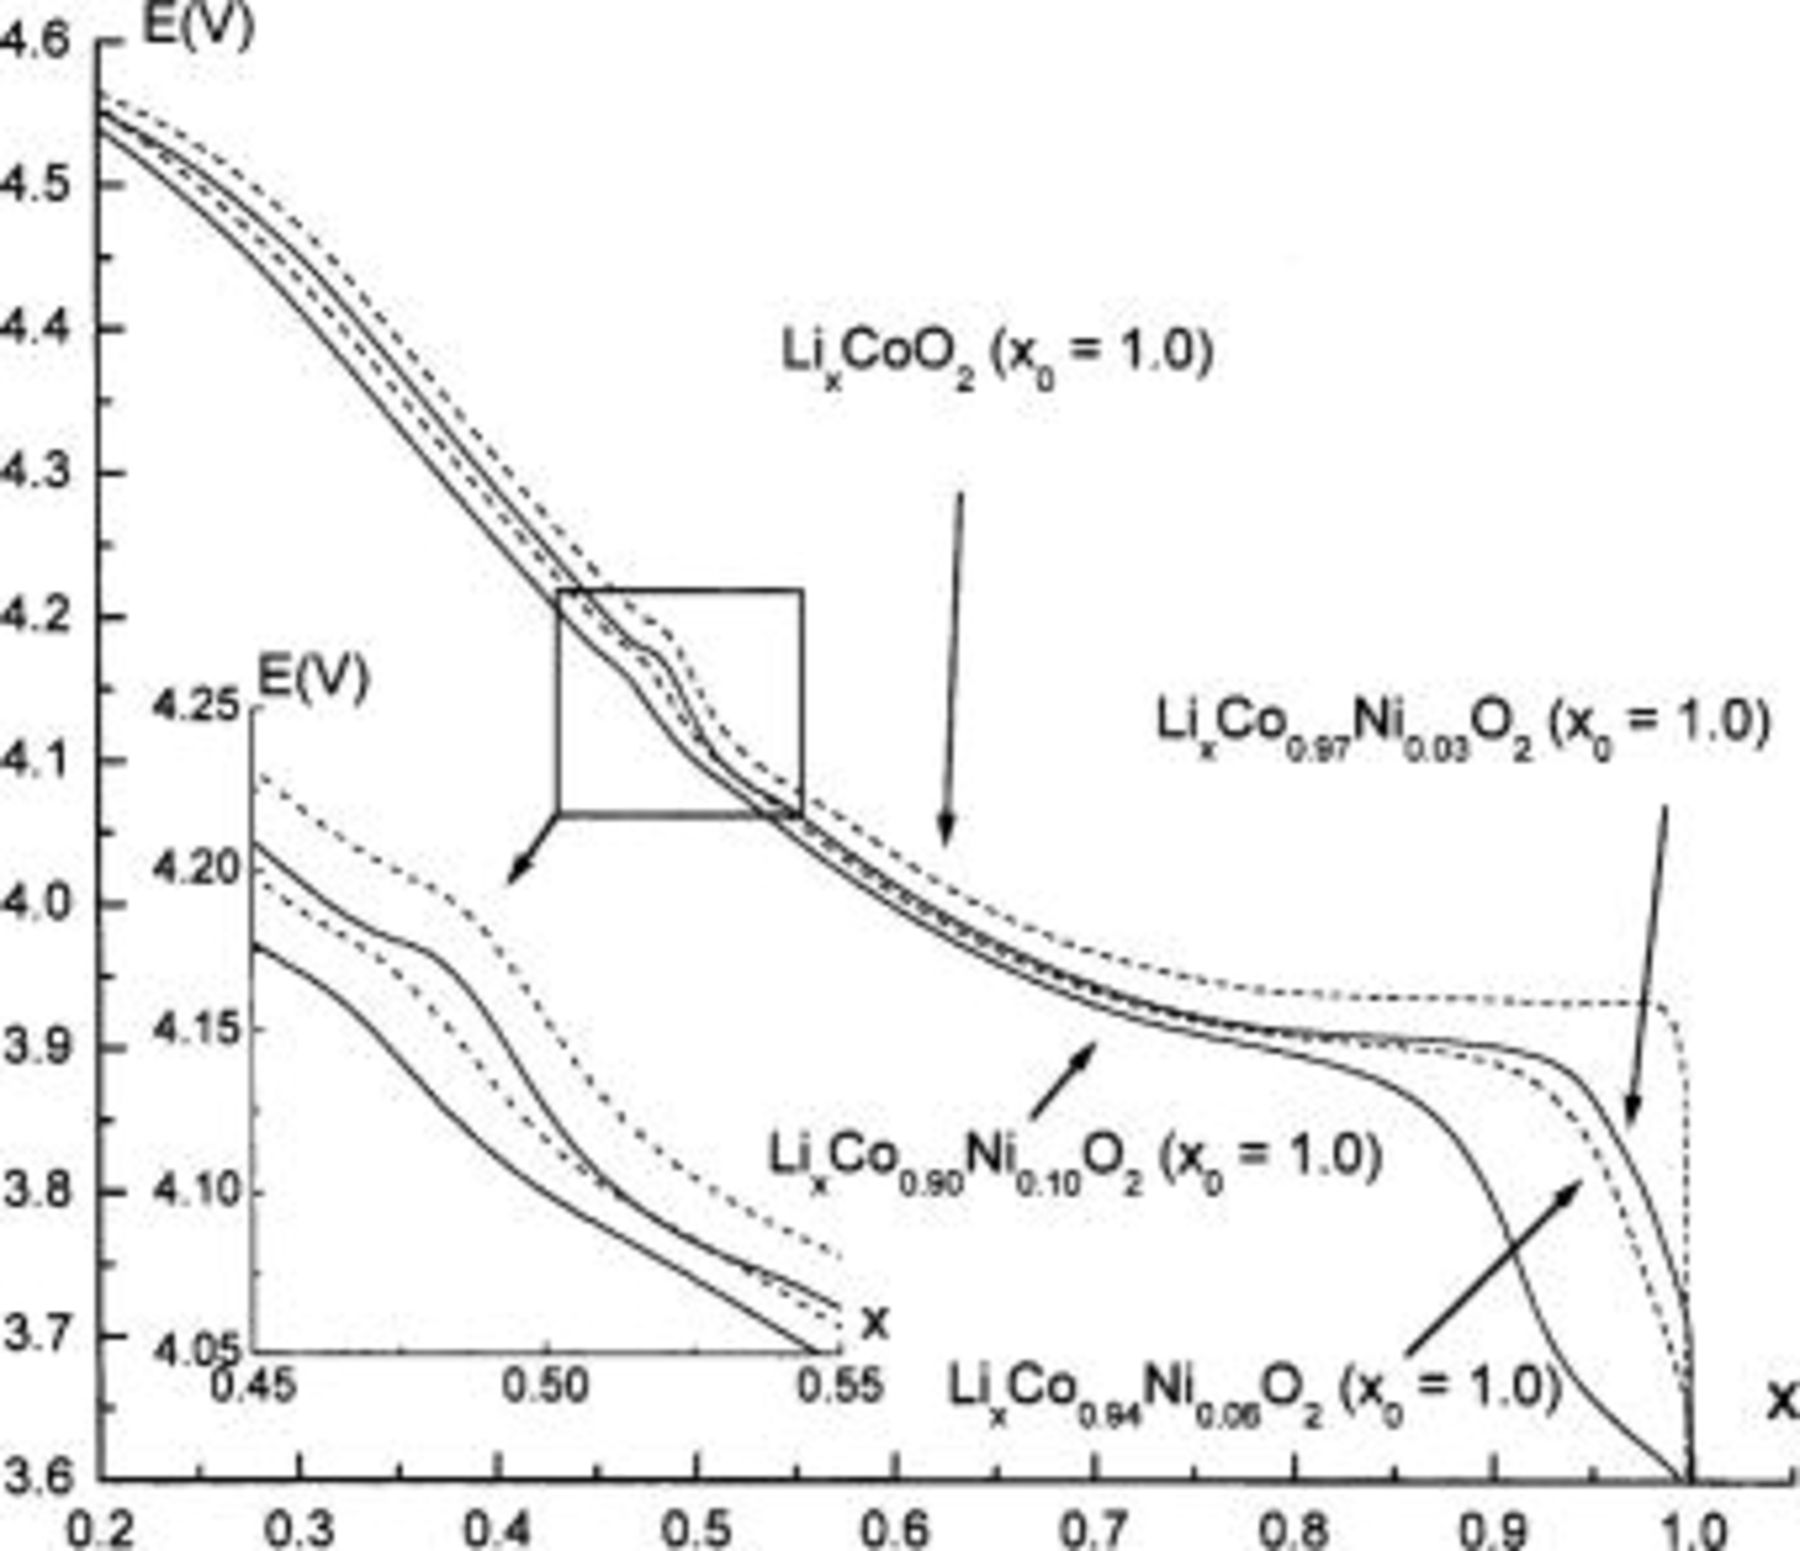
Figure 2. First galvanostatic charge of 

 0.03, 0.06, and 0.10) electrochemical cells
 .
.
As already reported, the charge curve obtained with the pure 
 material exhibits both the voltage plateau at ca. 3.93 V corresponding to the biphasic domain for
  due to a semiconductor-to-metal transition and the particular feature associated to the monoclinic distortion expected for
  due to the interslab lithium/vacancy ordering.4
7
due to the interslab lithium/vacancy ordering.4
7
A quite different behavior is observed for the Ni-doped materials. In the first part of the oxidation of the 
 phases, the preferential oxidation of Ni ions compared to Co ones leads to the appearance of a lower potential step, all the more pronounced when the nickel amount increases. This difference in potential is due to the lower oxidizing power of the
  redox couple compared to the
  one.17
26 Moreover, the voltage plateau at the beginning of the charge process is less marked for the Ni-doped materials, even with only 3% of the doping element in the
one.17
26 Moreover, the voltage plateau at the beginning of the charge process is less marked for the Ni-doped materials, even with only 3% of the doping element in the  lattice, suggesting that the two-phase domain does not exist anymore in these materials. This is fully confirmed by the XRD patterns of electrochemically deintercalated
  materials; as shown in Fig. 3 and 4, a solid solution is obtained for
  in the
 system. One can see in Fig. 2 that the monoclinic distortion for
  exists in all the
 0.03, 0.06, and 0.10) systems studied here. This result conflicts with the conclusion by Reimers et al. who showed in a former study that 2% of the Ni ions substituted for cobalt are sufficient to suppress the monoclinic distortion at room temperature.18 Besides, one can see on the inset of Fig. 2 that this order/disorder transition tends to disappear for Ni contents higher than 10%.
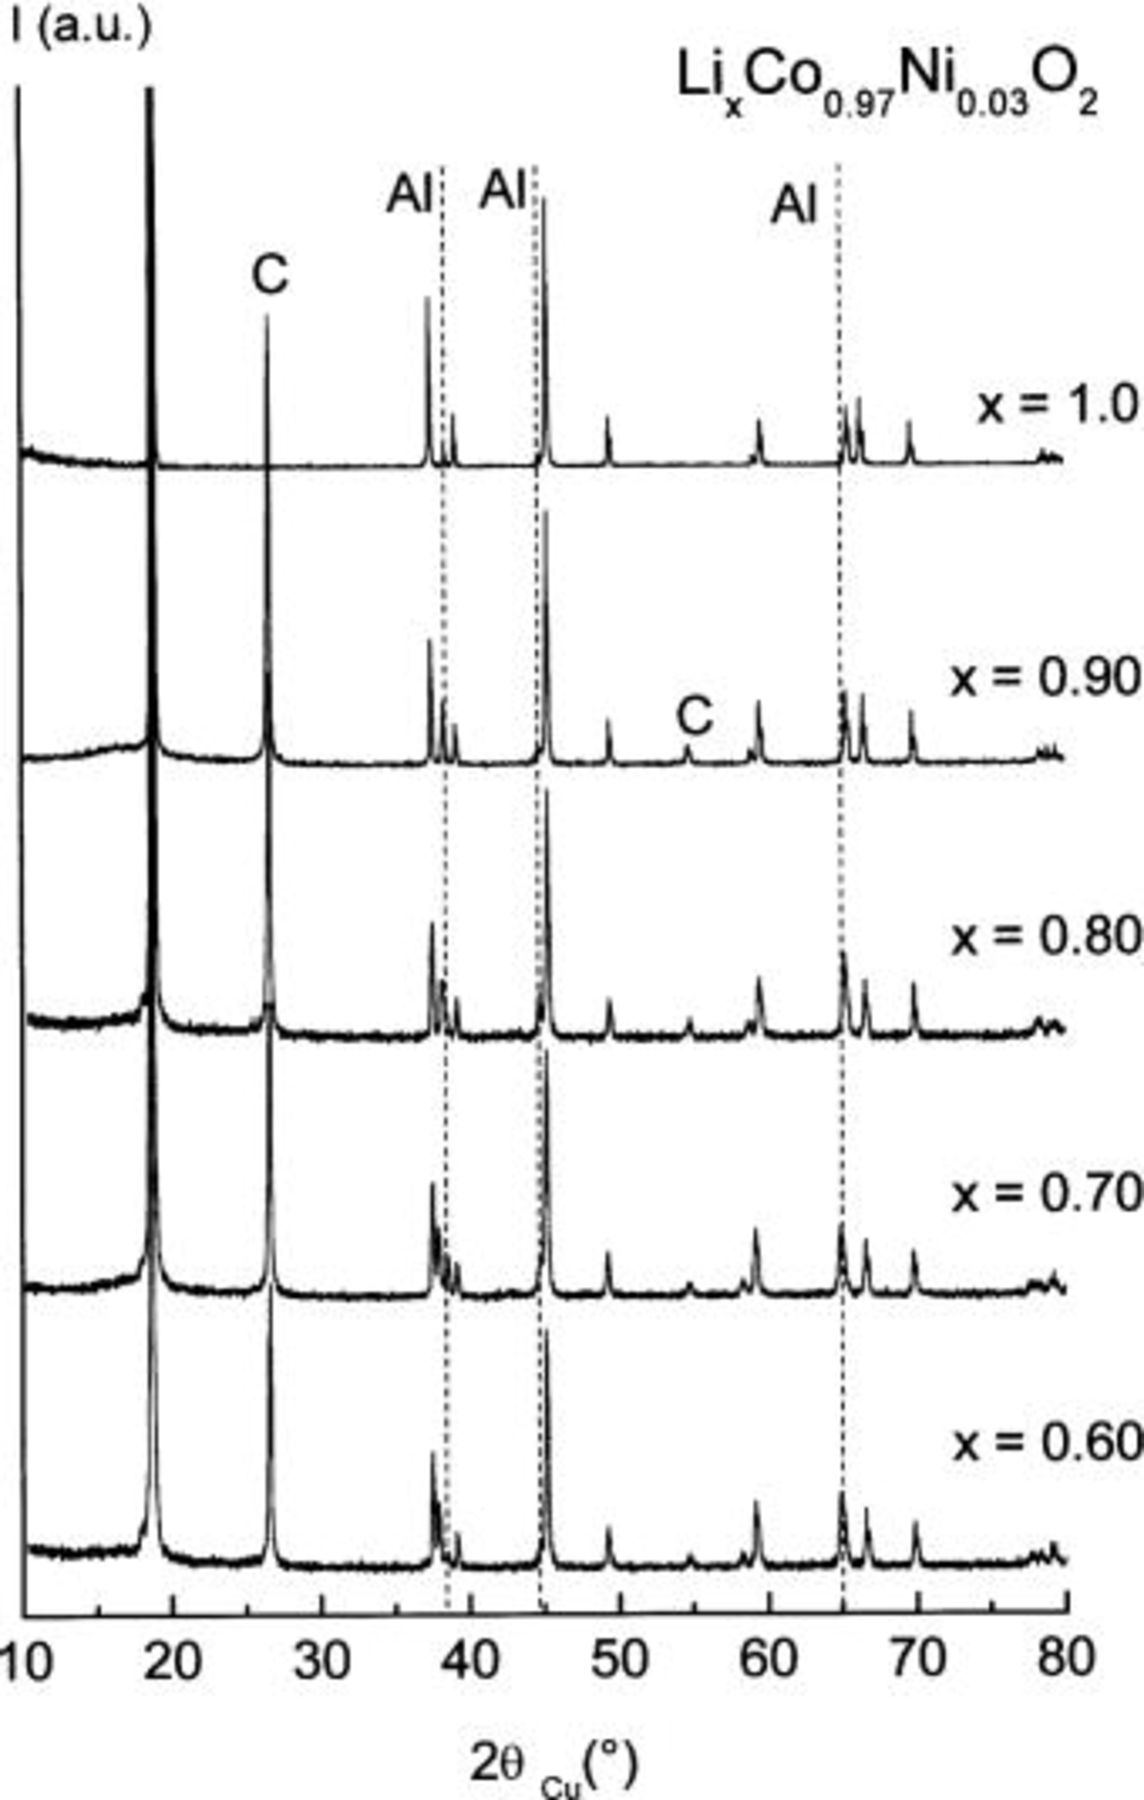
Figure 3. XRD patterns of the electrochemically deintercalated 
 samples
  .
.
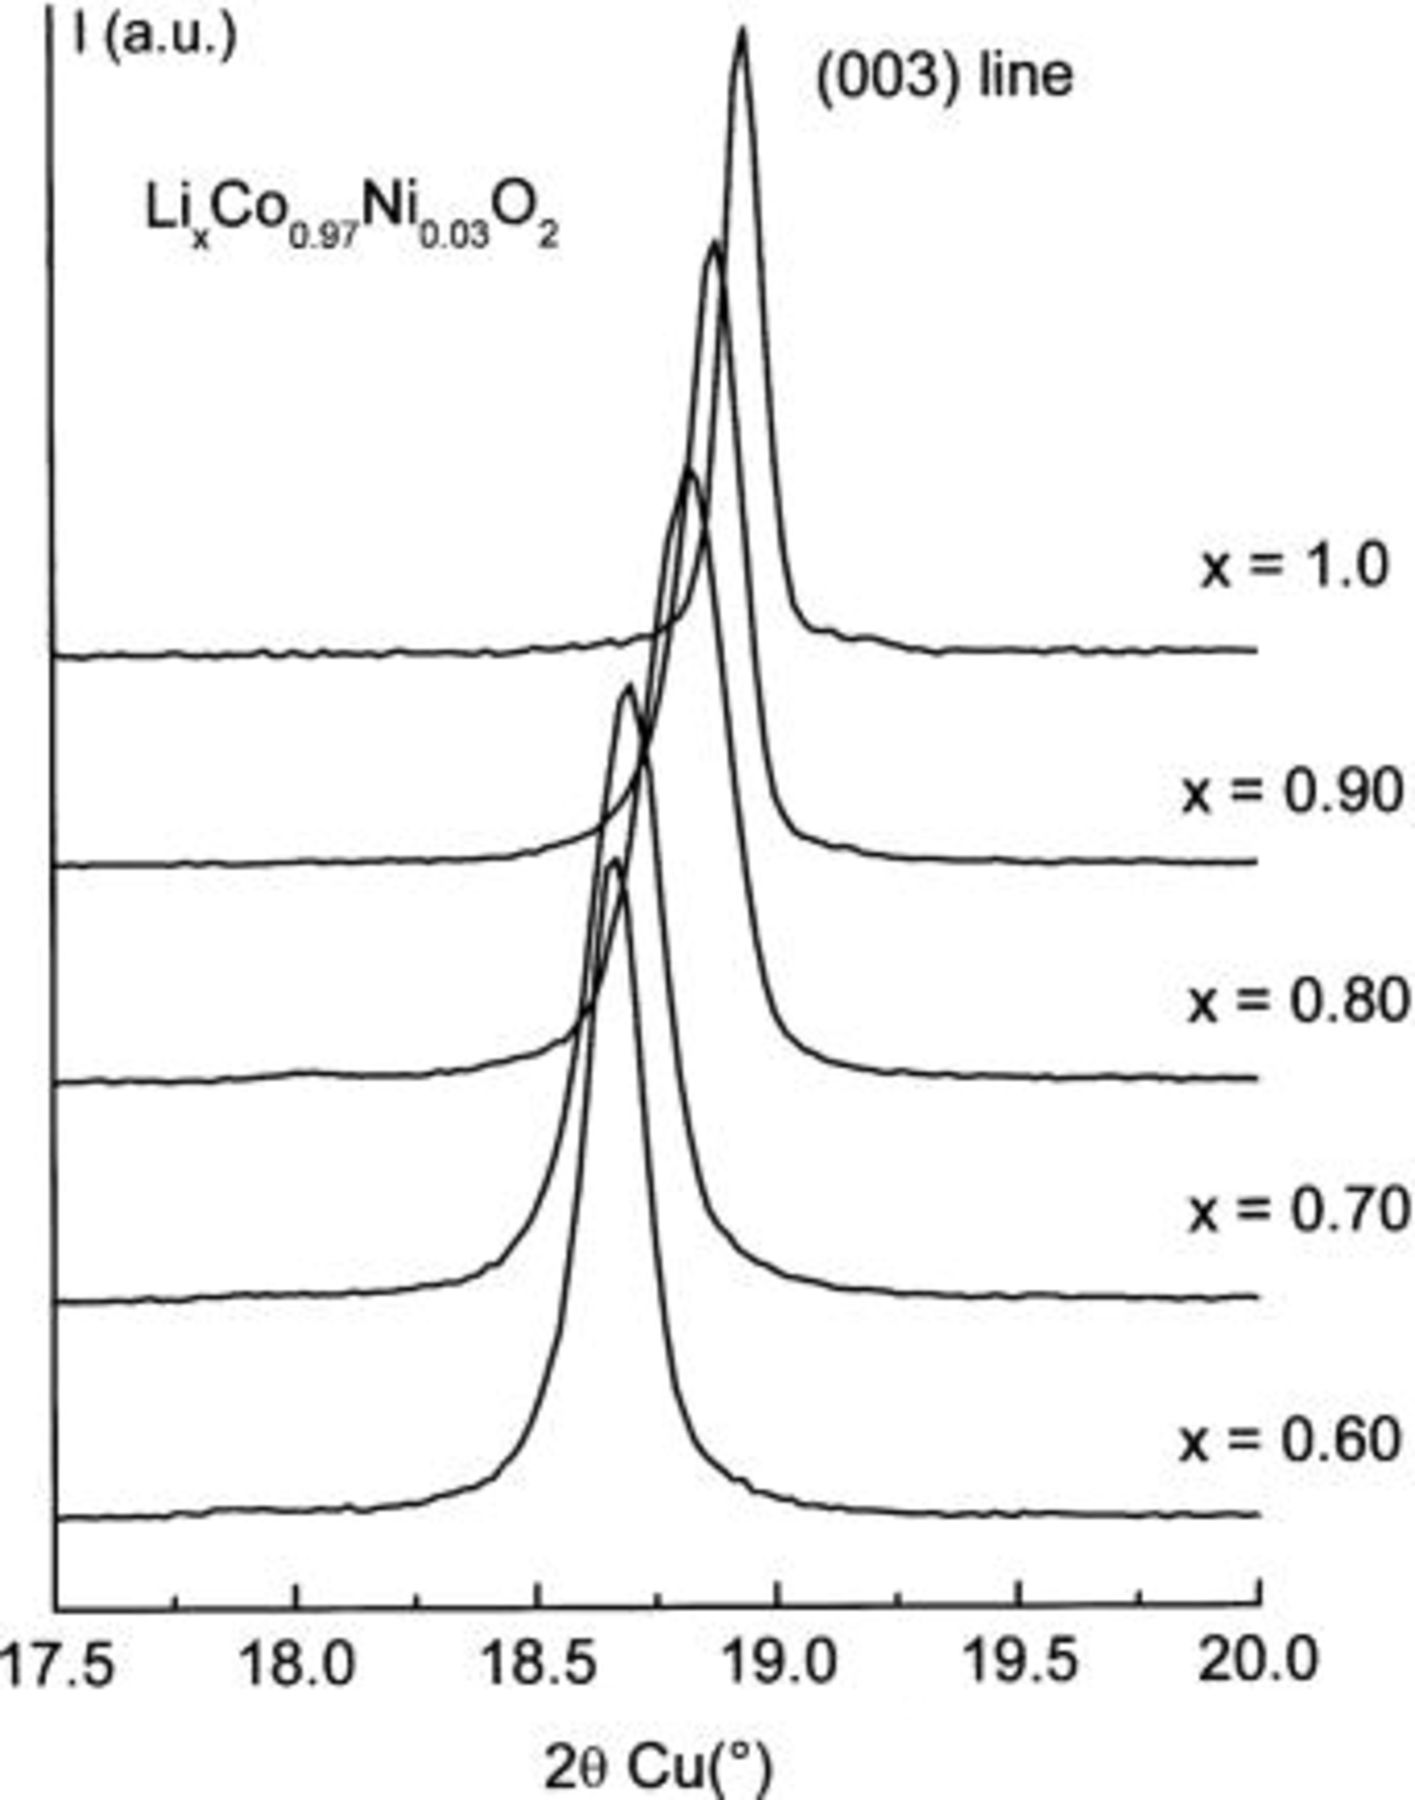
Figure 4. Expansion of the (003) Bragg reflection of the XRD patterns of the electrochemically deintercalated 
 samples
  .
.
Lithium overstoichiometric phases (y0.0 and 0.03).—

Contrary to the case of the Li stoichiometric materials, as shown in Fig. 5, the first galvanostatic charge curves of  cells
cells 
 and 0.03) at a low rate
 C/180 charging rate) have a quite similar profile, whatever the value of
  The feature corresponding to the monoclinic distortion for
  and the voltage plateau at the beginning of the charge have disappeared both for the Ni-doped and for the pure
  phases. The unidirectional increase of the potential during lithium deintercalation suggests the occurrence of a monophasic reaction throughout the charge process for the
  materials. An XRD study of electrochemically deintercalated
 materials carried out in a former work had confirmed such an observation.19 The same behavior is expected for the
  system, although no XRD characterization was performed on deintercalated materials.
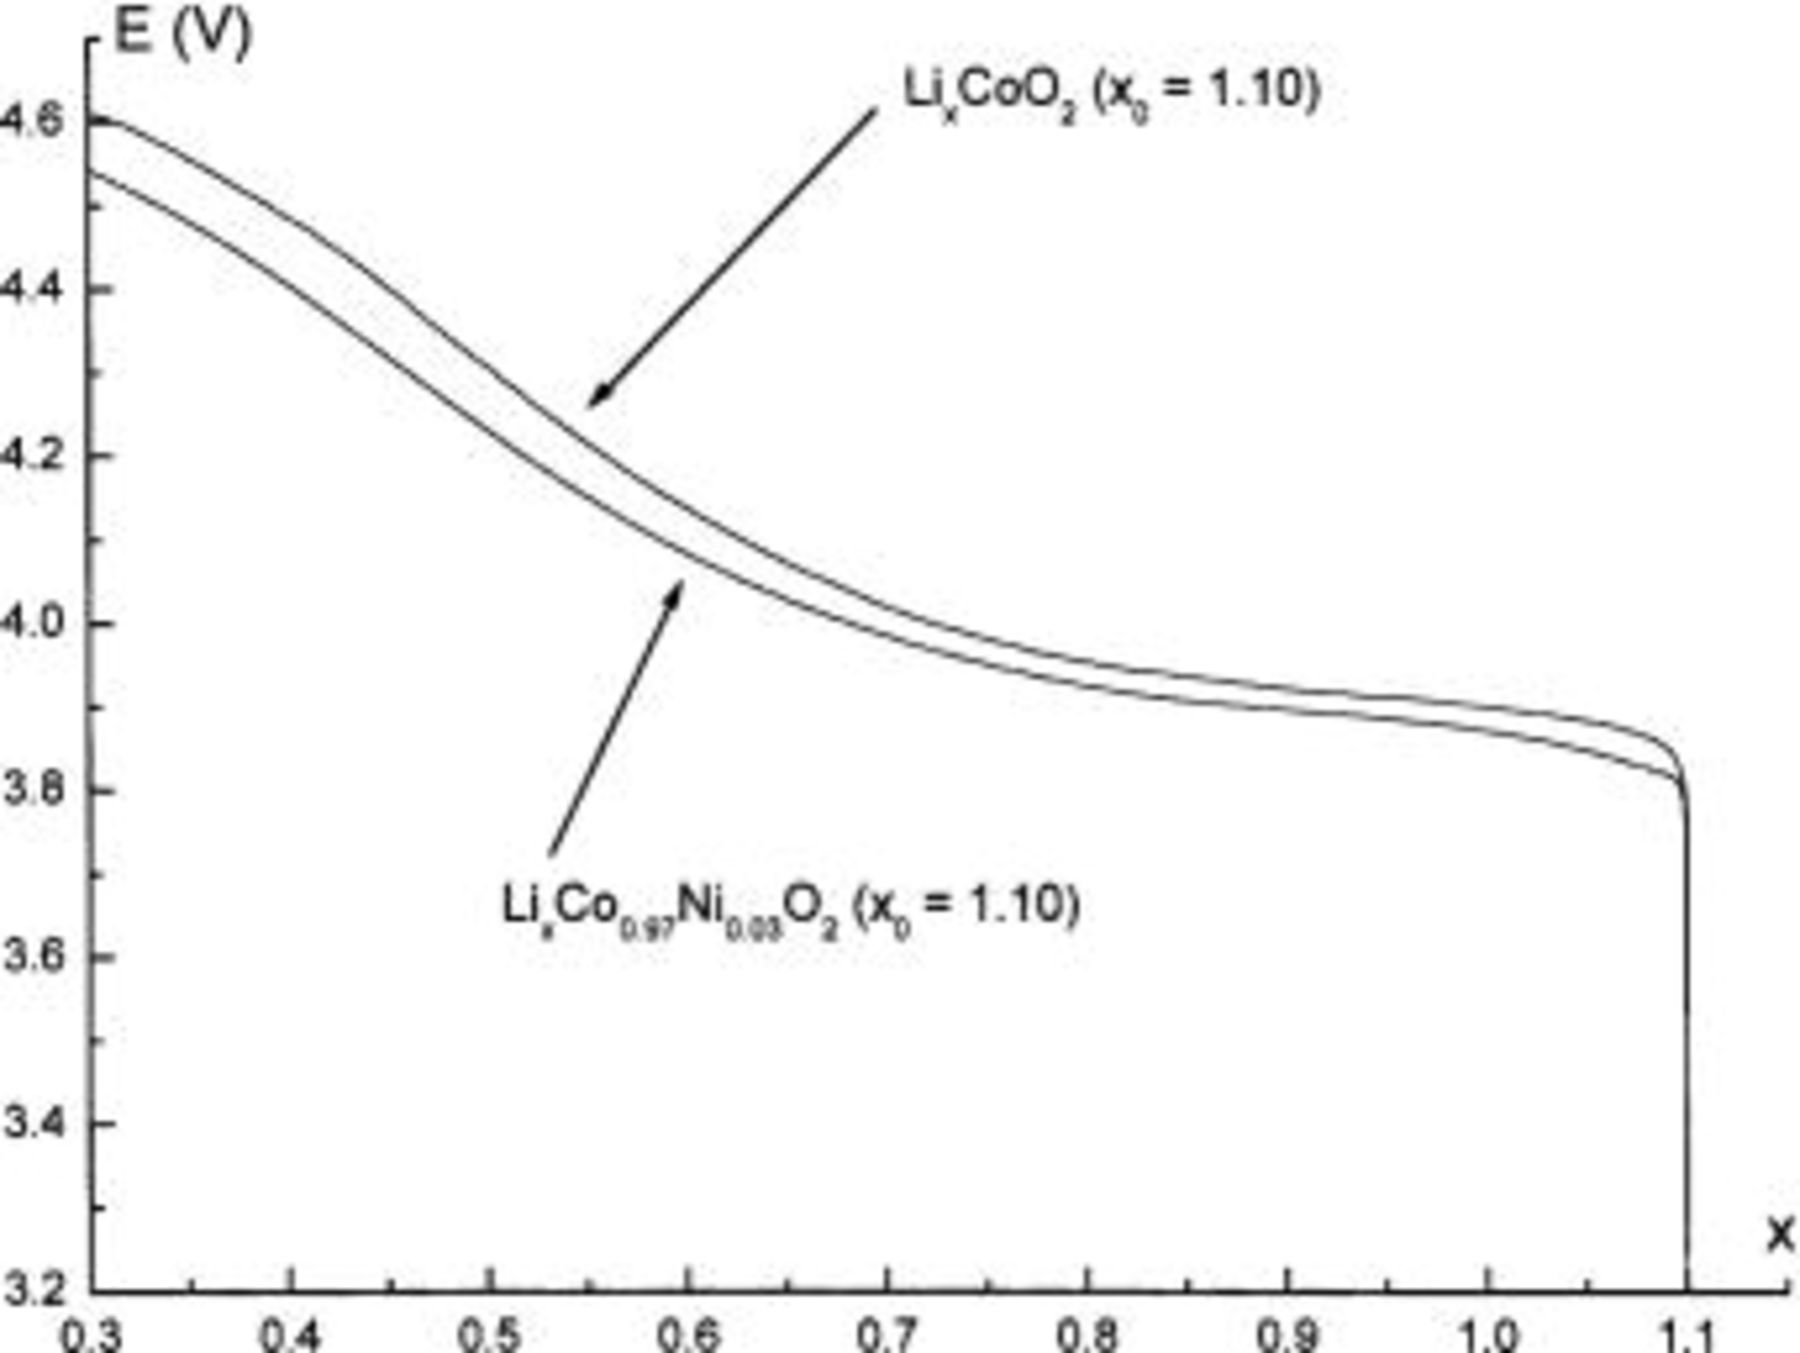
Figure 5. First galvanostatic charge of 

 0.03) electrochemical cells
 .
.
Cycling tests.—

 1.10;
1.10;  0.03, 0.06, and 0.10) cells were cycled between 2.7 and 4.15 V at
  (C/20 rate) as shown in Fig. 6. The reversible capacity for the first and tenth cycle is also indicated on the figure. The purpose of this study is to characterize the structural transitions and not to obtain large reversible capacities, a relatively low high-voltage cutoff was used.
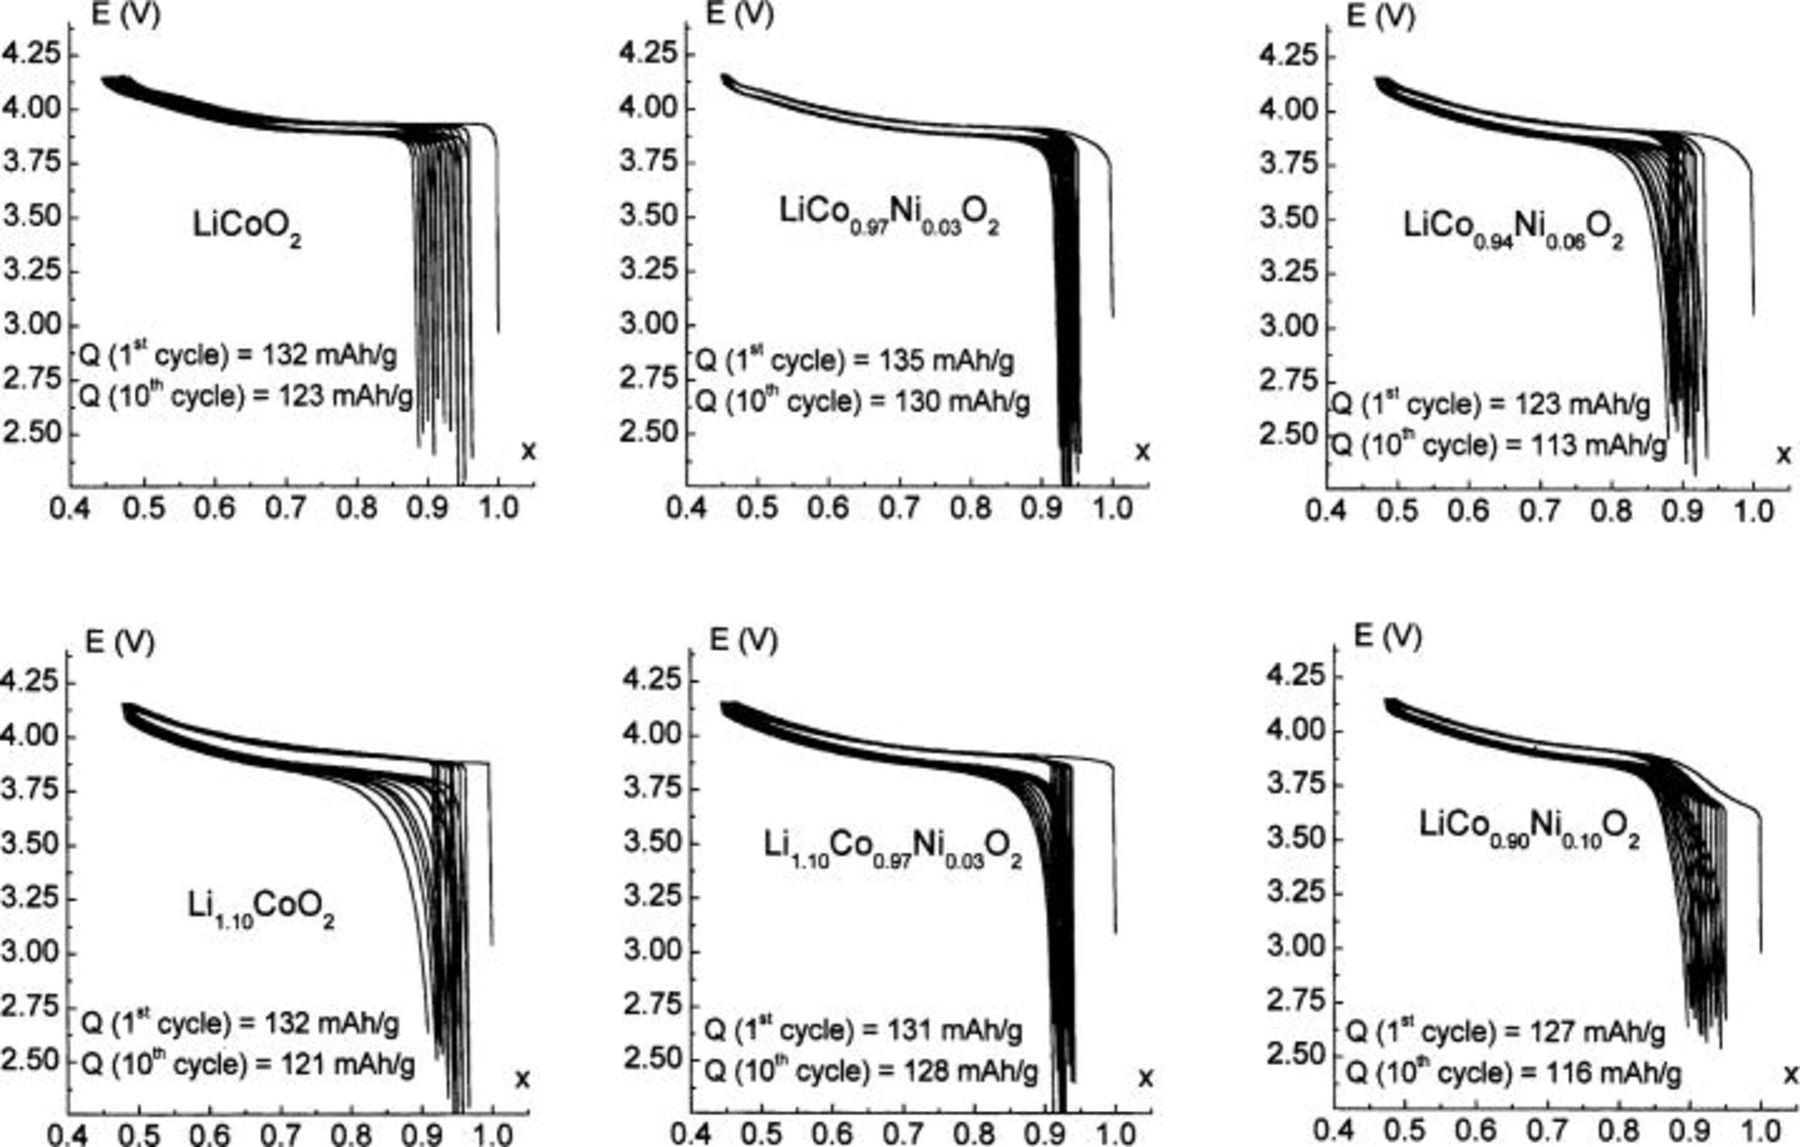
Figure 6. Cycling behavior of the various 
 1.10;
1.10;  0.03, 0.06, and 0.10) electrochemical cells
 C/20 rate) between 2.7 and 4.15 V.
As already reported elsewhere, the cycling behavior of the Co-rich  phases is very satisfactory and close to that of pure
  16
24 The cycling curves, on Fig. 6, show that the reversibility of the deintercalation/intercalation process is good, as the reversible capacities for the first and tenth cycles, shown in Fig. 6, are quite high in the voltage window used. Note that the slight decrease in potential caused by 3% doping of Ni leads to a particularly good cycling capacity for the cutoff voltage used (4.15 V). Furthermore, one can note that polarization is very small in all cases and that the irreversible capacity at the first cycle is especially low compared to that of the
16
24 The cycling curves, on Fig. 6, show that the reversibility of the deintercalation/intercalation process is good, as the reversible capacities for the first and tenth cycles, shown in Fig. 6, are quite high in the voltage window used. Note that the slight decrease in potential caused by 3% doping of Ni leads to a particularly good cycling capacity for the cutoff voltage used (4.15 V). Furthermore, one can note that polarization is very small in all cases and that the irreversible capacity at the first cycle is especially low compared to that of the  -type compounds.27
The derivative curves  of the first and tenth cycles of the
  cells presented just above are reported in Fig. 7. One can note the peak at the lower potential due to the preferential oxidation of
  ions compared to
  ones at the beginning of the charging process. Furthermore, as already evidenced from the slow rate charging curves (Fig. 2), the trace of the monoclinic distortion around 4.15 V is easily observable in all the cycling curves from the Li stoichiometric
  phases and still exists after ten cycles, confirming the persistence of an order/disorder transition for
  in these materials. On the contrary, it does not appear for lithium overstoichiometric materials.
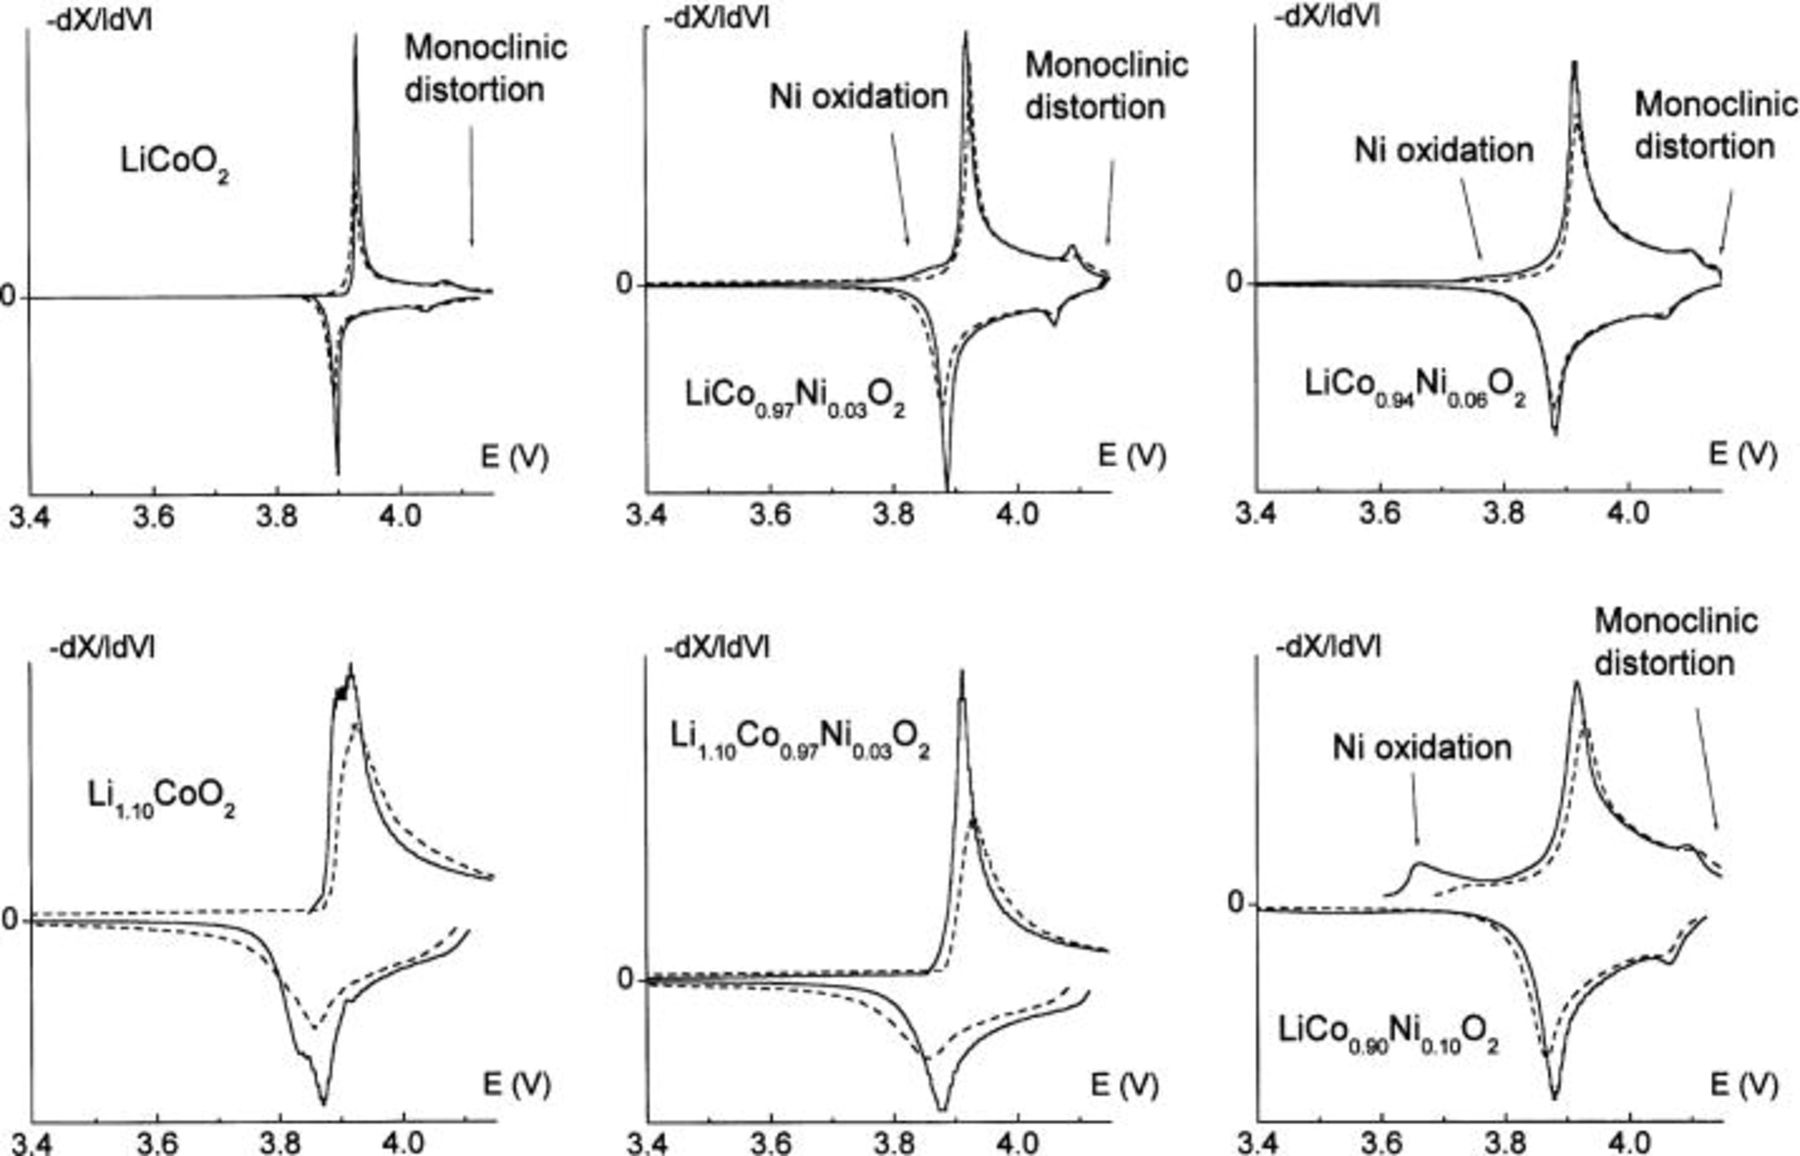
Figure 7.
 derivatives curves of the first (solid line) and 10th (dashed line) cycles of the various
 1.10;
1.10;  0.03, 0.06, and 0.10) electrochemical cells
 between 2.7 and 4.15 V.
MAS NMR Study

 MAS NMR spectroscopy measurements were carried out on the various
  starting materials. Figures 8 and 9 show the 15 kHz
  MAS NMR spectra of the lithium-stoichiometric
  materials
  0.03, and 0.06) and of the Li overstoichiometric
  phase.
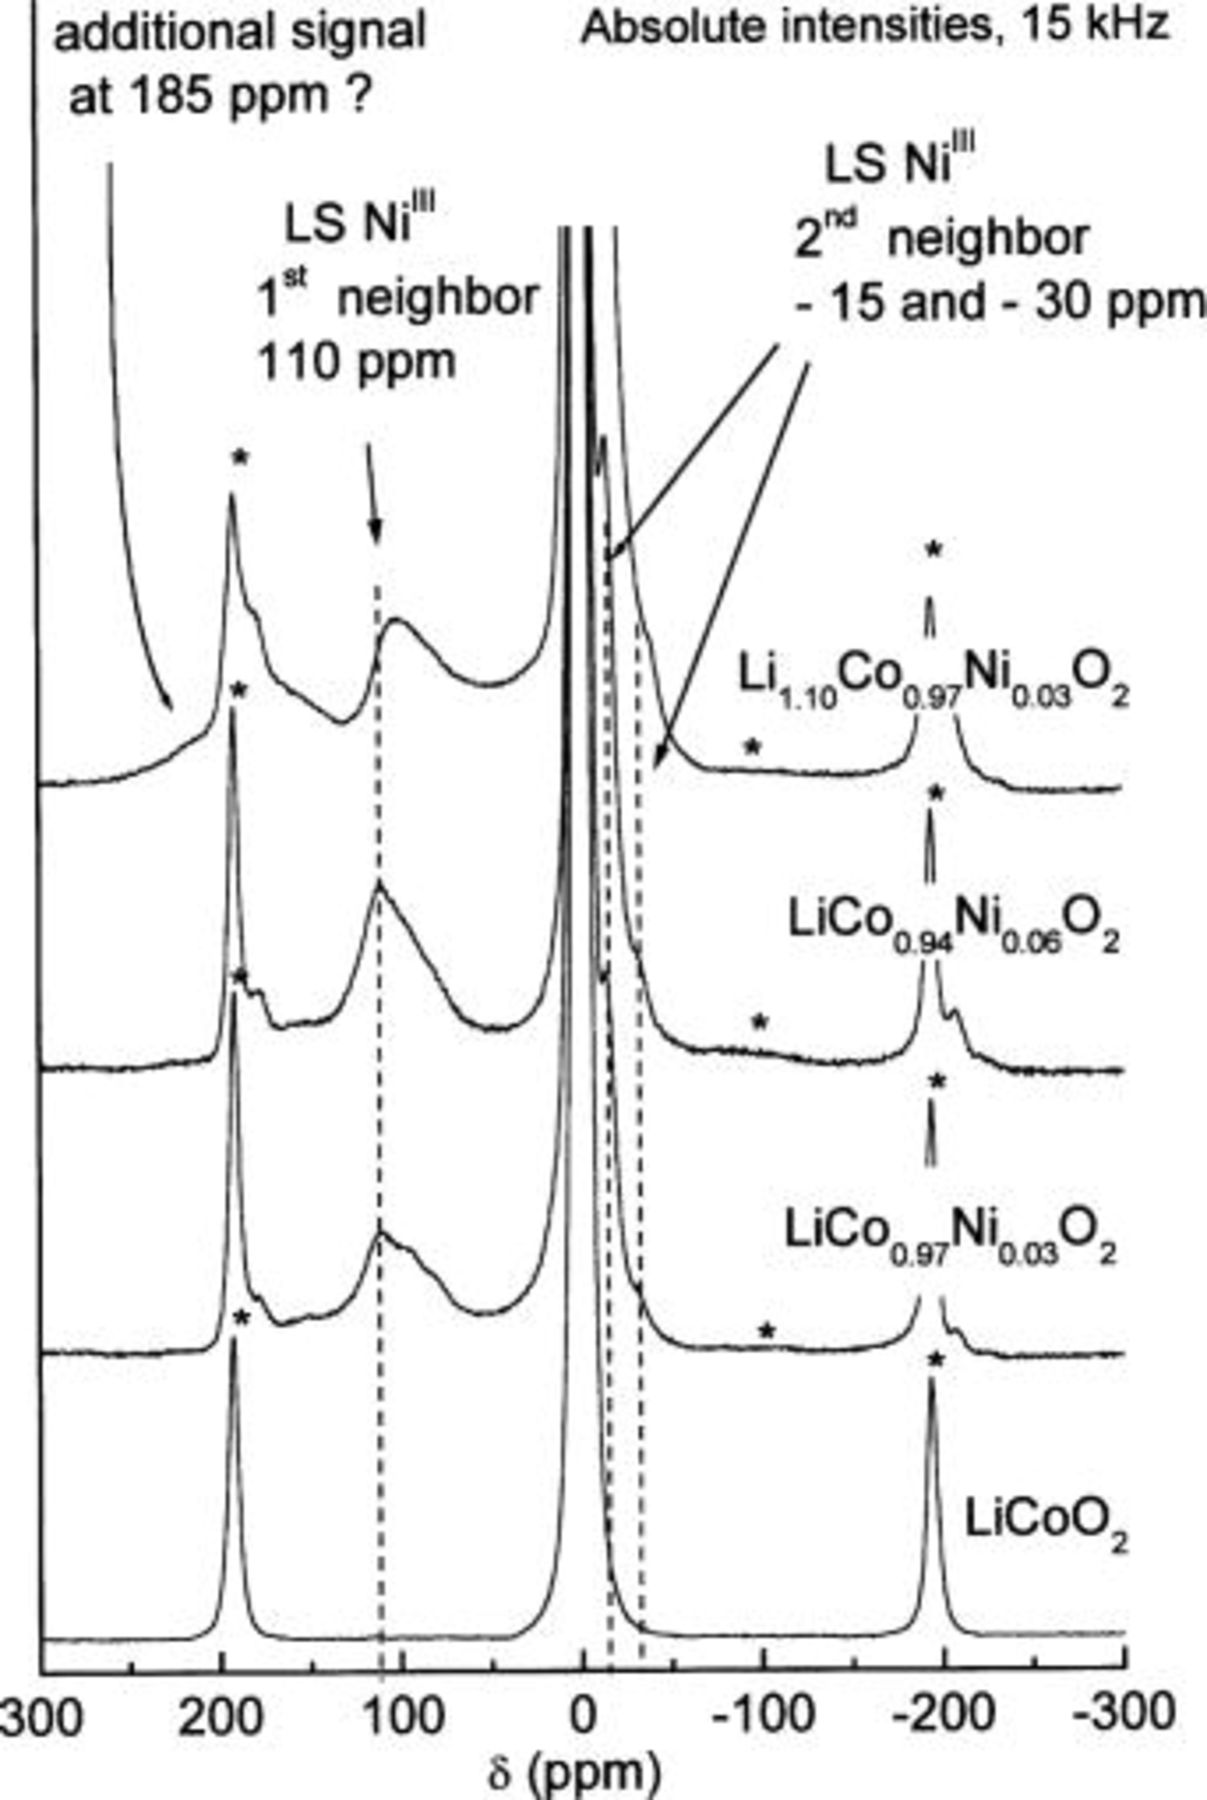
Figure 8. 15 kHz  MAS NMR spectra for the various
  phases
  1.10;
1.10;  0.03, 0.06),
  side bands).
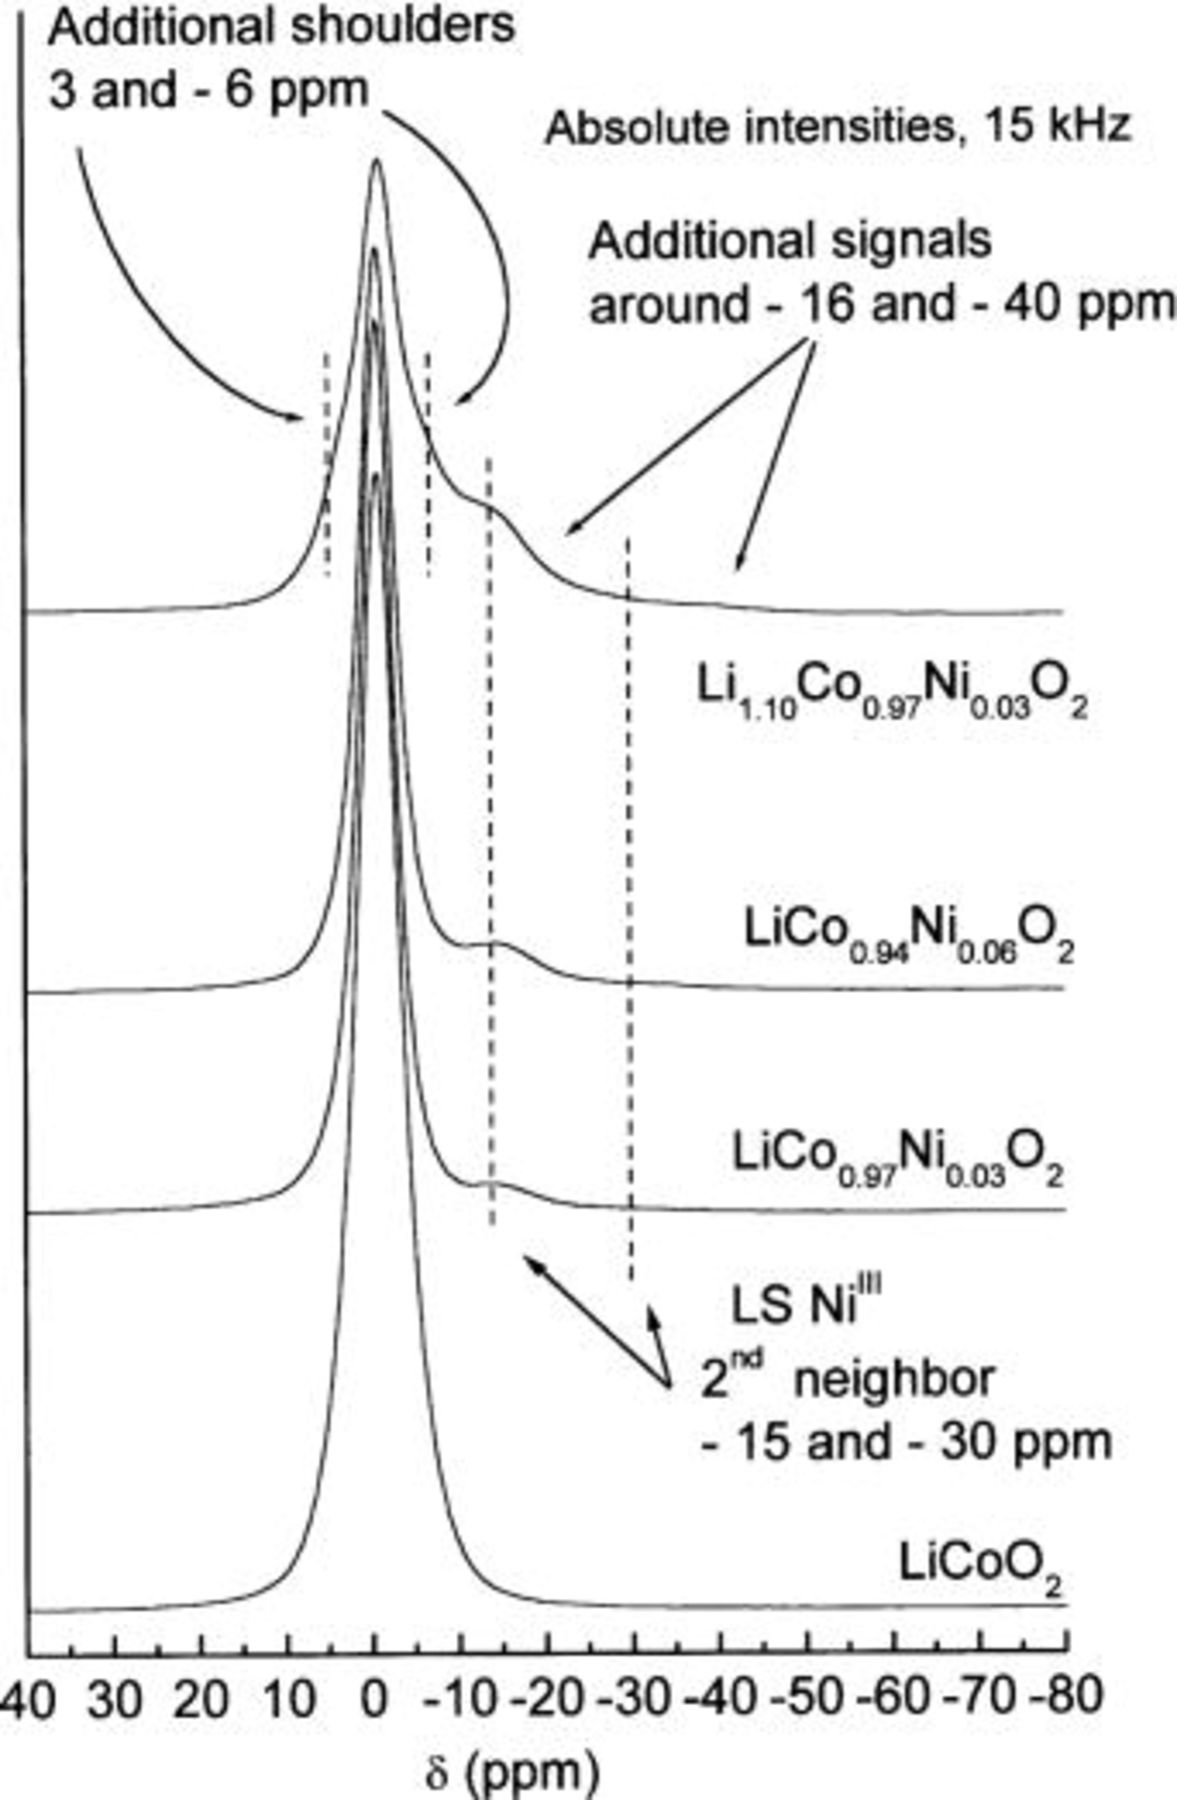
Figure 9. Expansion of the central signal of 15 kHz  MAS NMR spectra for the various
  phases
  1.10;
1.10;  0.03, 0.06).
As already reported,  exhibits a single narrow signal close to 0 ppm due to the exclusive presence of diamagnetic low spin
  ions in the structure, so that no hyperfine interaction is expected.28
29 For lithium stoichiometric Ni-doped materials, three new signals at 110,
ions in the structure, so that no hyperfine interaction is expected.28
29 For lithium stoichiometric Ni-doped materials, three new signals at 110,  and
and  are observed. These signals have been attributed by Marichal et al. to the presence of paramagnetic low spin
  ions with one single electron in the
  orbital
  The transfer of hyperfine interaction between the single
  electron toward the surrounding lithium ions can be done via the overlap with the oxygen orbitals with a 90° (first neighbor) or 180° geometry (second neighbor). The 110 ppm signal is assigned to Li ions with one
  ions as the first neighbor while the
  and
and  signals result from the presence of Li ions with one and two
  ions as the second neighbor, respectively.26
29 As expected, the magnitude of the
ions as the second neighbor, respectively.26
29 As expected, the magnitude of the  ions signals is all the more pronounced since the percentage of Ni ions in the material is large.
Furthermore, one can observe in Fig. 9 that the central signal of the  material is quite different from those of the lithium stoichiometric Ni-doped phases, showing characteristic shoulders centered approximately at 3 and
  These features are similar to those observed in the case of the
  phase (see Fig. 11), resulting from the presence of a structural defect leading to oxygen vacancies in the material. In
  these signals, initially attributed to the presence of divalent cobalt ions, are in fact due to
  ions in the vicinity of paramagnetic trivalent cobalt ions in a quite unusual spin state.19
30 Indeed, this structural defect, induced by a nominal Li excess during the synthesis, leads to the presence of intermediate spinning
ions in the vicinity of paramagnetic trivalent cobalt ions in a quite unusual spin state.19
30 Indeed, this structural defect, induced by a nominal Li excess during the synthesis, leads to the presence of intermediate spinning  ions (labeled
  which are responsible for three characteristic first/second neighbor effect NMR signals at 185 ppm (one
  first neighbor) and
  and
and  (one and two
  second neighbor, respectively). Furthermore, the two shoulders on the 0 ppm signal (3 and
  are considered to be due to
  ions in an oxygen environment perturbed by the oxygen vacancy, leading to various mechanisms of transfer of the hyperfine interaction from the
  ion close to the oxygen vacancy. These shoulders are clearly apparent in the spectra of the
  19 However, since the
  and
and 
 signals must get mixed up with the
  and
and 
 signals and because the first spinning side band must hide the possible presence of a signal at 185 ppm, one cannot clearly observe these signals on the 15 kHz MAS spectra.
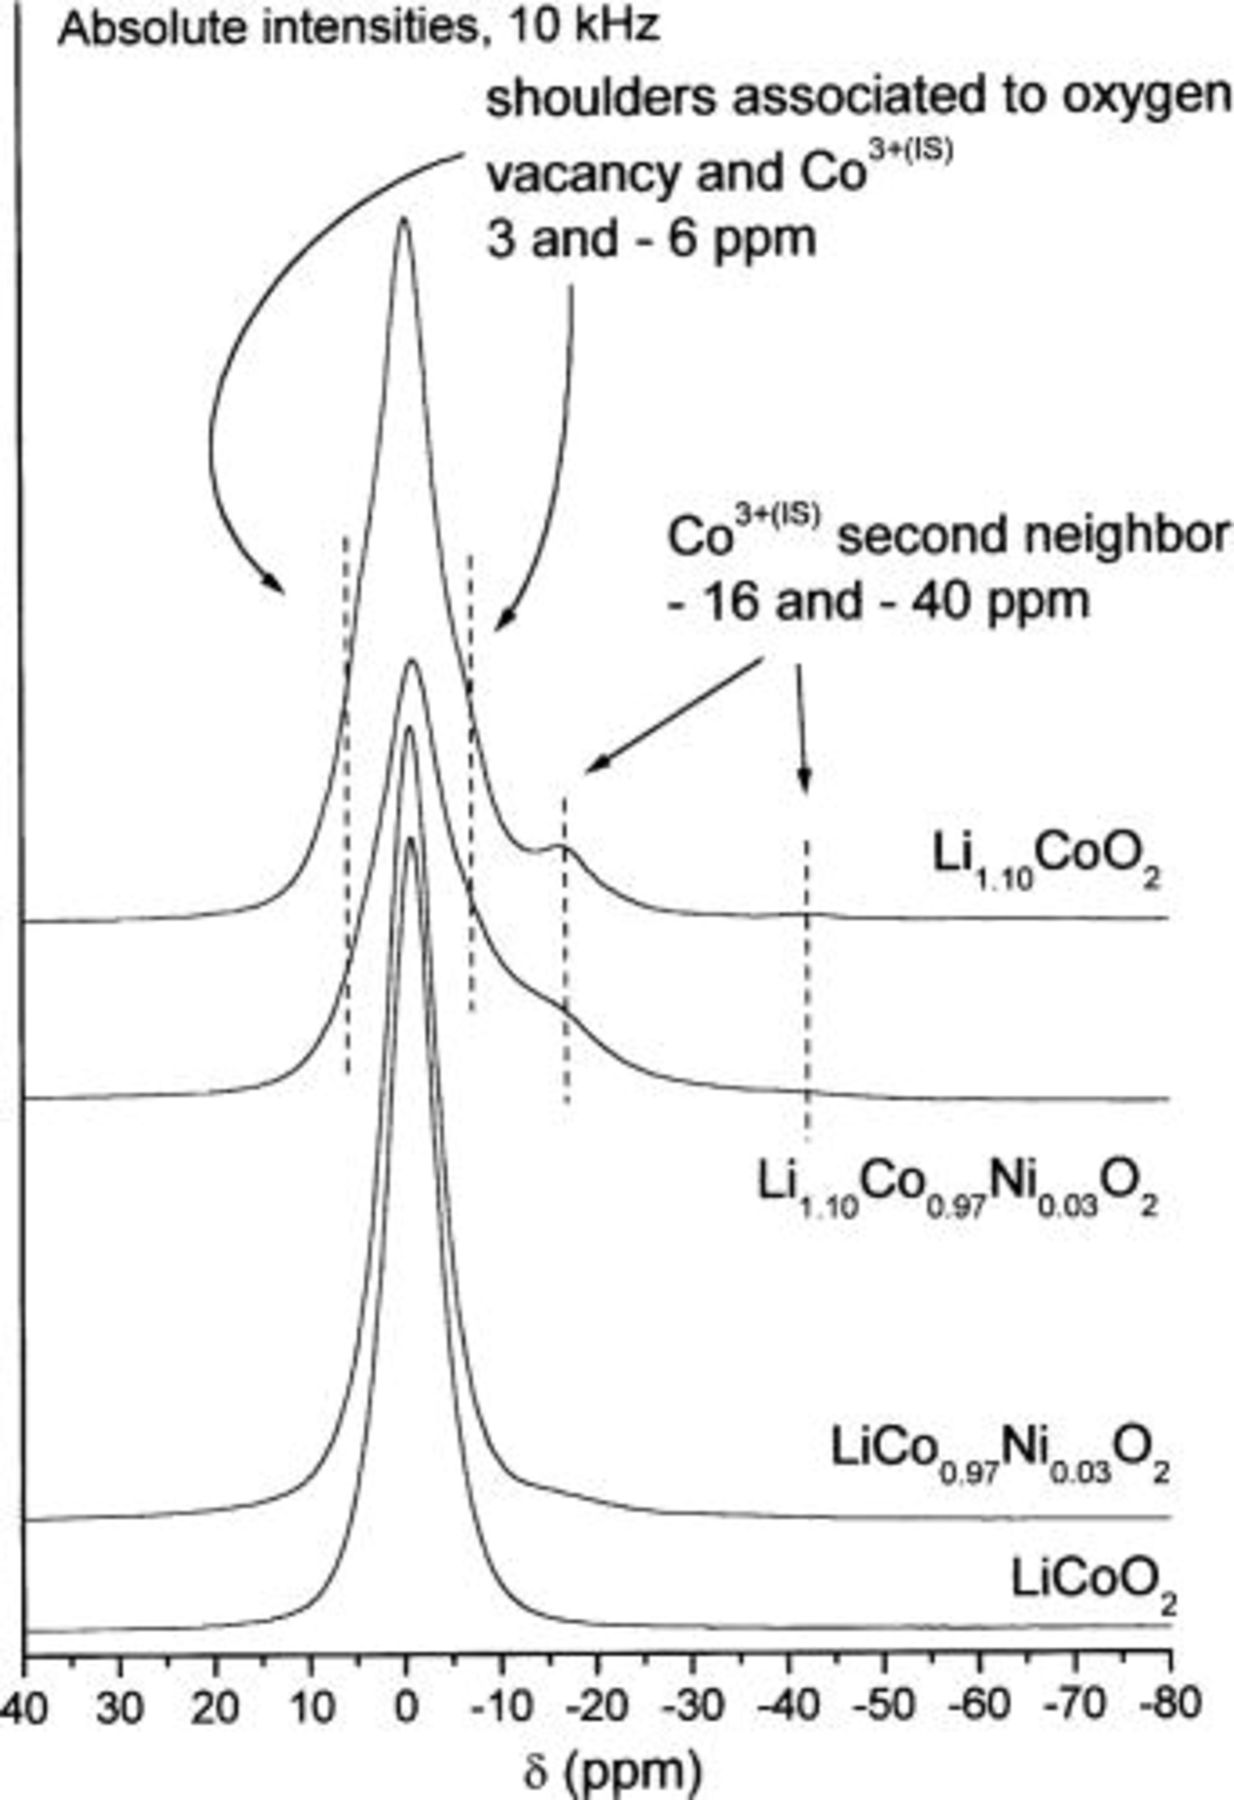
Figure 11. Expansion of the central signal of 10 kHz  MAS NMR spectra for the various
  phases
  1.10;
1.10;  0.03).
As concerns the first-neighbor effect of  ions in
  the first spinning side band at
  is clearly superposed on another band in the case of the lithium overstoichiometric material (Fig. 8). Therefore, in order to better observe the 150/250 ppm range, we have performed MAS NMR measurements using a 10 kHz rotation speed to shift the spinning side band without modifying the isotropic shifts. The NMR spectra, shown in Fig. 10 and compared to that of the
  phase clearly show the signal associated with
  at 185 ppm for the
  material. The expansion of the central signal of the various compounds (Fig. 11) confirms the presence of both
  and
and  ions in the lithium overstoichiometric
  phase, the contribution of each type of paramagnetic ion adding in the
  range and leading to a loss in the central signal definition.
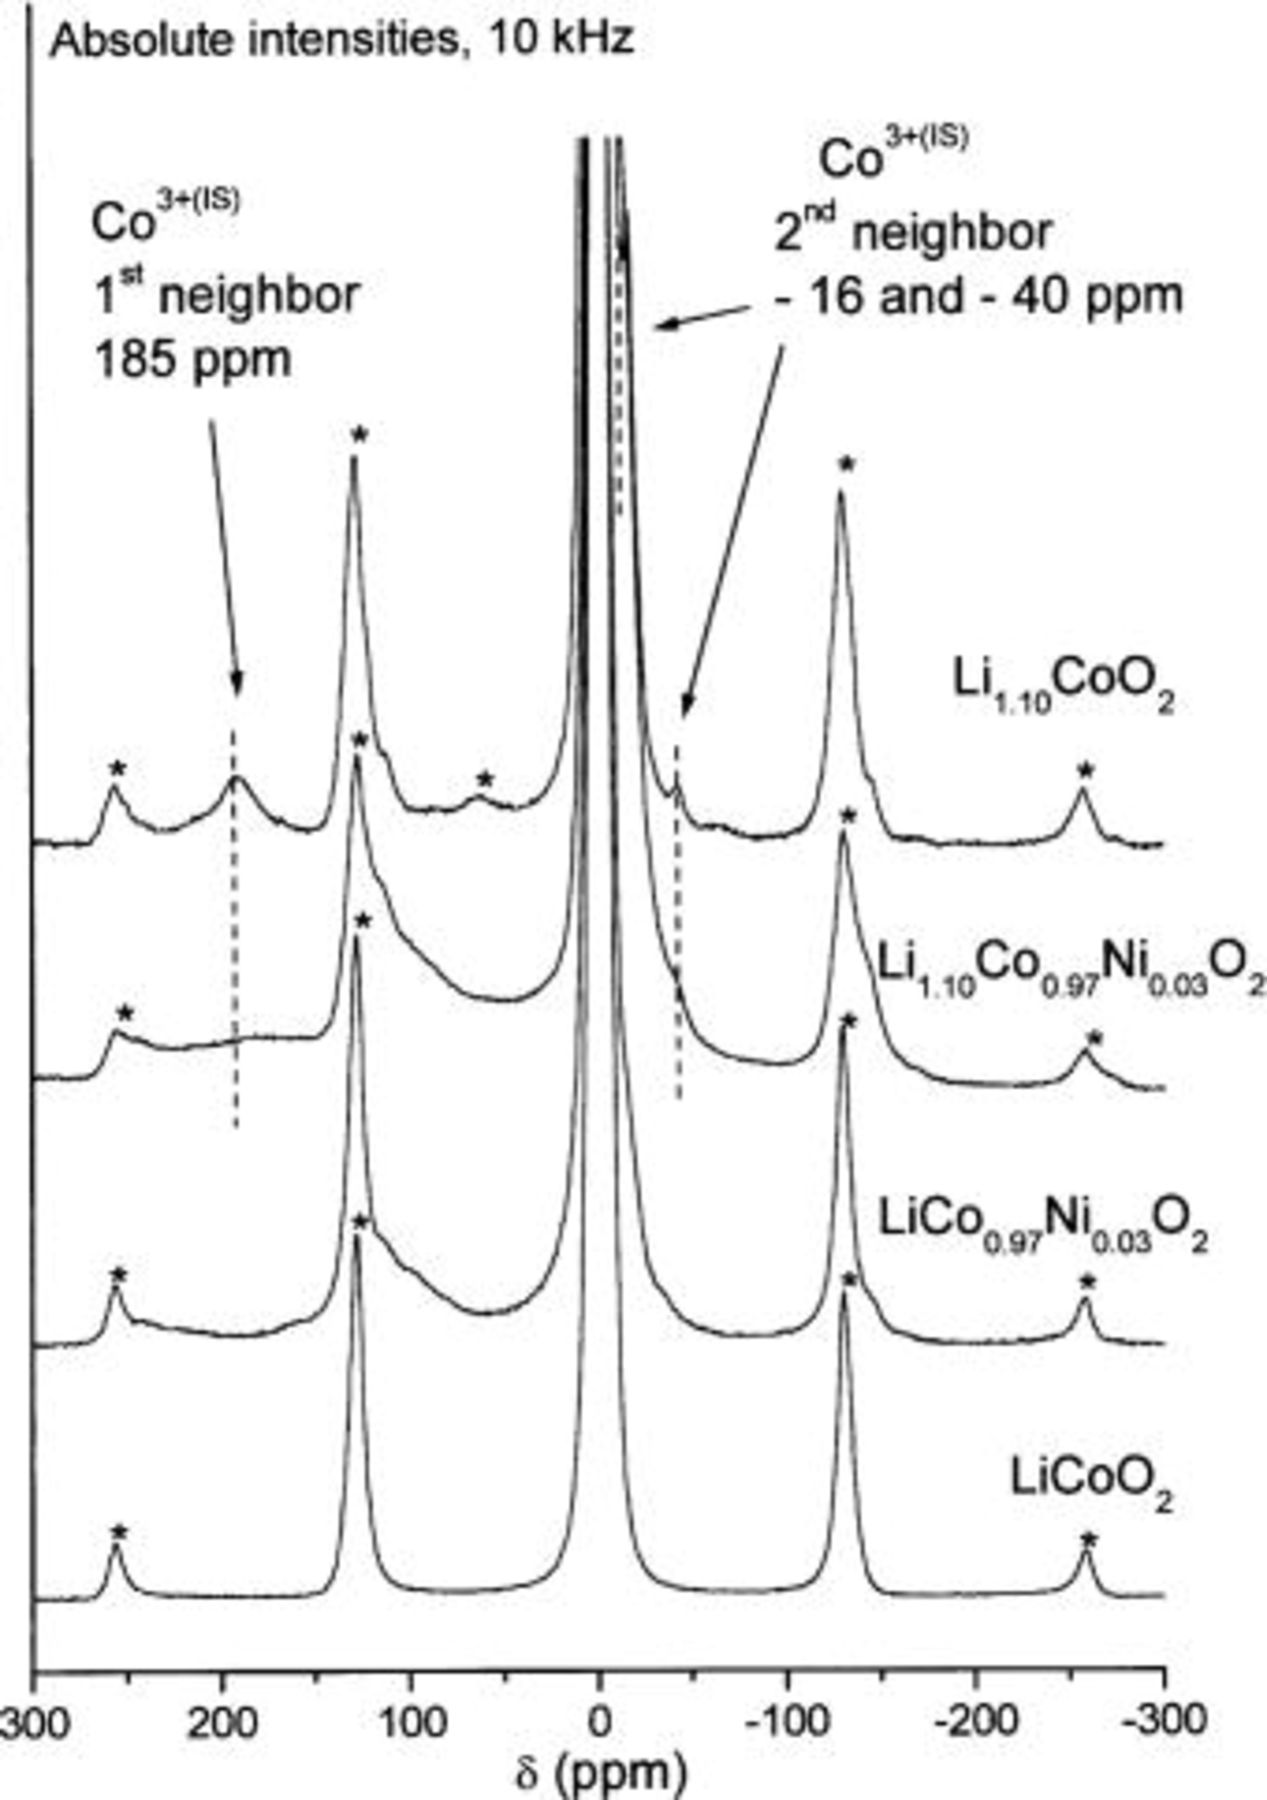
Figure 10. 10 kHz  MAS NMR spectra for the various
  phases
  1.10;
1.10;  0.03),
  side bands).
Conclusions
The galvanostatic measurements and XRD results allow us to point out some conclusions on the influence of Ni doping and Li nonstoichiometry in  This study clearly allows us to separate the relative effects of Ni-doping and lithium overstoichiometry which was not considered by Reimers et al.18 We show here that 3% of Ni ions substituted for Co do not make the monoclinic distortion disappear.
Before any conclusion, we have to consider what are the driving forces for the phase transitions in the pure 
 system. On the one hand, it is now totally admitted that the biphasic domain for
  results from a brutal change in the electronic properties of the
  system as it undergoes a semiconductor-to-metal transition at the macroscopic scale.7 On the other hand, the monoclinic distortion for
  is considered to have a structural origin related to the establishment of a Li/vacancy ordering in the interslab layer.4 Indeed, a recent TEM study clearly showed, for the first time, the Li/vacancy ordering in the monoclinic
  phase.31 In the
  system
  the presence of structural defects (oxygen vacancy associated to
  ions) induces enough perturbations in the slab to prevent any Li/vacancy ordering in the interslab space.30 From the electronic properties point of view, even if the semiconductor-to-metal transition is observed upon lithium deintercalation, this transition is not associated with a phase separation since the defects are trapped in the lattice and cannot move at room temperature.
In the case of Ni-doped materials synthesized without any lithium excess, the experimental results show first that 6% of Ni ions substituted for Co do not create sufficient perturbations in the  slab ordering to prevent the lithium/vacancy ordering in the insterlab and the resulting monoclinic distortion because of the close ionic radii of the
  and
and  ions.23 When 10% of Ni are substituted for Co, the effect becomes significant and the trace of the monoclinic distortion becomes weak. As a possible explanation of the discrepancy between our and Reimers's results on that point, we suggest that the Ni-substituted samples studied by this author may have been slightly Li-overstoichiometric.
Second, from the electronic properties point of view, the Ni ions are trapped in the lattice and are an obstacle to electron delocalization. Therefore, the expected phase separation associated with the semiconductor-to-metal transition cannot occur; a solid solution domain is observed upon lithium deintercalation. The behavior resulting from the presence of the nickel ions is very similar to that due to the structural defects associated with lithium overstoichiometry in the 
 phases.19
30
phases.19
30
When both type of defects are simultaneously present (Ni ions and defects related to lithium overstoichiometry) as shown by NMR measurements conducted on the  phase, all the phase transitions disappear.
Finally, the NMR measurements show that the doping effects of nickel and lithium are cumulative and independent. Indeed, in the  phase, both
  ions (associated to an oxygen vacancy) and
  ions coexist in the diamagnetic
  lattice.
Acknowledgments
The authors thank I. Saadoune, A. Audemer, L. Gautier, and J. Scoyer for fruitful discussions, and Umicore, ANRT, and Région Aquitaine for financial support.
Institut de Chimie de la Matière Condensée de Bordeaux assisted in meeting the publication costs of this article.