
Abstract
Electrochemical characteristics of advanced lithium-ion batteries (ALBs) have been investigated using a three-electrode system. The reference electrode is a piece of lithium inserted between the anode and cathode. Electrochemical impedance spectroscopy shows that both the solid electrolyte interface (SEI) and charge-transfer resistances depend on the battery's state of charge (SOC). In a fully charged ALB, the main contribution to the resistance comes from the SEI of the anode; whereas, in a fully discharged state, the contribution comes from the charge-transfer resistance of the cathode. The discharge capacity under high currents is limited by the diffusion of lithium ions within the cathode; the effects of the anode are small. The charge-transfer resistance of the cathode increased most, by approximately 200%, after 200 cycles at  and thus this value has the largest effect on the cycle life of the ALB. During low-temperature discharge, the anode shows the largest cell resistance of 2.8 Ω, but near the completion of discharge, the cathode contribution starts to dominate (0.4-2.7 Ω), and the anode resistance decreases to 1.3 Ω. © 2004 The Electrochemical Society. All rights reserved.
Export citation and abstract BibTeX RIS
The demand on rechargeable batteries for portable electronics such as cellular phones, camcorders, and computers has become pressing. An increasing amount of attention is given to advanced lithium-ion batteries (ALBs), encased in aluminum-plastic laminated film, because of their high energy density and wide variety of sizes and shapes compared to other rechargeable batteries.1 2
Electrochemical studies on commercial ALBs are scarce; most focus on SONY 18650 cylindrical lithium-ion batteries.3 4 5 6 7 8 There has been much work elucidating the causes of capacity fade in lithium-ion batteries. Zhang et al.3 proposed that the surface resistance of both electrodes increases with cycling and consequently contributes to the capacity decrease. Rubino et al.4 stated that in cylindrical cells, the capacity fade is primarily caused by a reduction in the cathode capacity, and the fading in prismatic cells is attributed to the high cell stack pressure from anode swelling.
Low-temperature discharge characteristics of lithium-ion batteries also attract much research interest. Nagasubramanian7 described the low-temperature electrical performance of A&T, Moli, and Panasonic 18650 Li-ion cells and concluded that although the performance of these cells at and around room temperature is respectable, below 0°C the performance is poor. Fan8 indicated that lithium-ion diffusion in the cathode solid electrolyte interface (SEI) may be the cause of a limited cell discharge capacity and not ionic conductivity in the electrolyte or the lithium-ion diffusion in the electrodes.
For convenience, two-electrode systems of commercial lithium-ion batteries are commonly adapted for electrochemical measurements and analysis. However, it is difficult to distinguish the interaction between and contribution of the anode and cathode with this prototype system; therefore, a three-electrode system has been introduced. Numerous reports have studied electrochemical properties on three-electrode laboratory test cells, yet the application of this technique to sealed commercial batteries is scarce. In the documented studies of commercial cylindrical or prismatic batteries, exterior cans are usually opened to retrieve the anode and cathode, and new half-cells are remade in the lab to test for the electrodes' separate properties.3 The reassembly is inconvenient and may damage the electrodes. If a reference electrode is added into the currently commercialized battery, many analytical data then may be studied and understood more clearly. A convenient three-electrode ALB system is developed to study the electrochemical performance of the ALB in detail. The proposed method is to insert a piece of lithium metal as the reference electrode in a proper location between the anode and cathode before sealing off the battery. Through this system, changes in the electrochemical characteristics of the electrodes are shown directly with respect to the reference electrode during the charging and discharging processes. A systematic electrochemical impedance spectroscopy (EIS) analysis on the ALB is also performed to study the influence of the electrolyte, the anode, and the cathode on the performance of life cycle, high-current discharge, and low-temperature discharge by the three-electrode system. In practice, the capacity ratio of anode to cathode (A/C ratio) may affect a battery's cycle performance and safety, and by using the three-electrode system, changes in the ratio may clearly be identified.
Experimental
The test batteries had an aluminum-plastic laminated film exterior with dimensions of  mm. The capacity was 750 mAh and the weight 16.5 g. The initial cell balance (capacity ratio of anode to cathode) was about 1.05. The content of the lithium cobalt oxide electrode (cathode) was 90 wt %
  (10 μm diam, Nippon Chemical), 7 wt % KS6 (Timcal Timrex), and 3 wt % polyvinylidene fluoride (PVDF, Kuraha Chemical) binder. The powder was mixed with the solvent N-methyl-2-pyrrolidone (NMP, Mitsubishi Chemical) to form a slurry. The slurry was coated on aluminum foil (20 μm thick) and dried at 140°C. The electrode (200 μm thick) was then pressed to a resultant thickness of 150 μm. A mesocarbon microbead (MCMB) electrode (anode), composed of 93 wt % MCMB (Osaka Gas, 25 μm diam) with 7 wt % PVDF binder and NMP and coated on copper foil (15 μm thick), went through the same processing steps as the cathode. The resultant thickness of the MCMB electrode was 135 μm (before pressing, the electrode was 180 μm thick). The batteries were assembled in a dry room. The manufacturing process was as follows: both the anode and cathode were dried at 120°C for 3 h in a vacuum chamber, then the electrodes were cut into appropriate sizes for winding with a separator (Celgard 2320, 20 μm thick). The roll of electrodes and separator was then inserted into an aluminum-plastic laminated film case. 3.2 g of electrolyte was injected into the case and then sealed off at reduced pressure. The electrolyte was 1 M lithium hexafluorophosphate,
  Tomiyama Pure Chemical) with ethylene carbonate/propylene carbonate/diethylene carbonate (1/1/2, by volume). The water content of the electrolyte was less than 10 ppm, measured via the Karl Fischer titration technique in an argon-filled glove box.
A lithium chip was pressed on one end of a fine copper wire to make the reference electrode. To monitor the changes of voltage and impedance in the anode or cathode, the reference electrode was placed in the center of the battery between the two electrodes. A schematic diagram of the three-electrode system is shown in Fig. 1. The batteries are cycled between 4.2 and 2.75 V by a charge/discharge unit (Maccor model series 4000). The procedure consisted of constant current followed by constant voltage at 4.2 V until the current tapered down to 10 mA. The batteries were discharged at constant current. After charging and discharging, the batteries were scheduled to have 10 min rest. Low-temperature electrochemical studies were conducted by setting the batteries at the desired specific temperature in a temperature-controlled chamber for 2 h before testing.
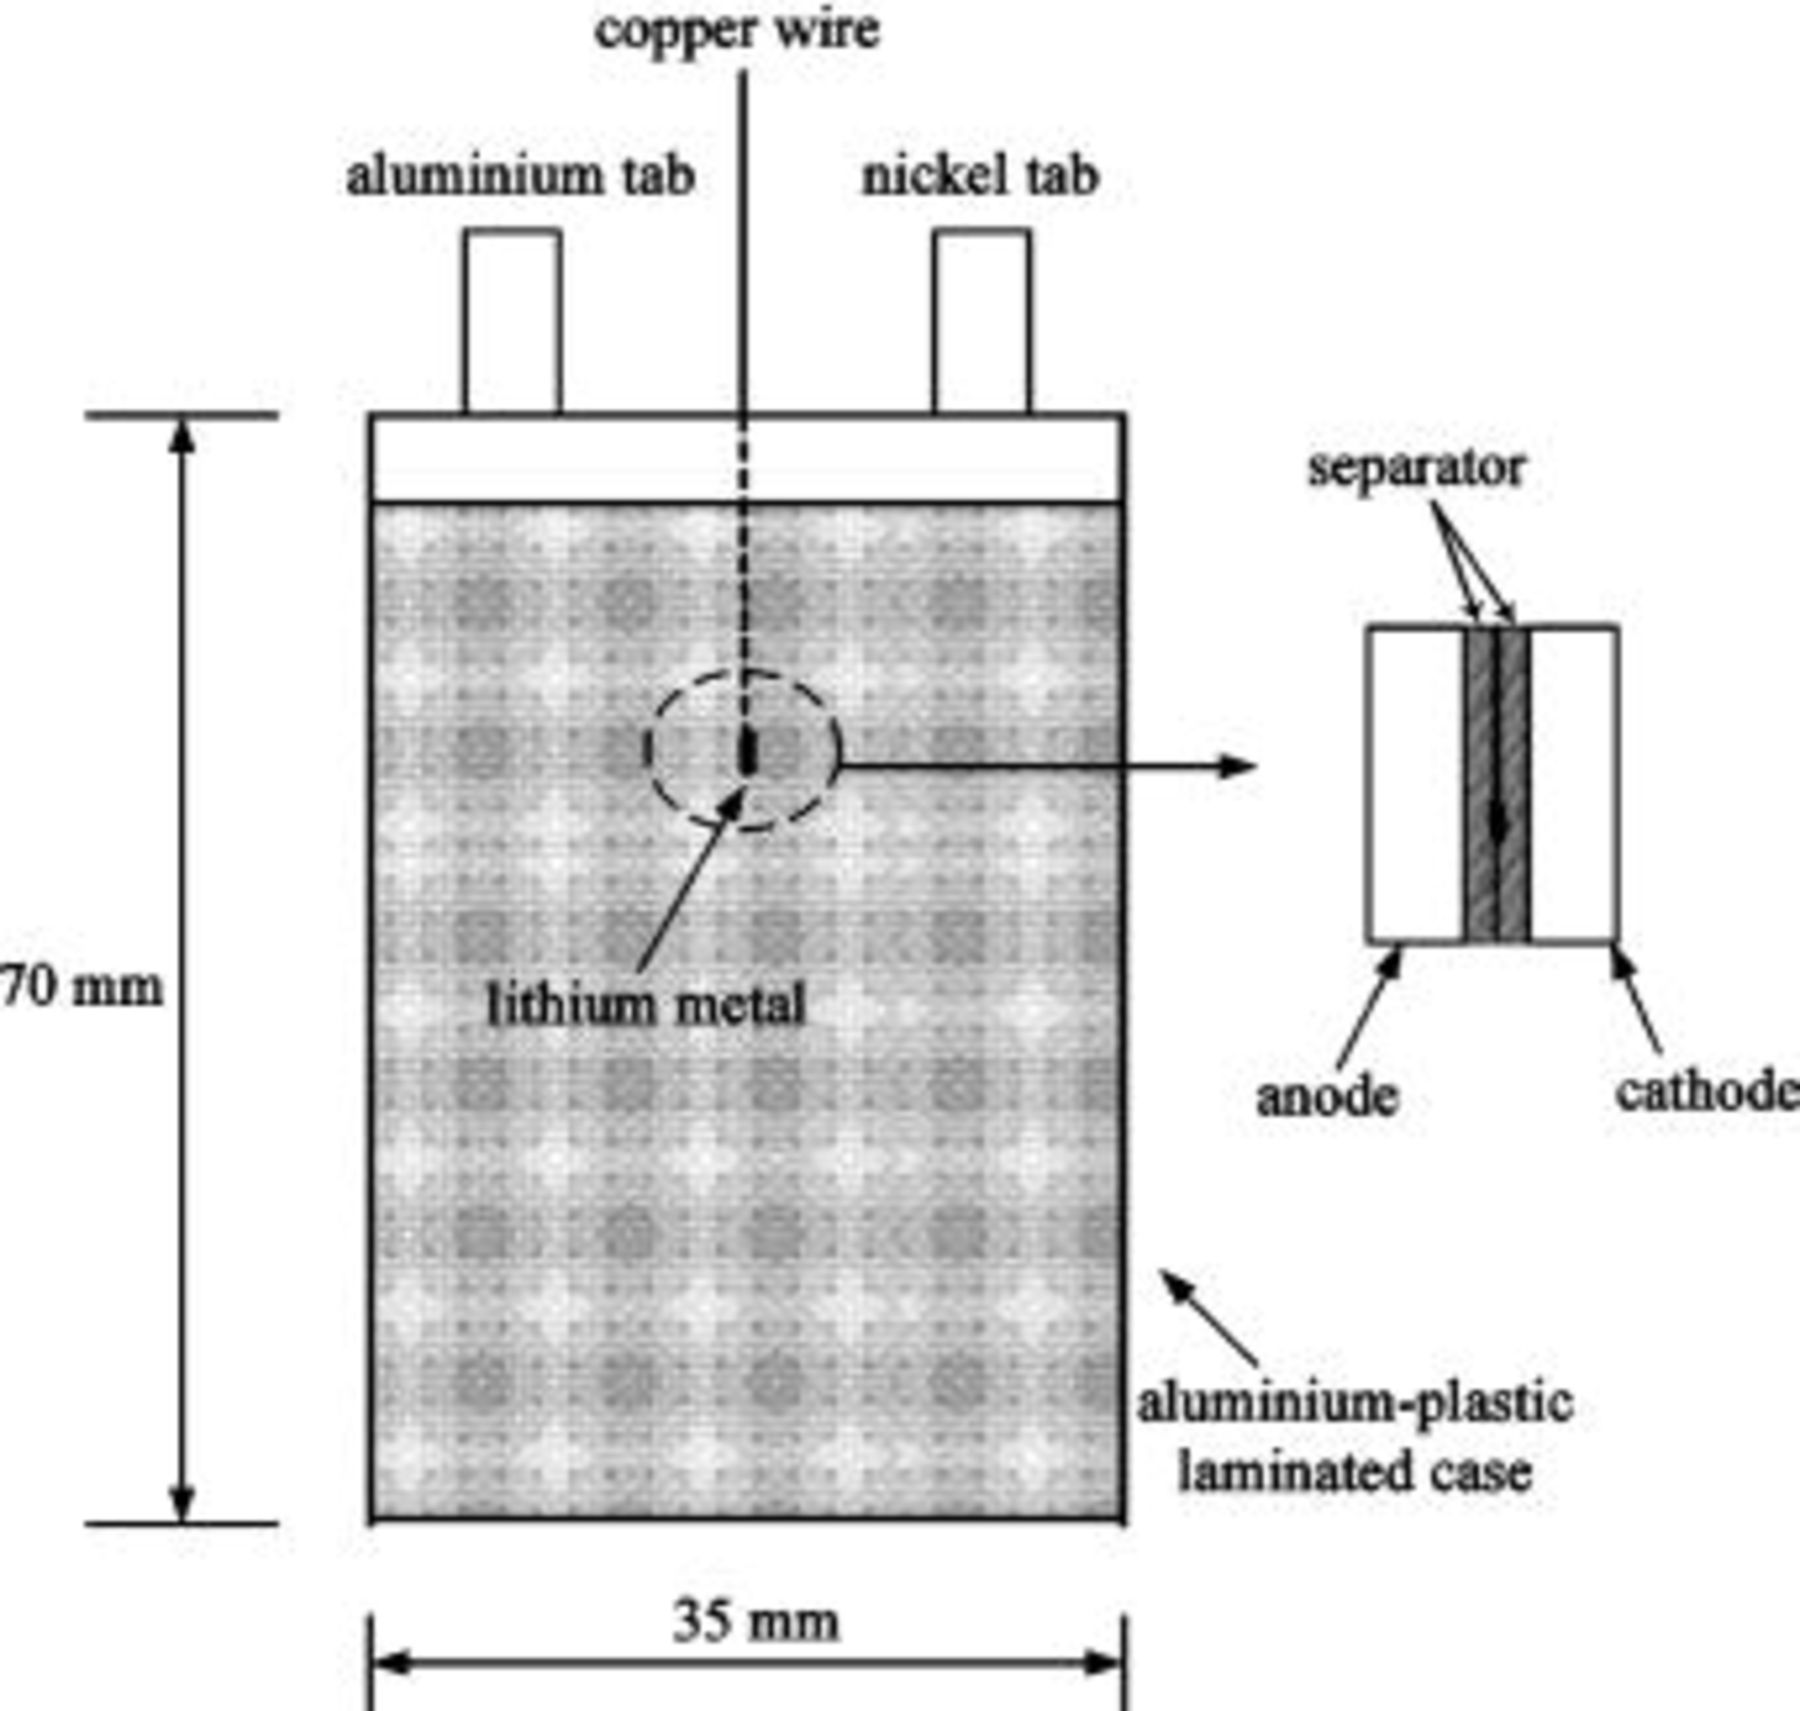
Figure 1. Schematic diagram of three-electrode ALB system.
The Maccor charge/discharge unit recorded simultaneously and independently the total cell voltage and the half-cell voltages of both the anode and cathode vs. the reference electrode. Three-electrode EIS measurements were taken at different states of charge SOC using a potentiostat/galvanostat (Schlumberger SI 1286) and a frequency response analyzer (Schlumberger SI 1255). Scanning frequencies ranged from 50 kHz to 0.01 Hz, and the perturbation amplitude was 10 mV.
Scanning electron microscopy and energy-dispersive spectrometry (EDS) qualitative analysis measurements were performed with a field emission scanning electron microscope (LEO-1530) coupled with an EDS (LEO-1550).
Results and Discussion
Capacity ratio of anode to cathode (A/C ratio).—
Generally, in the design of a lithium-ion battery, to prevent the possibility of lithium ion deposition during charging, the A/C ratio must be controlled within a certain range. A suitable A/C ratio may lengthen the cycle life of a battery and improve its safety characteristics. Figure 2a shows the voltage curves of two ALBs during charge and discharge at 0.2 C current. One has an A/C ratio of 1.05 and the other 0.9. The voltage curves of the two batteries are very similar, and the effects of an inappropriate A/C ratio hence cannot be clearly identified. However, with the help of a lithium reference electrode, the abnormality can be clearly seen. Figure 2b shows the voltage curves of each of the anodes and cathodes with respect to the reference electrode in two charge/discharge cycles. The battery with A/C ratio of 1.05 has an anode voltage higher or equal to 0 V vs.  during the entire charging process; therefore, lithium deposition is unlikely to occur on the MCMB surface. For the battery with the 0.9 A/C ratio (a much higher cathode than anode capacity), the anode voltage has dropped below 0 V vs.
  during charging, which indicates the possibility of lithium deposition. The lowest reading is at approximately −0.1 V vs.
  followed by an increase, possibly due to the decrease in current at constant voltage. A voltage reading lower than 0 V does not state the existence of lithium deposition, for this voltage includes the overpotential contributed from the ohmic resistance (electrolyte), the charge-transfer resistance, and the mass-transfer resistance. Lithium deposition can also be identified from the voltage plateau in the anode discharge curve, as shown in Fig. 2b. A Gray-white deposition was found over the MCMB surface when the battery (A/C ratio 0.95) was opened at its fully charged state, which directly proves the existence of lithium ion deposition. The battery with the A/C ratio of 1.05 does not have this deposition.
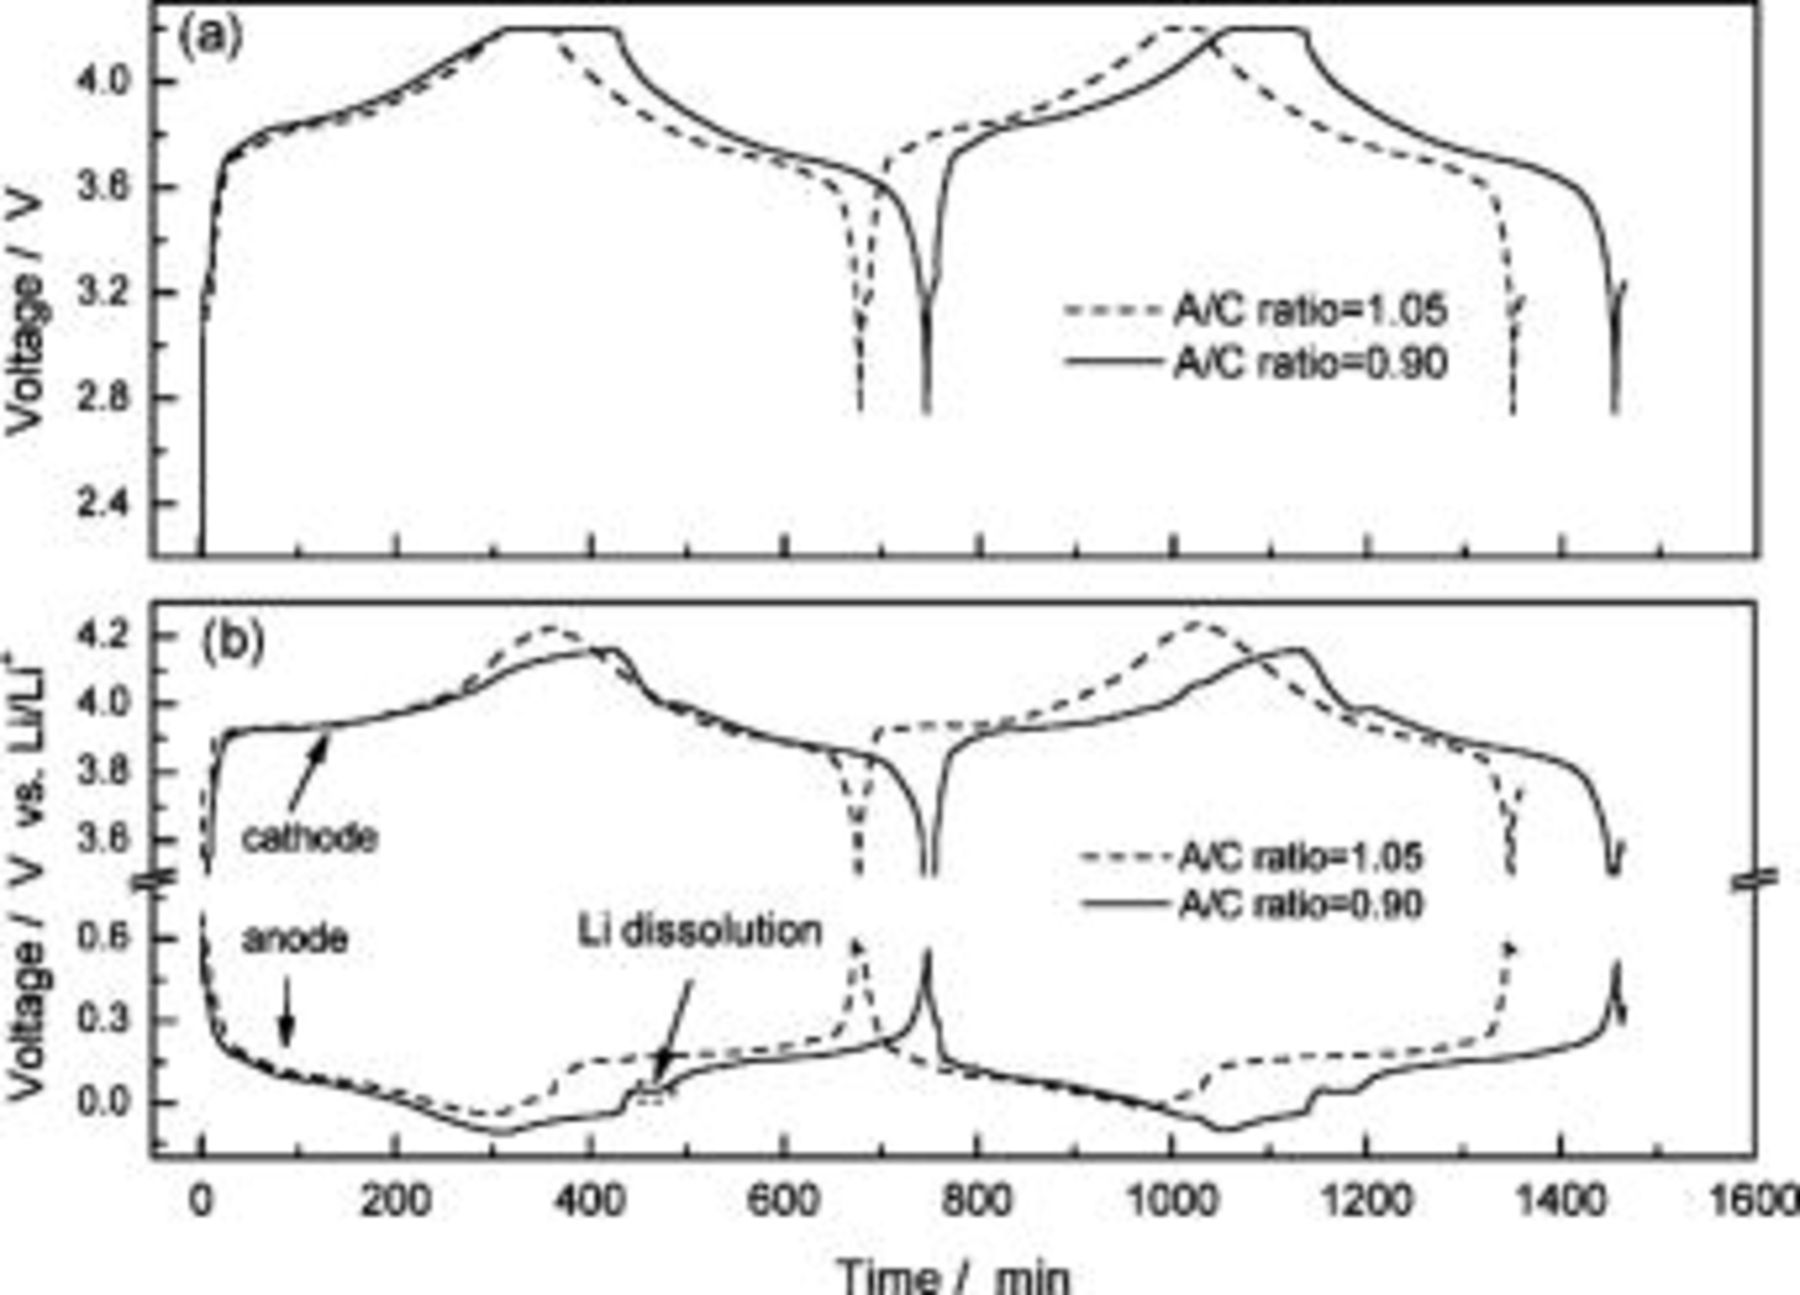
Figure 2. Voltage curves of (a) anodes to cathodes and (b) each of the anodes and cathodes with respect to the reference electrodes of two ALBs during charge and discharge at 0.2 C current density. One has an A/C ratio of 1.05 and the other 0.9.
Lithium ion deposition is commonly believed to induce dendrite structure and cause internal shortage or create undesirable safety characteristics.9 The cause of low A/C ratio (lithium deposition) varies. One possibility is cycling. The freshly deposited lithium covers the active surface of the anode and reacts with the electrolyte, leading to a loss of cyclable lithium ions and consumption of the electrolyte. This consumption may occur during high charge rates even for batteries with a conservative A/C ratio, because the negative electrodes are very polarized.10 According to Arora et al. , a more common circumstance leading to lithium deposition is a poorly balanced cell having too much positive electrode mass initially.11 From Fig. 2b, the highest cathode voltage of the battery with the A/C ratio of 1.05 is at around 4.2 V, whereas the other battery kept the value below 4.2 V at all times. It is reasonable to assume from the pattern that, when the anode is in excess, the cathode voltage would go higher than 4.2, and above this specific voltage, the  structure is believed to start deteriorating.12
AC impedance analysis.—
Figure 3 shows the measured and the simulated impedance spectra of the anode (Fig. 3a) and cathode (Fig. 3b) at different SOCs. The corresponding equivalent circuits are presented in the figure too;  represents the ohmic electrolyte resistance,
  and
and  are the SEI film resistances,
  and
and  are the corresponding capacitance to
  and
and 
 is the charge-transfer resistance,
  is the double-layer capacitance, and W is the Warburg impedance. The semicircle in the high-frequency range corresponds to the surface film resistance and is composed of smaller semicircles, generated by the resistance and capacitance from the different layers of the SEI. In the low-frequency range, the semicircle resembles the charge-transfer resistance, and the linear section resembles the solid-state lithium-ion diffusion.13
14
15 To have a higher precision in the modeling of the anode and cathode impedance, different corresponding equivalent circuits are used, as shown in Fig. 3.15 There are two RC-components in series, representing the SEI contribution, in the anode circuit, but only one in the cathode circuit. The simulation results are identical to the experimental EIS measurements. The simulation results obtained from the EIS data of the equivalent circuits in Fig. 3 are listed in Table I. From the figures, the spectra of
is the double-layer capacitance, and W is the Warburg impedance. The semicircle in the high-frequency range corresponds to the surface film resistance and is composed of smaller semicircles, generated by the resistance and capacitance from the different layers of the SEI. In the low-frequency range, the semicircle resembles the charge-transfer resistance, and the linear section resembles the solid-state lithium-ion diffusion.13
14
15 To have a higher precision in the modeling of the anode and cathode impedance, different corresponding equivalent circuits are used, as shown in Fig. 3.15 There are two RC-components in series, representing the SEI contribution, in the anode circuit, but only one in the cathode circuit. The simulation results are identical to the experimental EIS measurements. The simulation results obtained from the EIS data of the equivalent circuits in Fig. 3 are listed in Table I. From the figures, the spectra of  are different from those of
  the effects of a battery's SOC condition are clearly shown to be related to the electrodes' resistance. The individual contributions from each of the film resistances and charge-transfer resistances of the anode and cathode are presented in Fig. 4. Both the film resistance and charge-transfer resistance of the anode increase with SOC and reach a maximum at the fully charged state. The cathode resistance trends show opposite behavior. For
  the anode film resistance is most resistive among the four contributing factors, whereas in near
  the dominating factor is the cathode charge-transfer resistance. Though there are many studies describing and explaining the impedance change of
  and MCMB,16
17
18
19 the results are not only related to the intrinsic properties of the materials, but also to the content and manufacturing processes of the electrodes.
and MCMB,16
17
18
19 the results are not only related to the intrinsic properties of the materials, but also to the content and manufacturing processes of the electrodes.
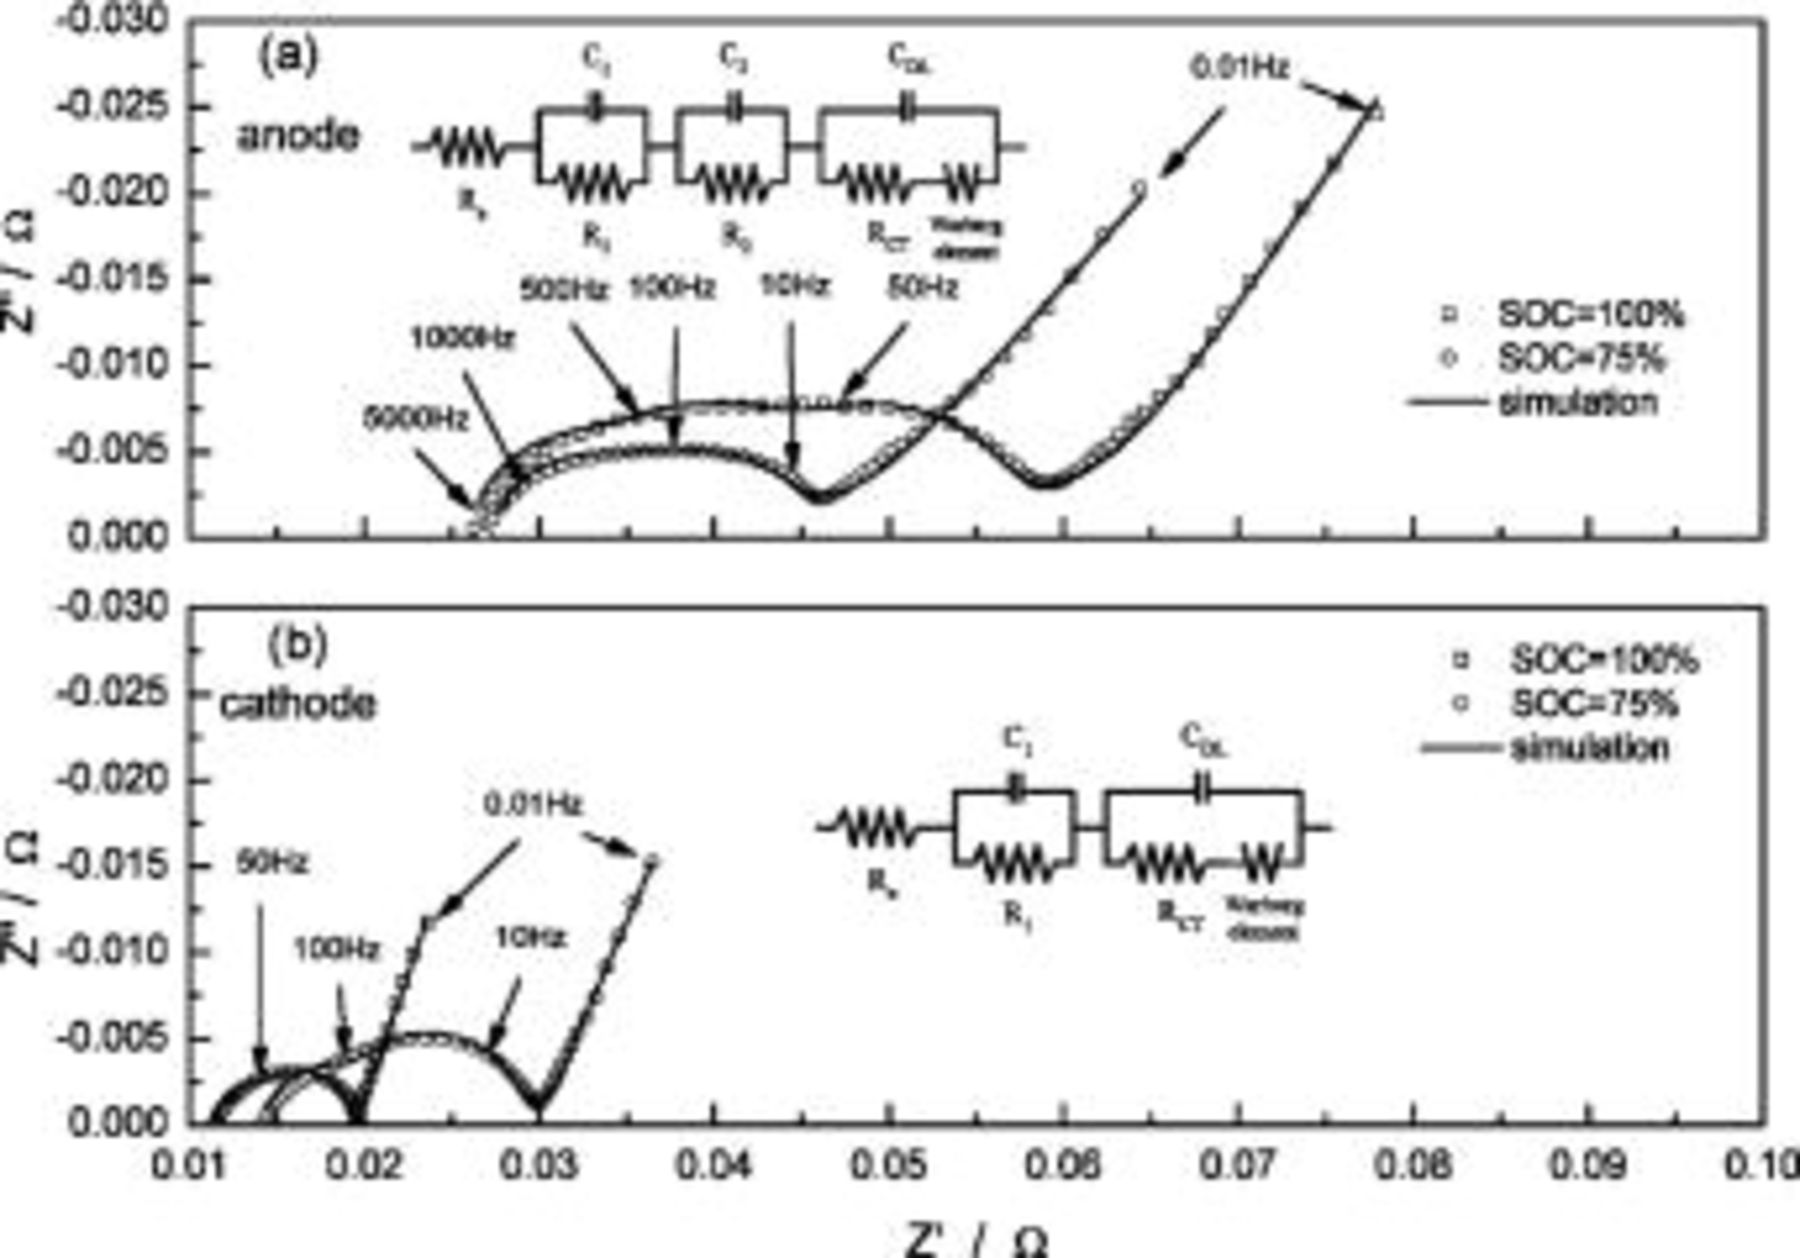
Figure 3. Measured and simulated impedance spectra of (a) anode and (b) cathode at different SOCs. Insets show corresponding equivalent circuits used for simulation.
Table I.
| Simulation results obtained from EIS data of equivalent circuits in Fig. 3. | ||||||||
|---|---|---|---|---|---|---|---|---|
| Electrodes |
 (Ω) (Ω) |
 (F) (F) |
 (Ω) (Ω) |
 (F) (F) |
 (Ω) (Ω) |
 (F) (F) |
 (Ω) (Ω) | W (Ω) |
Anode
 | 0.0259 | 0.0133 | 0.0078 | 0.0679 | 0.0099 | 0.5272 | 0.0259 | 10.0910 |
Anode
 | 0.0268 | 0.0521 | 0.0061 | 0.3896 | 0.0037 | 1.0380 | 0.0052 | 8.1640 |
Cathode
 | 0.0115 | 0.6170 | 0.0024 | — | — | 1.5450 | 0.0054 | 0.1060 |
Cathode
 | 0.0142 | 0.1329 | 0.0048 | — | — | 0.7998 | 0.0093 | 3.2080 |
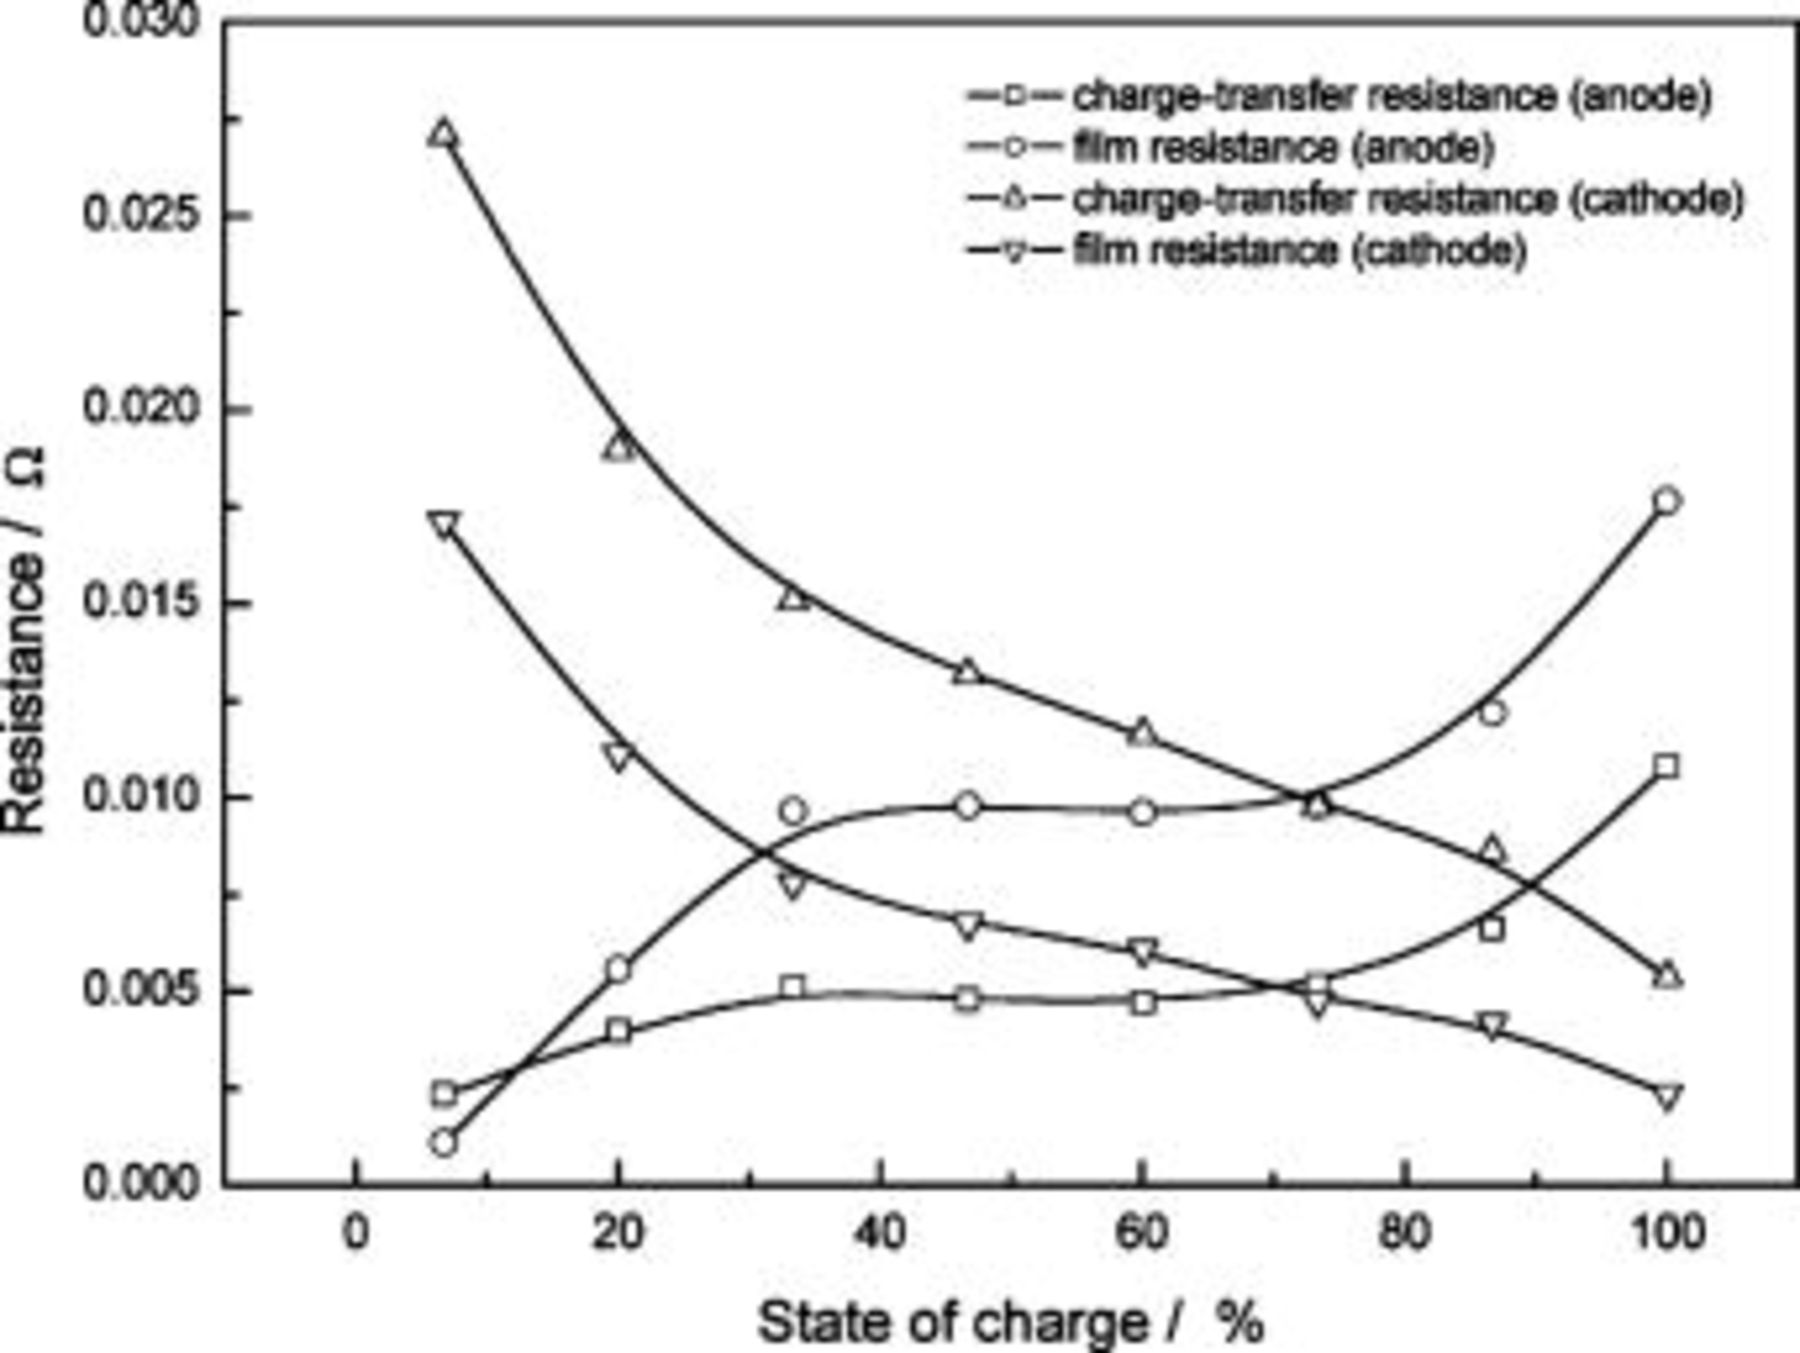
Figure 4. Individual contributions from each of the film resistances and charge-transfer resistances of the anode and cathode.
C-rate performances.—
Figure 5a shows the discharge curves of an ALB under different discharge rates (the prior charging rate is 0.2 C). For discharge currents lower than 1 C, the effect on capacity is minute; basically, the values are all around 750 mAh. But when the discharge currents are higher than 1 C, the capacity significantly decreases. For example, the capacity reaches only 400 mAh at 4 C discharge, which is only 52% of the 0.2 C discharge. If the ionic conductivity of the electrolyte is high enough, the ohmic overpotential can then be neglected. Generally, the overpotential contributed from the charge-transfer reaction and diffusion can easily be derived from the anodic polarization results.20 The diffusion overpotential is lower than the charge-transfer overpotential at low discharge current densities but becomes more dominant at higher current densities. Thus, high-rate dischargeability is mainly controlled by the diffusion behavior rather than by the charge-transfer reaction.20
21 This explains the large and sudden voltage drop near the completion of the discharge process. From Fig. 5b, the lithium-ion diffusion in the cathode contributes to almost all the battery's discharge capacity, despite the different discharging current densities (the voltage drop of the cathode is much larger than the drop of the anode near the completion of the discharge process). This relationship shows that to improve high-rate properties of an ALB, the cathode may be the key to start with, e.g., by substituting smaller  particles to shorten diffusion paths for lithium ions. However, the discharge capacity of smaller discharge current densities (i.e., 0.2 C) comes from both the anode and cathode, not only from the cathode as in discharge at large current densities. Therefore, the battery designed to have an appropriate A/C ratio is to have the best contributions from both the electrodes and so during low discharge current, lithium ions are allowed enough time to diffuse from the inside of the electrode to the surface. Diffusion resistance only dominates near the completion of discharge, where the lithium ion concentration is very low.
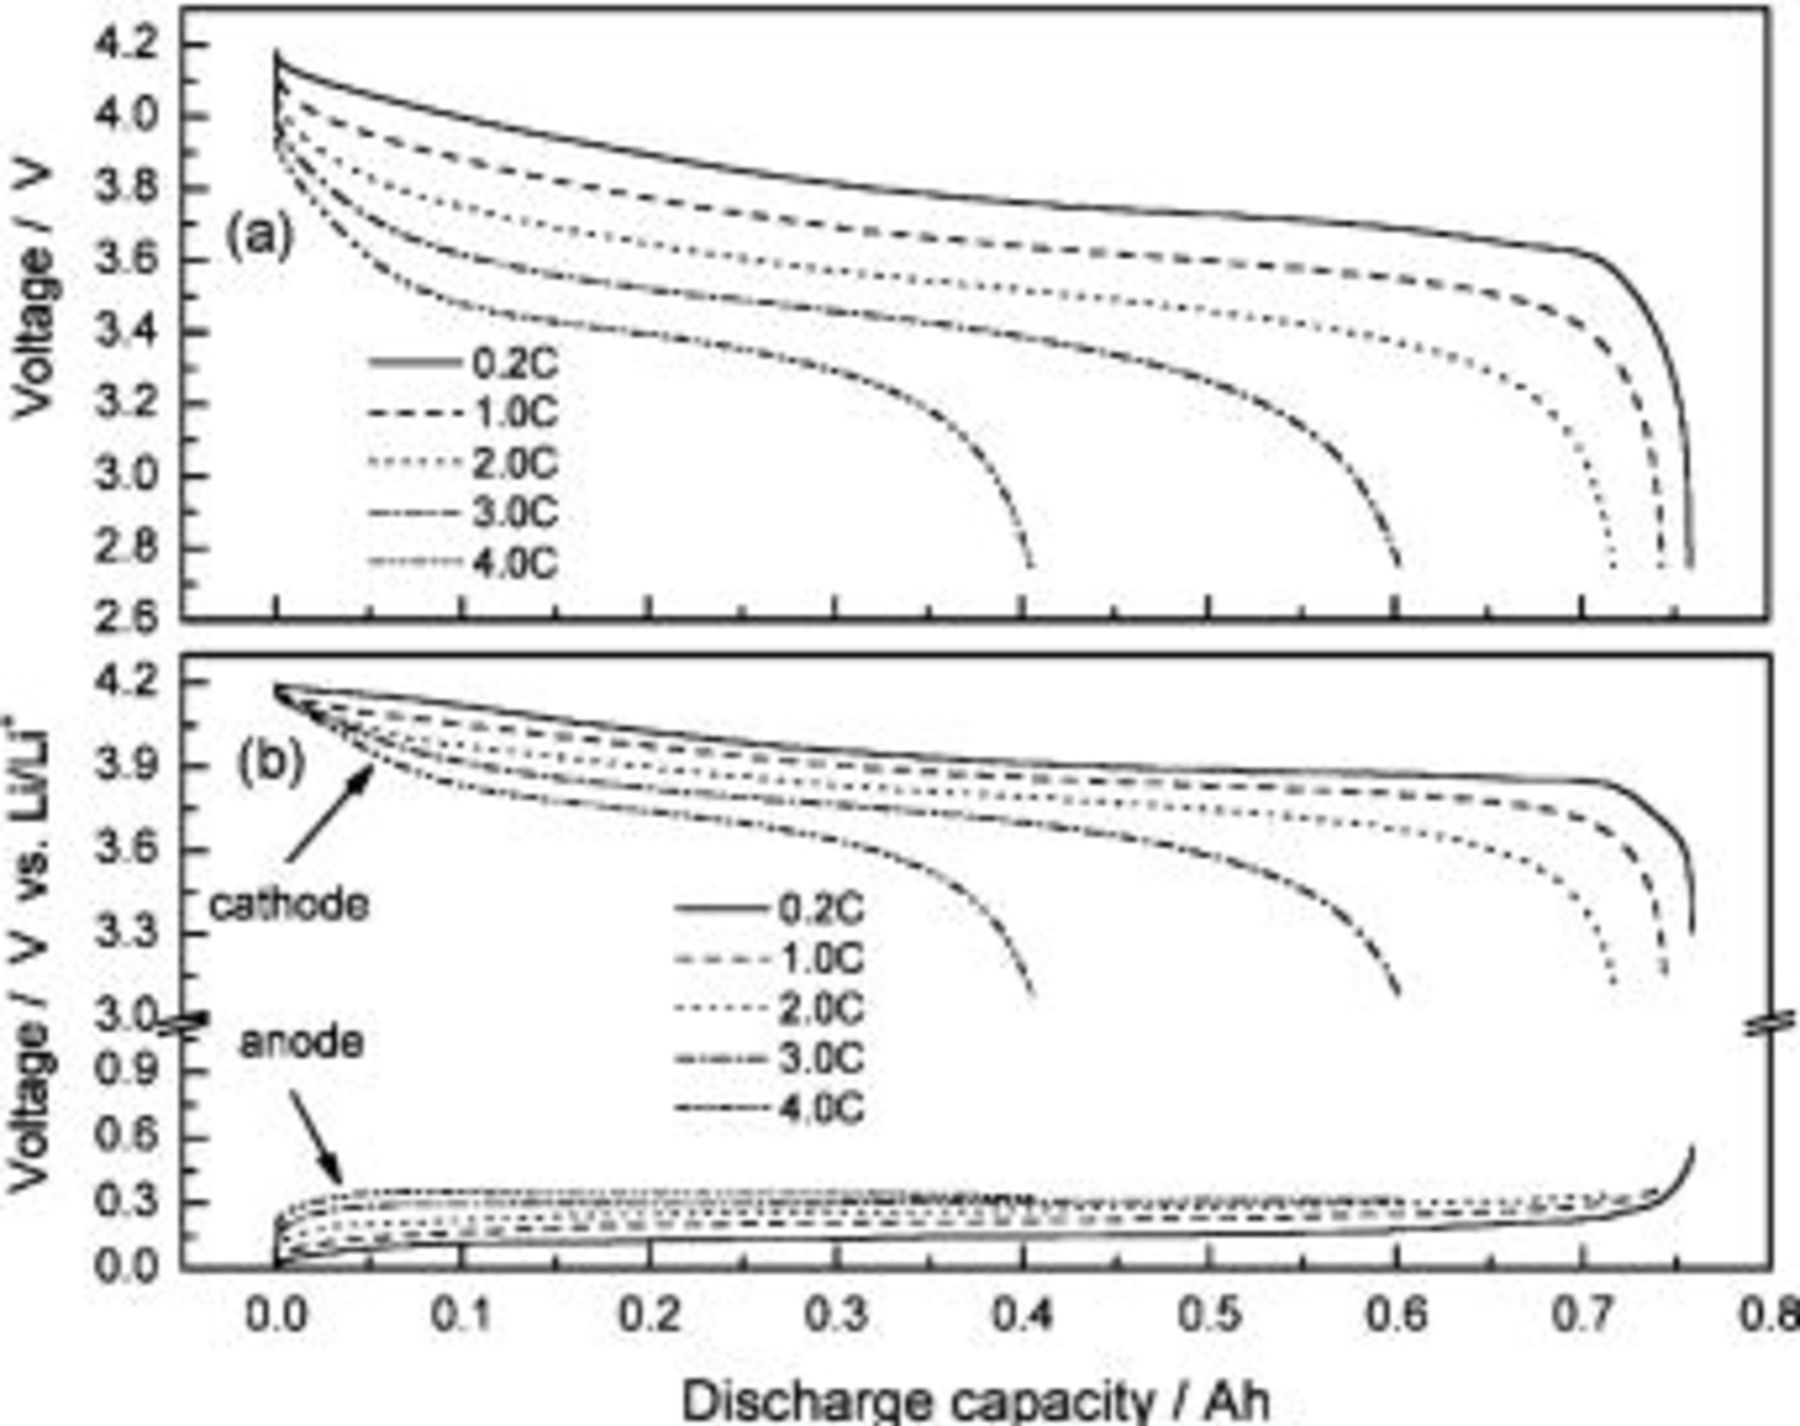
Figure 5. Discharge curves of an ALB under different discharge rates (prior charging rate is 0.2 C).
Analysis on cycle-life performance of ALB with three-electrode system.—
Figure 6 shows the relationship between the discharge capacity and the cycle number of an ALB at 1 C charge/discharge, with the entire battery cutoff voltage of 4.2-2.75 V. A faster decay of the discharge capacity occurs at the beginning of the cycle test, then the decay rate slows down. To clearly distinguish the separate contributions by the anode and cathode, changes in the open-circuit voltage (OCV, vs.  with cycling of the electrodes at the fully charged state shown in Fig. 6 are studied. The OCV of the cathode increases with cycle number, from 4.20 V at the first cycle to 4.285 V at the 200th cycle, and the rate of increase is highest near the beginning. Other researches propose that
  materials start to deteriorate structurally when the voltage is charged to higher than 4.20 V (vs.
  and lithium ions consequently cannot intercalate/deintercalate into the cathode.12 The EDS pattern of an anode after 200 cycles in Fig. 7 demonstrates the presence of cobalt element. A plausibility is that after the deterioration of the
  structure, cobalt has been dissociated and deposited over the MCMB surface via the charge/discharge process.
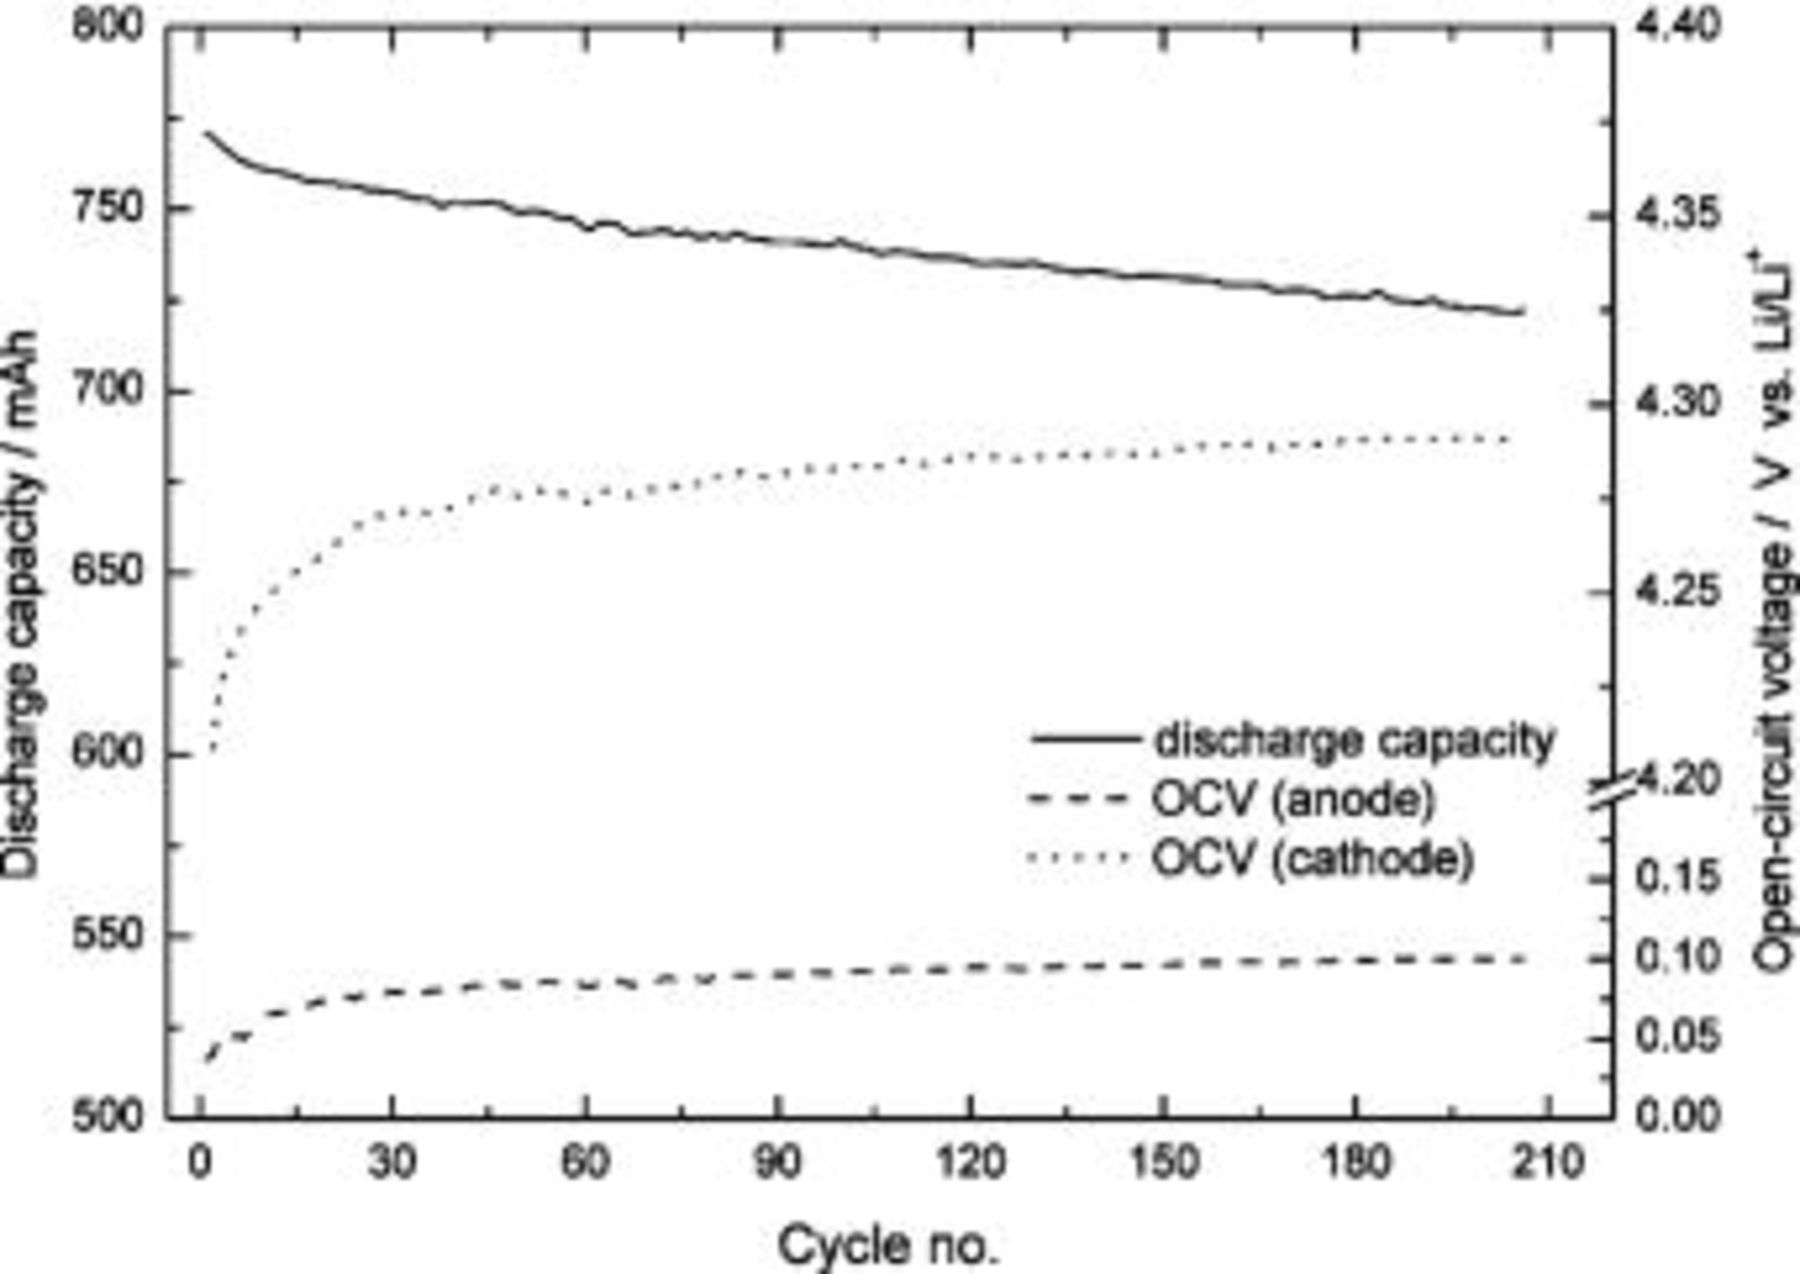
Figure 6. Discharge capacity and OCV of the anode and cathode vs. cycle number of an ALB. ALB was charged and discharged at 1 C current, and the OCV values of the anode and cathode with respect to the reference electrode were taken at the fully charged condition.
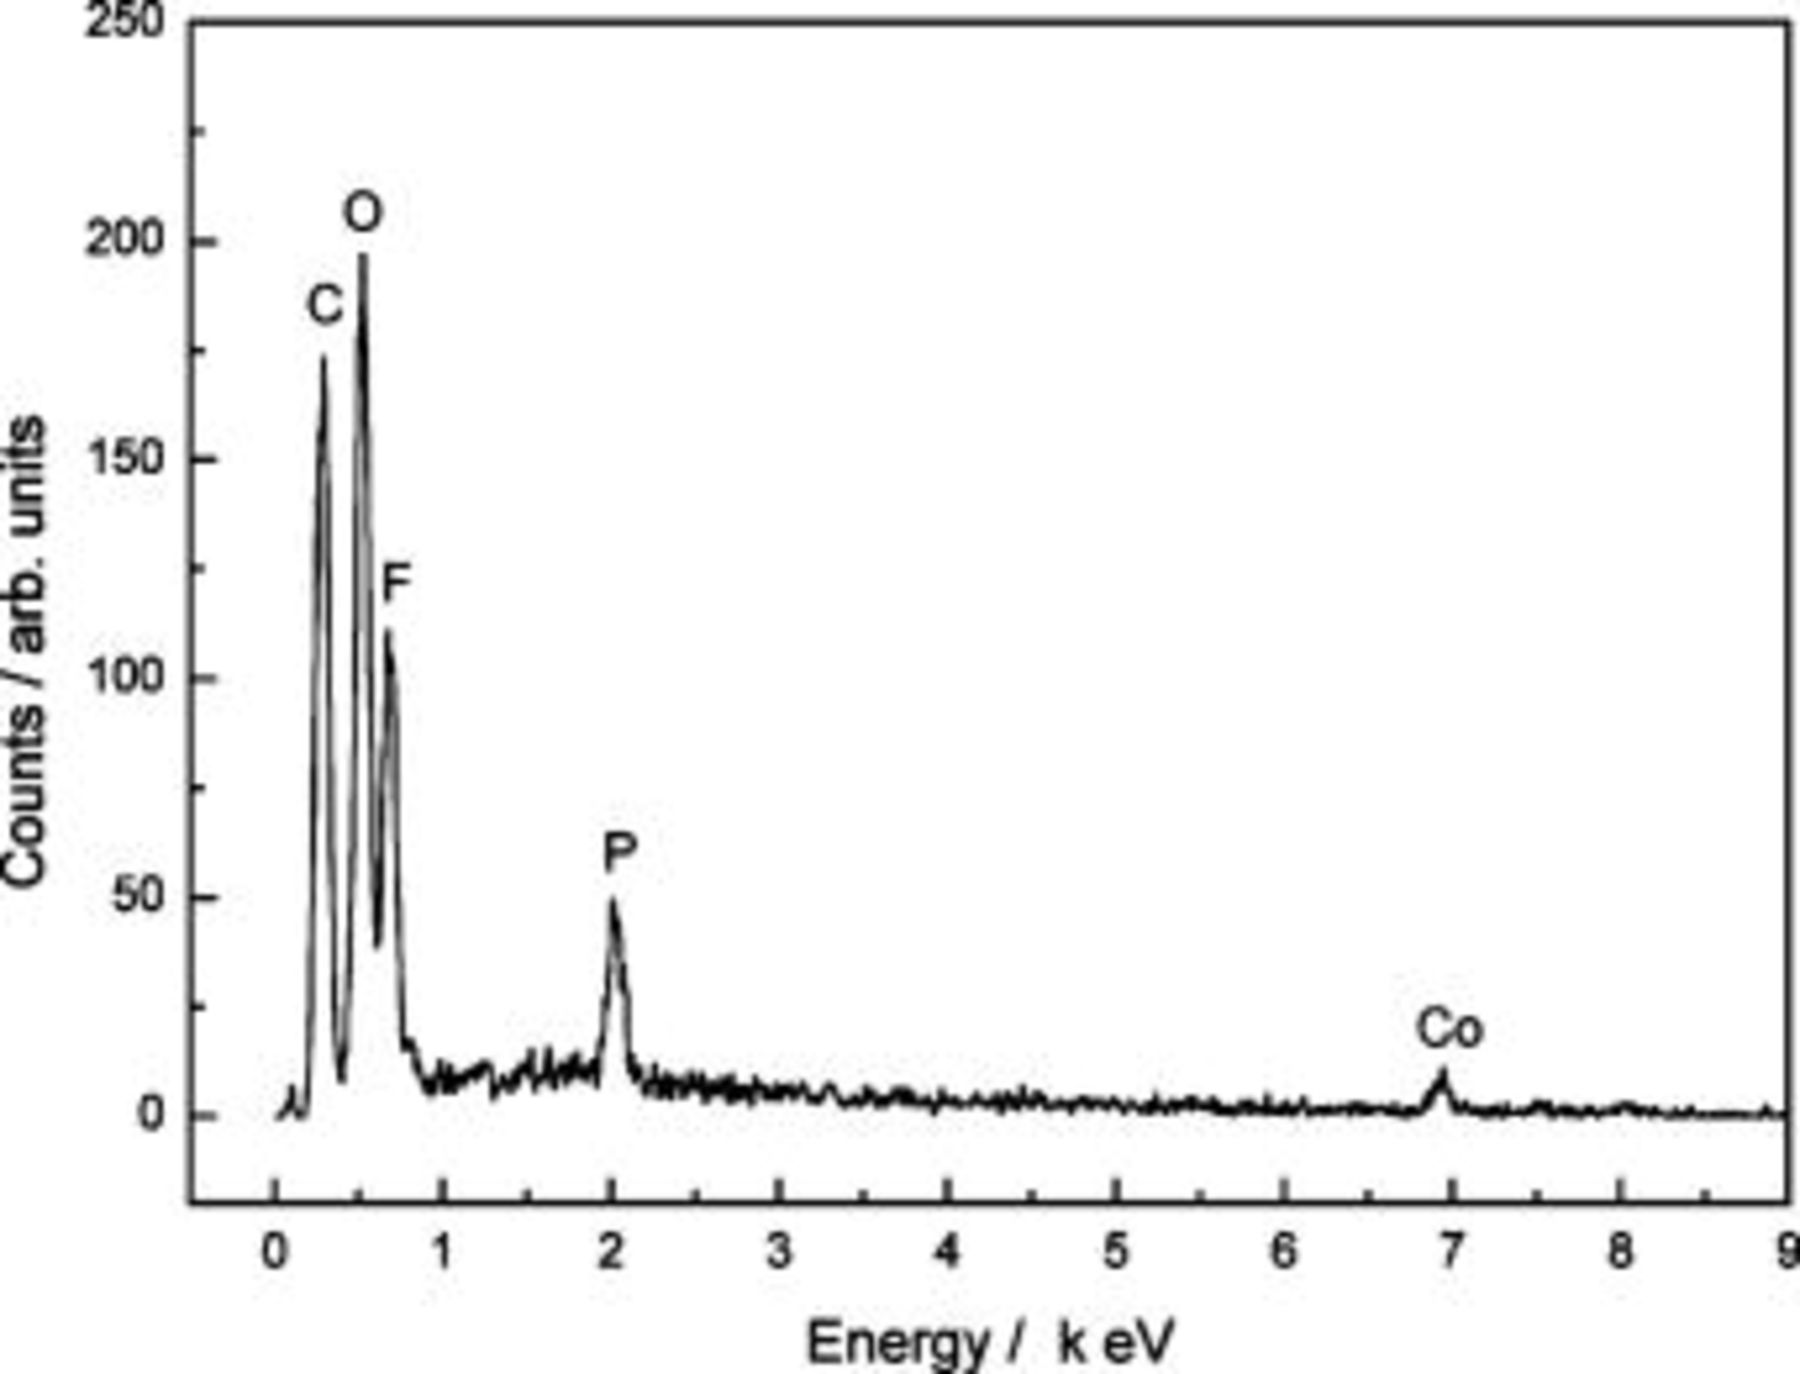
Figure 7. EDS pattern of an anode after 200 charge/discharge cycles.
Another factor contributing to the capacity decay is the loss of reversible lithium ions. This irreversible loss causes the OCV of an anode  to increase (Fig. 6), because after cycling the concentration of lithium ions in the MCMB decreases.
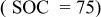
From Fig. 8a, the discharge curves of a three-electrode ALB clearly show that the discharge voltage decreases with increasing cycle number, referring to an increase in the internal resistance (the sum of the anode, electrolyte, and cathode resistance contribution) with respect to time. The voltage curves of the anode and cathode with respect to the reference electrode in Fig. 8b show that the change in anode voltage with cycling is small, but the change in cathode voltage is large. The difference in the cathode voltage accounts mainly for the decrease in the entire ALB's discharge voltage. With the use of the reference electrode and the EIS technique, the componential contributions of the electrolyte, SEI film, and charge-transfer reaction in the cathode may be determined and analyzed. Figure 9 shows the EIS measurement of an ALB  at the first cycle and the 200th cycle. Changes in the anode (Fig. 9a) are small compared with changes in the cathode (Fig. 9b). Results of the corresponding equivalent circuit simulation listed in Table II show that for the anode, the SEI resistance increases from 0.008 to 0.01 Ω, and the charge-transfer resistance from 0.006 to 0.009 Ω; whereas, for the cathode, the SEI resistance increases from 0.007 to 0.01 Ω and the charge-transfer resistance from 0.12 to 0.27 Ω. Clearly, the cathode is responsible for the increase in the internal resistance of an ALB.
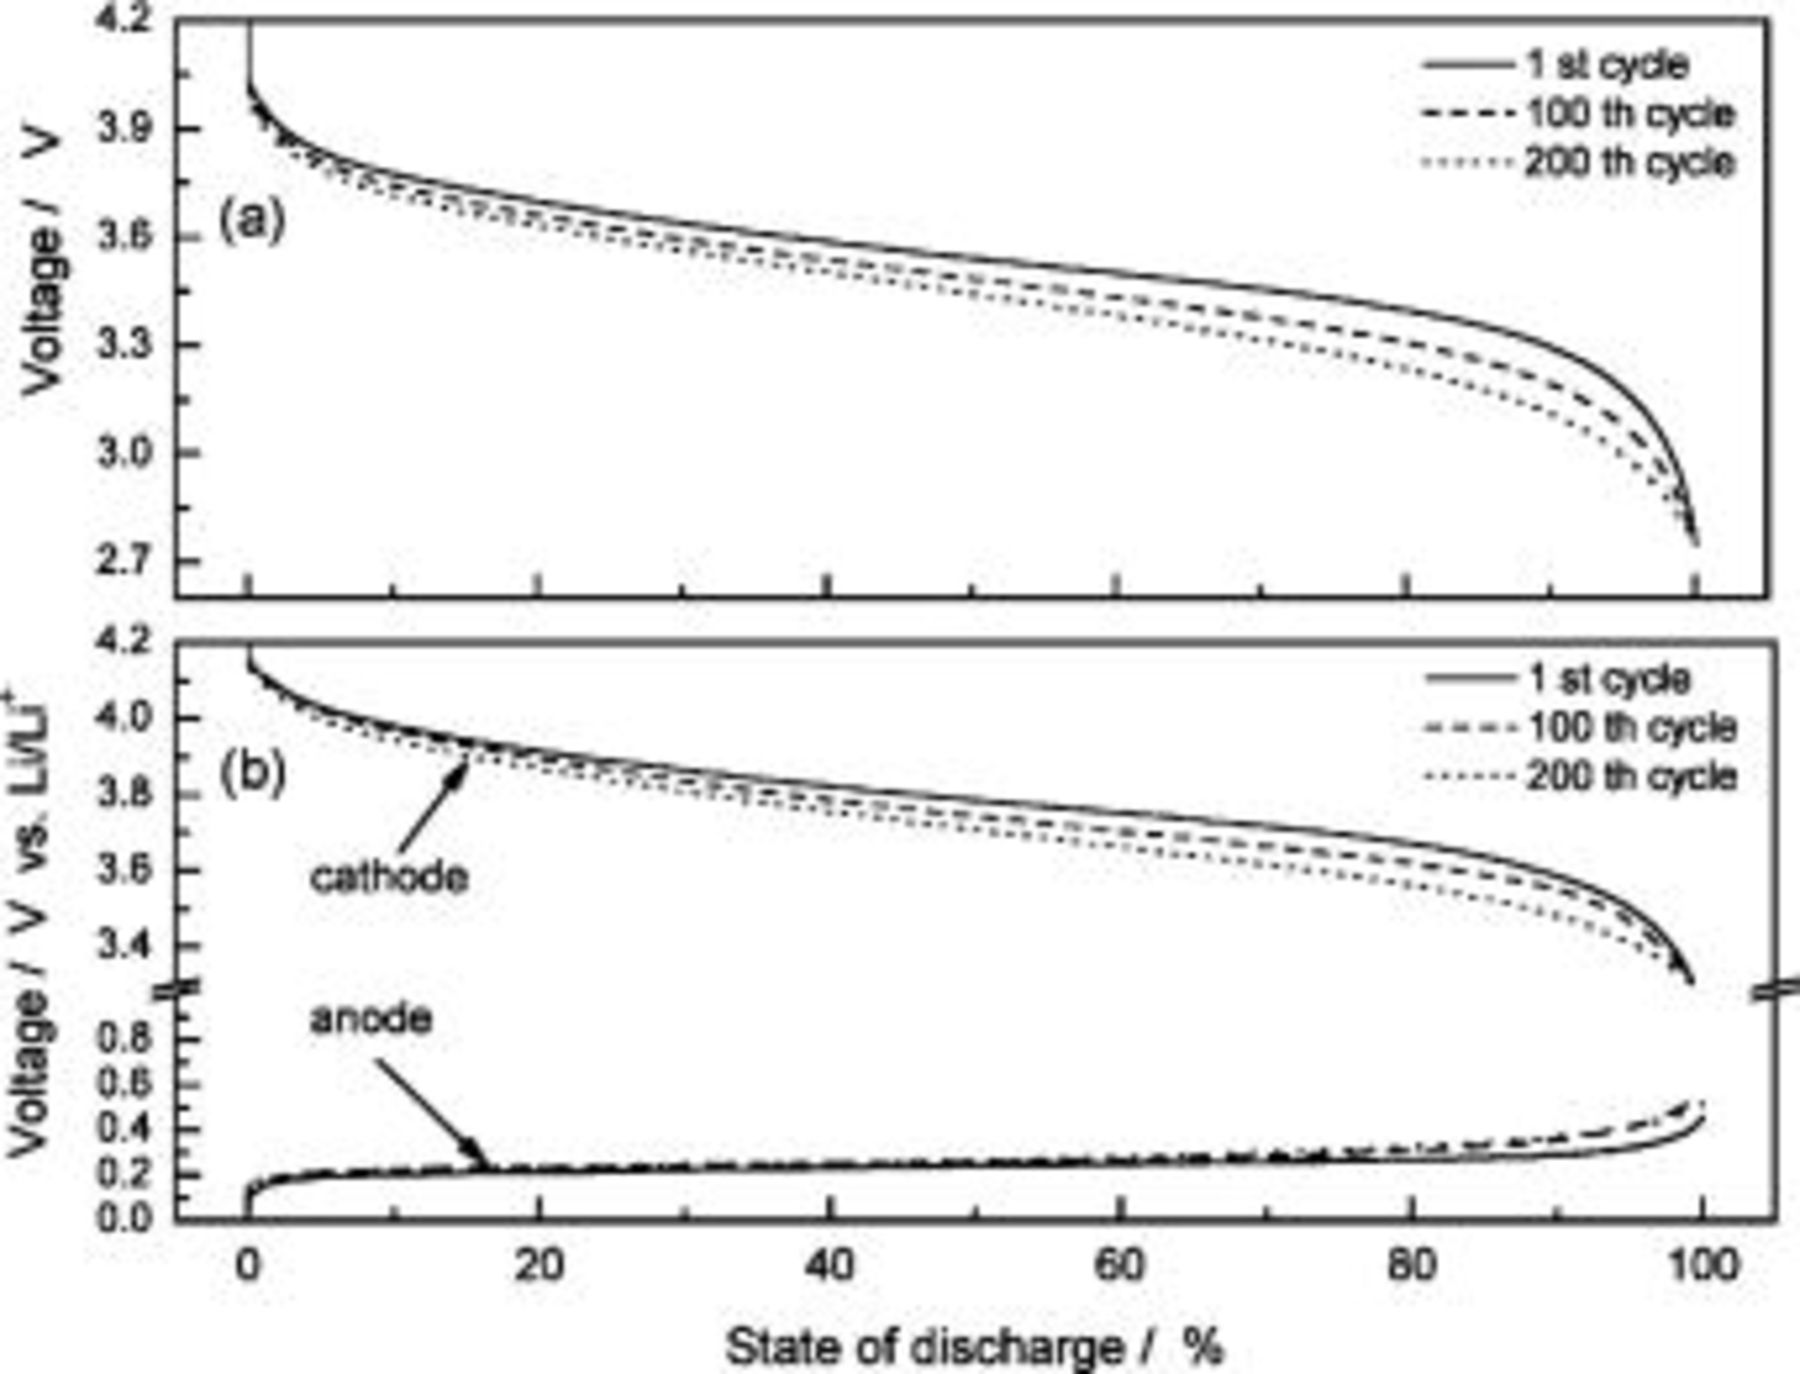
Figure 8. Discharge curves of (a) anode to cathode and (b) each of the anodes and cathodes with respect to the reference electrodes of a three-electrode ALB at different cycles.
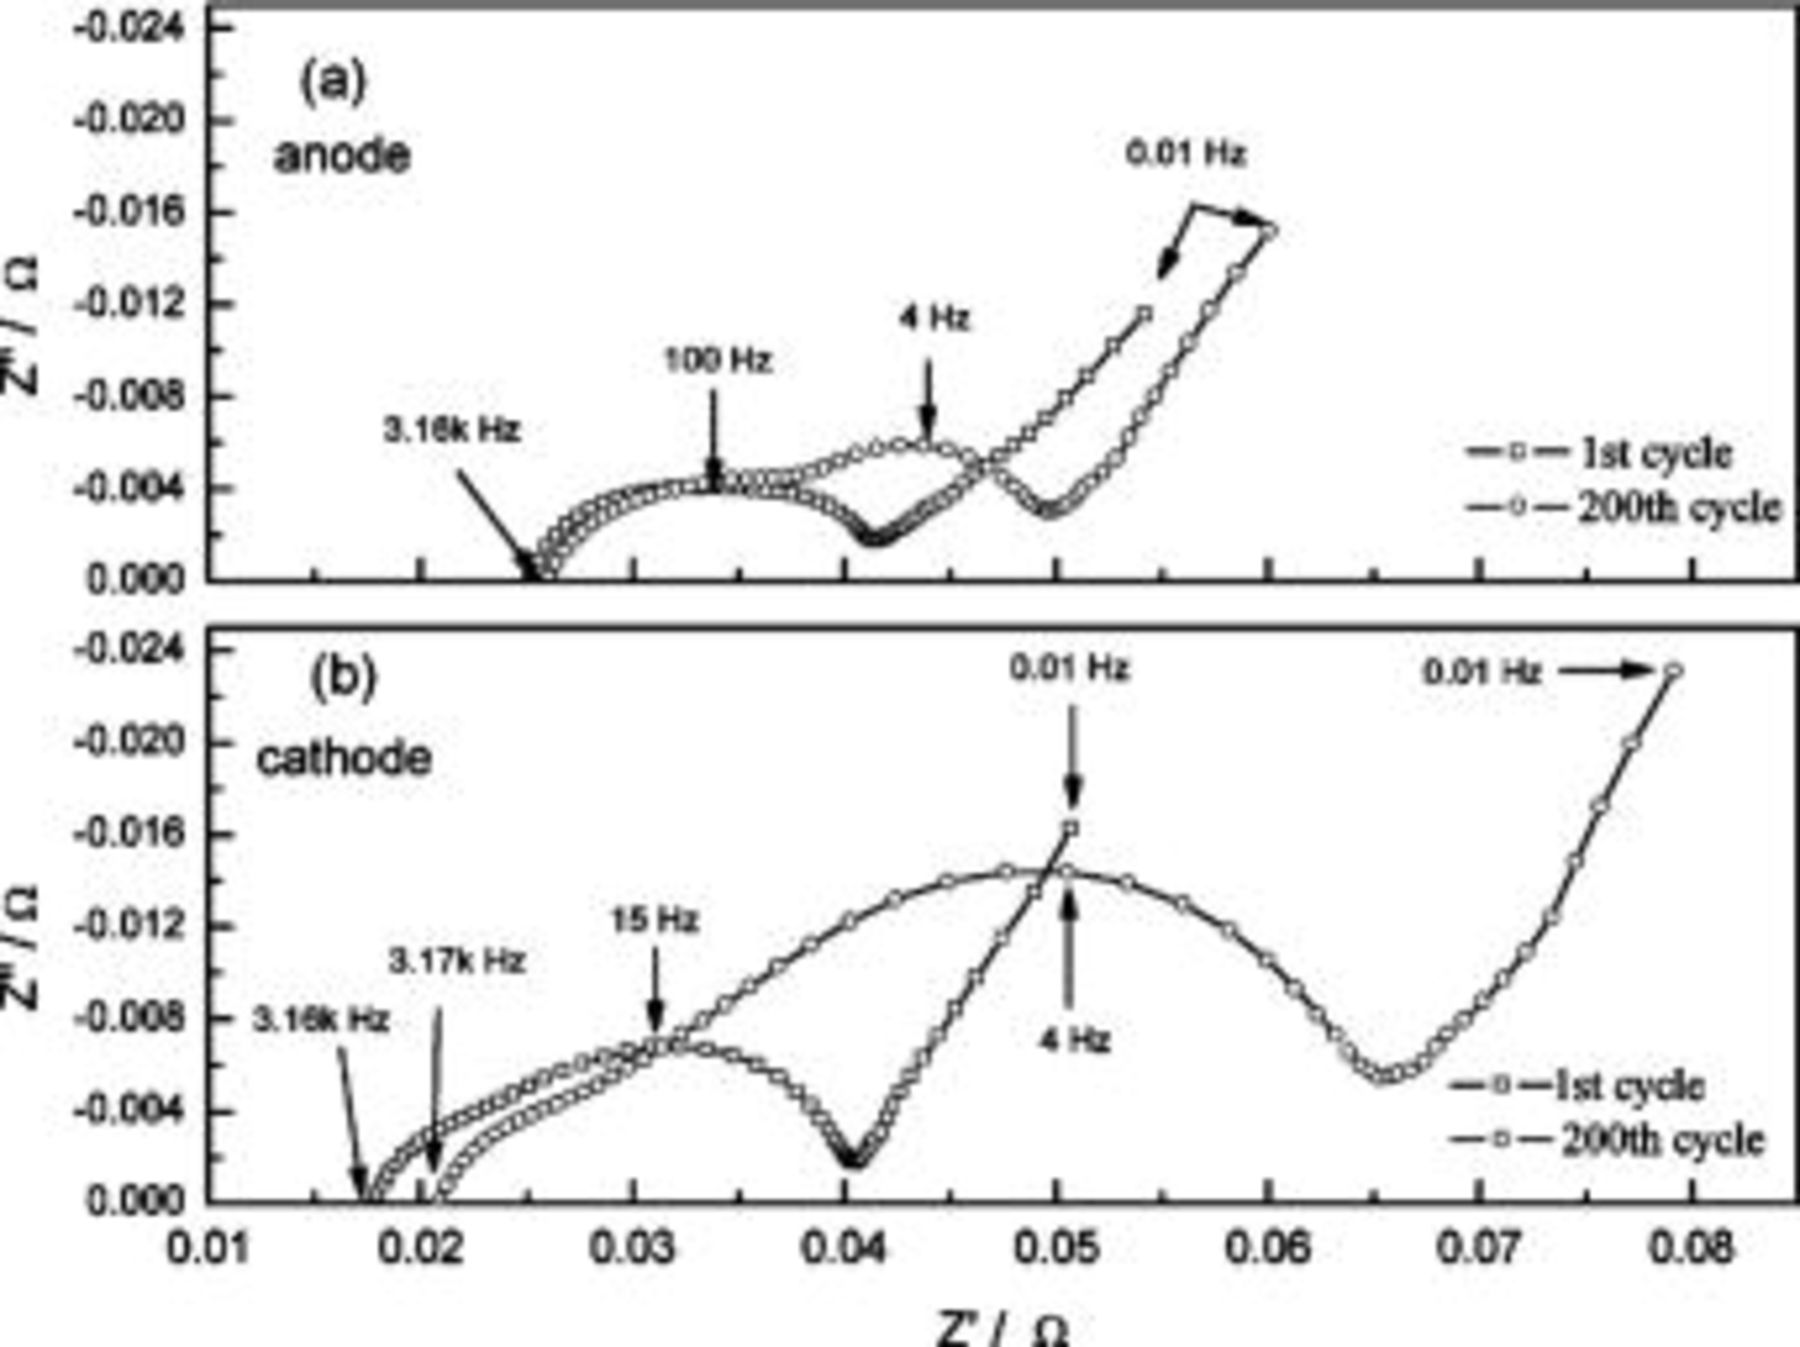
Figure 9. EIS measurement of (a) the anode and (b) the cathode at 1st cycle and 200th cycle 
Table II.
| Simulation results obtained from EIS data of equivalent circuits in Fig. 9. | ||||||||
|---|---|---|---|---|---|---|---|---|
| Electrodes |
 (Ω) (Ω) |
 (F) (F) |
 (Ω) (Ω) |
 (F) (F) |
 (Ω) (Ω) |
 (F) (F) |
 (Ω) (Ω) | W (Ω) |
| Anode(1st cycle) | 0.0238 | 0.0235 | 0.0033 | 0.1250 | 0.0048 | 1.1450 | 0.0058 | 19.6821 |
| Anode(200th cycle) | 0.0226 | 0.0241 | 0.0041 | 0.2209 | 0.0062 | 3.1090 | 0.0089 | 34.3326 |
| Cathode(1st cycle) | 0.0146 | 0.0698 | 0.0068 | — | — | 0.7033 | 0.0123 | 3.8459 |
| Cathode(200th cycle) | 0.0207 | 0.0639 | 0.0099 | — | — | 1.0720 | 0.0273 | 3.8858 |
Low-temperature performance of ALB.—
Figure 10a shows the voltage curves of an ALB discharged under different temperatures (25,−10,−20°C). The discharge capacity is dependent on the temperature of operation. The capacity decreases with the temperature. An ALB with 760 mAh at 25°C can only discharge 630 mAh at −20°C, which is only 83% of the original capacity value. The discharge curves also show that the voltage decreases instantly with decreasing temperature, because the battery's polarization (resistance) increases. The discharge curves of the anode and cathode with respect to the reference electrode are shown in Fig. 10b. The anode discharge curve at −20°C has a large deviation from the room-temperature curve at the beginning of the discharge process (higher SOC), indicating the importance (in terms of battery performance) of the anode in low-temperature performance. However, the influence of the cathode becomes noticeable near the end of discharge where the deviation is large. The behavior of low-temperature discharge is very briefly and roughly described here in terms of voltage curves and roles of the anode and cathode. Many important parameters, e.g., electrolyte resistance, film resistance, and charge-transfer resistance, are yet to be studied, and these are all related to electrolyte constitution, electrode material selection, and designing and manufacturing processes.
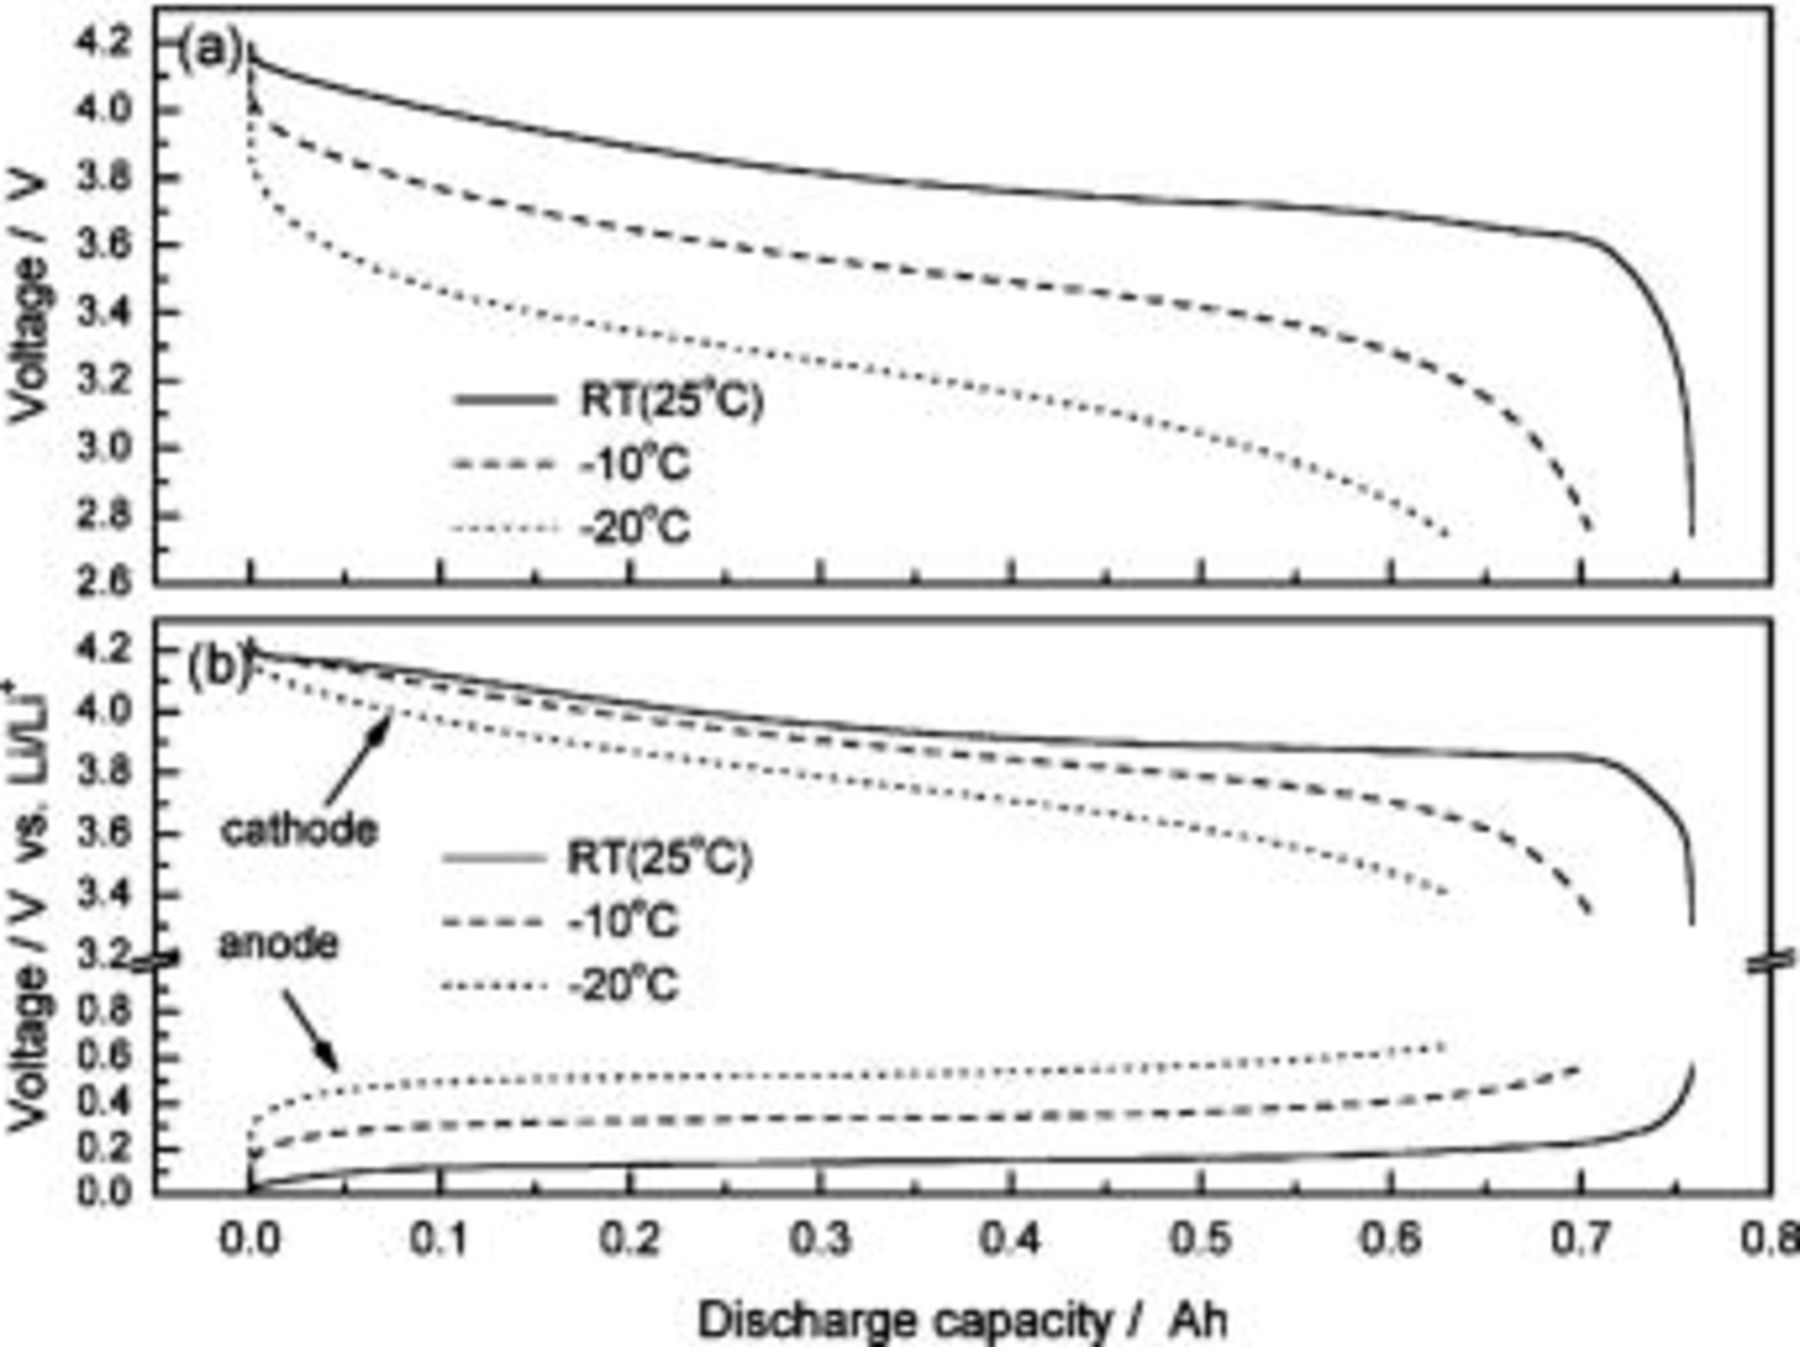
Figure 10. Discharge curves of (a) anode to cathode and (b) each of the anodes and cathodes with respect to the reference electrodes of a three-electrode ALB under different temperatures.
Figure 11 shows the changes in resistance of different components in an ALB at different SOC values (−20°C). The results in Fig. 11 correspond to the results in Fig. 10. Under a fully charged condition  the sum of the anode resistance from different contributing components is 2.8 Ω (Fig. 11a), and the cathode resistance is only 0.4 Ω (Fig. 11b). However, under a fully discharged condition
  the anode resistance is 1.3 Ω, and the cathode resistance is as high as 2.7 Ω. These values directly reflect the discharge behavior of an ALB at low temperature: at the beginning of a discharge process, the anode contributes to most of the resistance; but near the completion of discharge, the cathode becomes the most resistive electrode. The electrolyte resistance in both the anode and cathode contributes very little to the total resistance; the majority comes from the SEI film resistance and the charge-transfer resistance. However, this small resistive effect does not mean that the electrolyte is a negligible factor. The electrolyte composition plays an important role in determining the low-temperature performance of lithium-ion cells, both in terms of its ionic mobility and of the formation of suitable SEI films on the surfaces of the carbon anode and transition-metal oxide cathode. Characteristics of these SEI films, such as porosity and electronic and ionic conductivity, determine the kinetics of Li intercalation and thus the performance of a battery; the protective nature of these films dictates the cycle-life performance.22
23 The resistance of the anode mainly comes from the SEI film and charge-transfer reaction, with the prior slightly more resistive. Both the SEI film resistance and charge-transfer resistance reach maximum at full lithiation and decrease as SOC decreases. The cathode resistance, which is totally different from that of the anode, is mainly attributed to the charge-transfer resistance where the minimum occurs at the fully charged state and increases with decreasing SOC. It is then reasonable to conclude that the electrochemical properties of an ALB at low temperature are controlled by the SEI film resistance of the anode and the charge-transfer resistance of both electrodes. Note that different battery designs have different parameters contributing to their low-temperature performance. For example, Nagasubramanian7 has described the low-temperature electrical characteristics of A&T Li-ion cells and has concluded that the increase in cell resistance mostly comes from the cathode electrolyte interface and that very little comes from either the anode-electrolyte interface or from the ohmic resistance of the cell. Based on the work here, to improve a battery's low-temperature performance, it would be important to obtain a suitable electrolyte. Both the film resistance and charge-transfer resistance of the anode are significant at low temperature; therefore, a suitable electrolyte may help to form a less resistive SEI and, by changing the surface properties, the charge-transfer behavior would likely improve. As for improving the cathode behavior where charge-transfer resistance is the dominating resistance, one can change the surface properties of cathode materials (i.e., increase the surface area by decreasing the particles' diameter) to change and improve the properties of the cathode.
the anode resistance is 1.3 Ω, and the cathode resistance is as high as 2.7 Ω. These values directly reflect the discharge behavior of an ALB at low temperature: at the beginning of a discharge process, the anode contributes to most of the resistance; but near the completion of discharge, the cathode becomes the most resistive electrode. The electrolyte resistance in both the anode and cathode contributes very little to the total resistance; the majority comes from the SEI film resistance and the charge-transfer resistance. However, this small resistive effect does not mean that the electrolyte is a negligible factor. The electrolyte composition plays an important role in determining the low-temperature performance of lithium-ion cells, both in terms of its ionic mobility and of the formation of suitable SEI films on the surfaces of the carbon anode and transition-metal oxide cathode. Characteristics of these SEI films, such as porosity and electronic and ionic conductivity, determine the kinetics of Li intercalation and thus the performance of a battery; the protective nature of these films dictates the cycle-life performance.22
23 The resistance of the anode mainly comes from the SEI film and charge-transfer reaction, with the prior slightly more resistive. Both the SEI film resistance and charge-transfer resistance reach maximum at full lithiation and decrease as SOC decreases. The cathode resistance, which is totally different from that of the anode, is mainly attributed to the charge-transfer resistance where the minimum occurs at the fully charged state and increases with decreasing SOC. It is then reasonable to conclude that the electrochemical properties of an ALB at low temperature are controlled by the SEI film resistance of the anode and the charge-transfer resistance of both electrodes. Note that different battery designs have different parameters contributing to their low-temperature performance. For example, Nagasubramanian7 has described the low-temperature electrical characteristics of A&T Li-ion cells and has concluded that the increase in cell resistance mostly comes from the cathode electrolyte interface and that very little comes from either the anode-electrolyte interface or from the ohmic resistance of the cell. Based on the work here, to improve a battery's low-temperature performance, it would be important to obtain a suitable electrolyte. Both the film resistance and charge-transfer resistance of the anode are significant at low temperature; therefore, a suitable electrolyte may help to form a less resistive SEI and, by changing the surface properties, the charge-transfer behavior would likely improve. As for improving the cathode behavior where charge-transfer resistance is the dominating resistance, one can change the surface properties of cathode materials (i.e., increase the surface area by decreasing the particles' diameter) to change and improve the properties of the cathode.
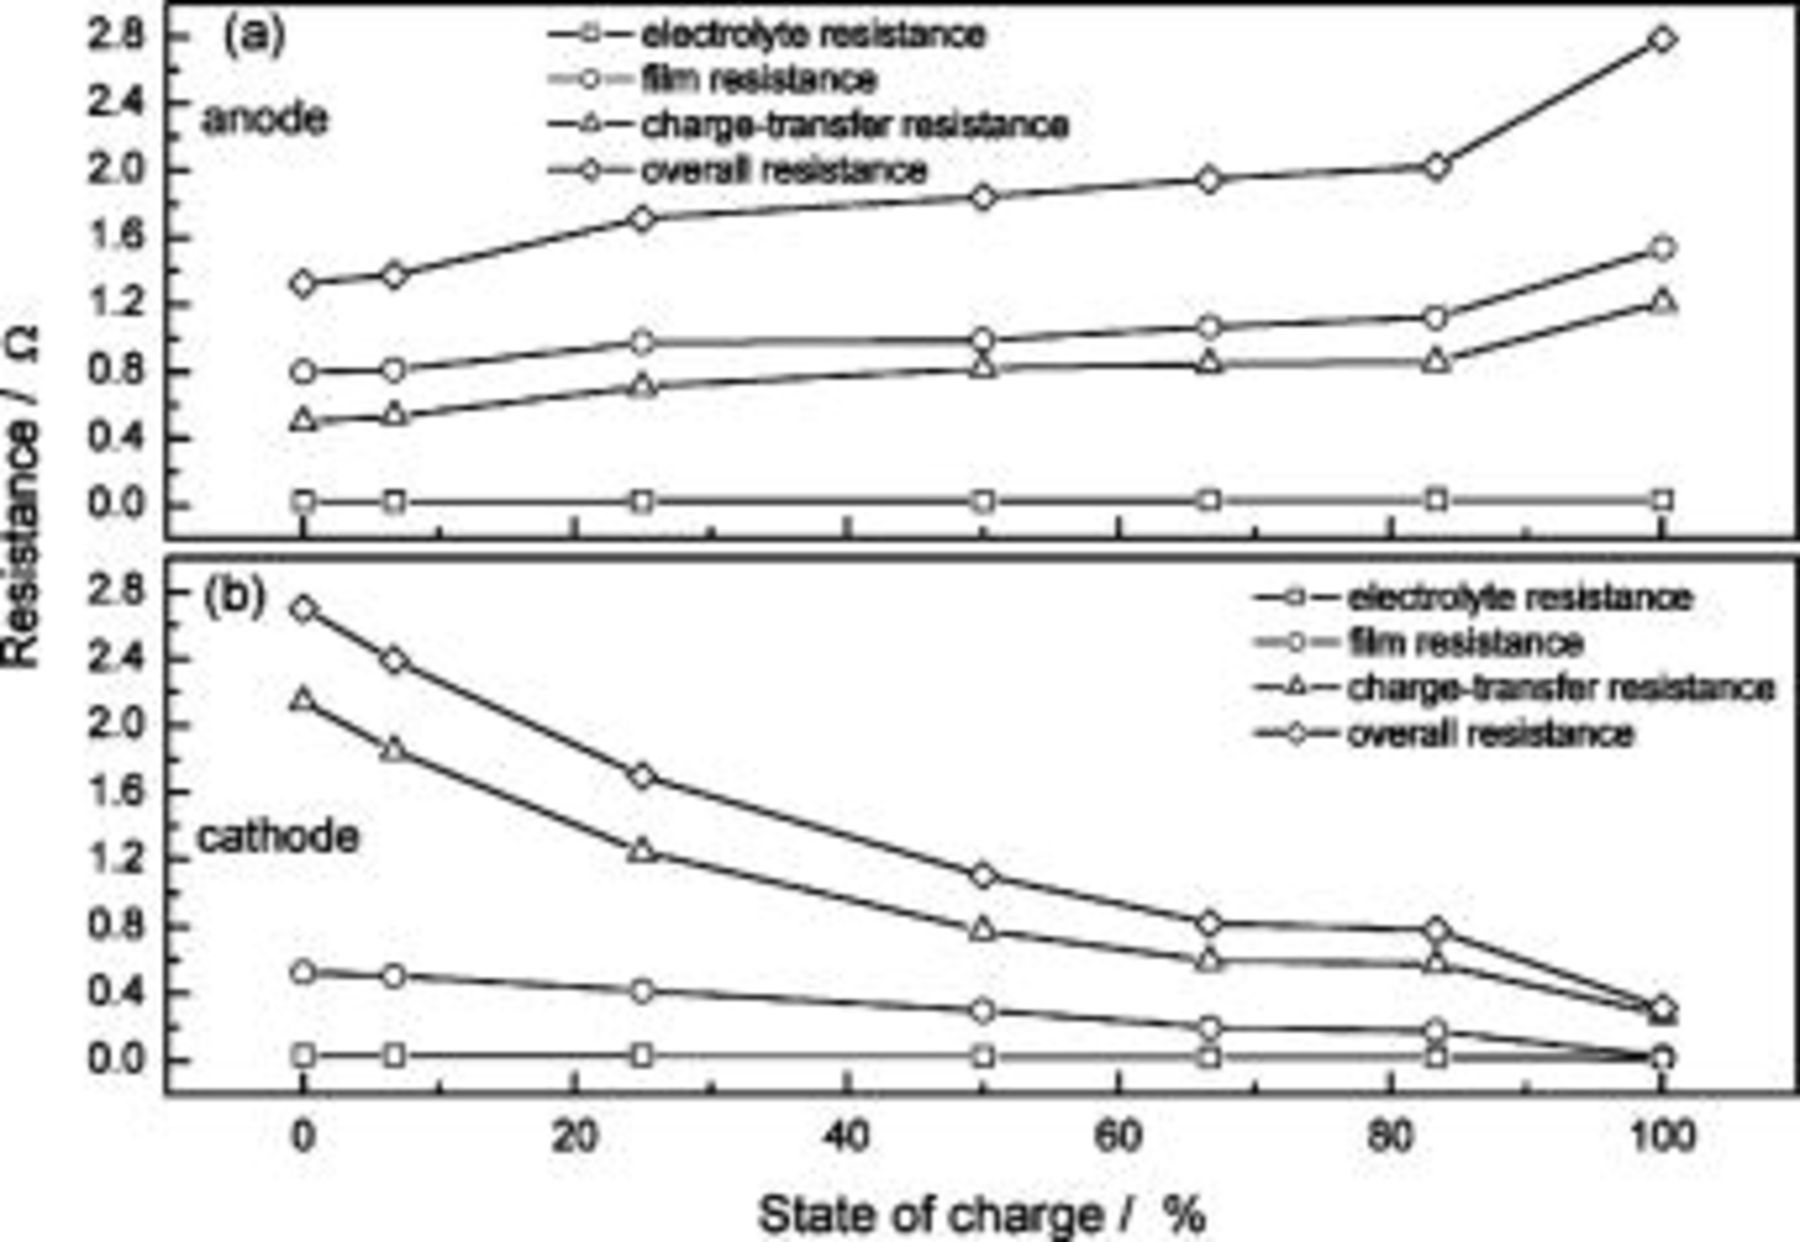
Figure 11. Changes in resistance of (a) anode and (b) cathode in an ALB at different SOC values (−20°C).
Conclusions
The method of an ALB three-electrode system has been proposed and applied to obtain a more in-depth understanding of the lithium-ion battery electrochemical mechanism. From the voltage changes of the anode and cathode with respect to the reference electrode, a battery's A/C ratio may be determined on its propriety. If the A/C ratio is too high, the  voltage becomes higher than 4.2 V at the fully charged state, leading to deterioration of the material structure. If the A/C ratio is too low, a voltage plateau of lithium dissolution during discharge forms, which indicates the deposition of lithium over the MCMB surface. EIS measurements show that both the SEI film resistance and charge-transfer resistance of the anode increase with increasing SOC and reach maximum at full lithiation. Contrary to this behavior, both the film resistance and charge-transfer resistance of the cathode decrease with increasing SOC and reach maximum when fully discharged. The SEI film resistance of the anode contributes to the majority of the whole battery resistance at the fully charged state. At the fully discharged state, the resistance comes from predominantly the cathode charge-transfer resistance. The capacity of the ALB has been characterized at various discharge rates. After 200 charge/discharge cycles, the ALB shows very little change in the anode resistance. The most drastic change occurs in the cathode resistance, which increases from 0.12 Ω at first cycle to 0.27 Ω at the 200th cycle
  The low-temperature (−20°C) resistance of an ALB is strongly dependent on its SOC and electrodes. When fully charged, the anode resistance and cathode resistance are 2.8 and 0.4 Ω, respectively; but the values change to 1.3 and 2.7 Ω, respectively, when fully discharged. These values clearly suggest that the major contribution of the cell resistance at low temperature comes from the anode at the start of discharge and from the cathode near completion.
The Industrial Technology Research Institute assisted in meeting the publication costs of this article.