


Abstract
Infrared spectra for the O-H stretching vibration,  , region were studied for Sc- and Y-doped
  and Y-doped
  ceramics. For Sc-doped
  and Y-doped
  , two intense
  bands at
  and
and  were observed for the low doping level. With increasing doping level, two
  bands at
  and
and  appeared in addition to the bands at
  and
and  and increased their intensities. However, intensities of the bands at
  and
and  were considerably smaller than those of the bands at
  and
and  . In contrast to Sc-doped
  , four bands at
  ,
,  ,
,  , and
, and  were observed for the low doping level in Y-doped
  ; furthermore, the intensities of the four bands were comparable and independent of Y-doping level. Thus, the two bands at
  and
and  were attributable to the proton bonded to the oxygen between dopant
  and the host Zr ions, i.e.,
  . The bands at
  and
and  were attributed to the proton bonded to the oxygen between the two dopants, i.e.,
  The present results revealed that dopant Y in
  aggregated on an atomic scale and formed the
  cluster even for the low doping level.
Export citation and abstract BibTeX RIS
Materials showing proton conduction are attractive because of their potential applications in fuel cells, hydrogen pumps, and hydrogen sensors. Since Iwahara et al. discovered significant proton conduction at high temperatures in Yb-doped  ,1 the proton conduction of aliovalently doped oxides with perovskite and its related structures has been extensively studied. This effort led to the discovery of many high-temperature proton conductors (HTPCs), e.g., aliovalently doped
  -,
-,  -,
-,  - and
- and  -based materials.2–11 In addition to their applications and key properties for practical use such as conductivity and chemical stability, the dissolution environment and the migration mechanism of protons have been studied.
Infrared (IR) absorption spectroscopy detecting O-H stretching vibrations  is one of the most informative methods to study the dissolution environment of protons in oxides. An example is the IR study of Sc-doped
  perovskite,12
  , which shows a significant proton conduction below
  and is one of the model compounds of HTPCs. The O-H distance in
  dissolving protons of
  , which was evaluated from the wavenumber of
 , agreed with the value obtained from the neutron diffraction technique12
  and molecular dynamics simulation13
  . For the practical HTPCs, the IR studies previously reported concentrated on the
  -based samples, because the
  -based ceramic showed a fairly high proton conductivity and good chemical stability under reducing and
  atmospheres. Yugami et al. reported the IR spectra for 5 atom % Y-, Er-, Yb- and Sc-doped
  samples, i.e.,
  (
( , Er, Yb, and Sc), in the range of
  and discussed the dissolution site of the protons.14 Two distinct broadened
  bands at around 3300 and
  were observed for the Y-, Er-, and Yb-doped samples. For the Sc-doped sample, one distinct band at around
  was observed and no band was observed at around
  . They deconvoluted the
  bands into four bands and discussed the spectral shape depending on the dopant species in terms of population among the four sites of the proton, respectively corresponding to the four
  bands. Recently, the present authors reported IR spectra in the range of
  for the 5 atom % Y-, In-, and Ga-doped
  ,
,  , and
, and  .15 For all the samples dissolving protons, broad
  bands in the
  range were observed. For the
  -based samples and Ga-doped
  , two
, two  bands at around 2450 and
  were observed in addition to the bands at
  . The characteristics of the IR spectra in the
  region previously reported for the 5 atom % trivalent cation doped alkaline-earth zirconate proton conductors are summarized as follows: (i) the
  bands at
  were observed for all the alkaline-earth zirconates; (ii) two
  bands at around 2450 and
  were observed in addition to the bands at around
  for the Ga-doped
  and many
  samples; and (iii) for the 5 atom % Sc-doped
  , the
, the  bands at around 2450, and
  were not observed. The O-H distances corresponding to the respective
  bands were found to be
  for
for  ,
,  for
for  , and
, and  for
for  based on the empirical relationship between the wavenumber of the
  and the O-H distance.16 Because the O-H distance of
  corresponding to the bands at
  is large among inorganic hydroxide and hydrates, the appearance of
  bands at around 2500 and
  in the alkaline-earth zirconates seems unusual.
The previous IR studies for HTPCs concentrated on the 5 atom % trivalent cation-doped samples. In the present investigation, we studied the  bands and intensities of alkaline-earth zirconates upon changing the doping level. The objectives of the present study are (i) to elucidate whether the bands at
  and
and  appear or not upon changing the doping level for the Sc-doped
  and Y-doped
  , in which these bands were not observed for the 5 atom % doped samples, (ii) to elucidate whether the intensities of the bands at
  and
and  increase or not upon changing the doping level for the Y-doped
  , and (iii) to provide a common interpretation for the appearance of the characteristic
  bands in perovskite-type HTPCs.
Experimental
Polycrystalline samples of  (
( , 0.02, 0.05, 0.08, 0.15, 0.20, and 0.30),
  (
( , 0.02, 0.05, 0.08, and 0.10), and
  (
( , 0.05, 0.15, and 0.25) were prepared by a standard ceramic process. Powdered
  (99.99%, Ba:
  ),
),  (99.9%),
  (99.99%,
  ),
),  (99.95%), and
  (99.9%) were used as the starting materials. Raw materials were weighed and mixed using a mortar made of partially stabilized zirconia. To ensure thorough mixing of the powders, ethanol was added during the mixing operation. The dried mixture was calcined in air for
  at
at  . The calcined powder was mixed again by a mortar and pressed into
  disks at
  . The disks were subsequently sintered in air at
  for
for  . The obtained crystalline phases were identified using powder X-ray diffraction (XRD) (MacScience, MXP,17 Cu
  radiation using a curved graphite receiving monochromator). The lattice parameters were calculated using the least-squares procedure. High-purity silicon powder was mixed into the samples to provide an internal standard for the
  correction.
The as-sintered samples of the HTPCs are well known to contain distinct protons18 which are dissolved in the crystal during sintering. Samples without dissolved protons are needed as the starting point for proton dissolution and as a reference material for the IR measurements. Proton-free samples were prepared by heating the as-sintered samples to  for
for  under high vacuum below
  , as described in a previous paper.17 Protons were dissolved into the proton-free samples by annealing at
  for
for  in wet
  gas humidified by water vapor. The partial pressure of water,
  , of the wet
  gases was
  . The wet gases were prepared by passing
  through water at
  .19
.19
The IR spectra were obtained using a diffuse reflection technique for powdered samples. The spectra were recorded at room temperature by a Fourier transform infrared spectrometer (FT/IR-610V, JASCO) with a deuterated L-alanine triglycine sulfate (DLATGS) detector and a diffuse reflection accessory (DR-81, JASCO). The spectrometer was configured with evacuable optical paths, i.e., interferometer, detector, and sample compartments. Coarse sample particles of approximately  were used for the measurements to avoid spectral distortion caused by the
  bands due to the adhesion and adsorption of water on the sample surfaces. Sample particles were obtained by smashing the sinters using a mortar made of partially stabilized zirconia just prior to the measurements. Approximately
  of a sample powder was placed in a spectrometer with all optical paths and then evacuated by a rotary vacuum pump. Measurements were conducted once the optical paths were sufficiently evacuated (approximately
  after the evacuation was started). Absorption bands due to water vapor and
  in the atmosphere were approximately negligible in the present study. Details of the experimental procedure for the IR spectroscopy have been described in a previous paper.17 The diffuse reflectance,
  , which is regarded as approximately equivalent to the transmittance, was obtained using the following equation

where  and
and  are the raw intensity of the diffuse reflection for the sample and reference, respectively. Proton-free undoped
  for the Sc- and Y-doped
  or undoped
  for the Y-doped
  were employed as the reference material.
Results
Samples
For the  with
with  , all the diffractions in the XRD patterns were indexed as those for the orthorhombic perovskite structure (space group
  ). For
  , in addition to the diffractions for the orthorhombic perovskite phase, small diffractions due to impurity phase, which may be
  isostructural of
  , appeared. For
  , the diffractions due to the impurity phase grew. Figure 1a and 1b shows the lattice parameters as a function of the doping level. Changes in the lattice parameters upon doping were small, but lattice parameters
  and
and  distinctly increased upon doping in the range
  . Consequently, it was shown that Sc doping occurred in the
  samples for
  . For the
  with
with  , all the diffractions in the XRD patterns were indexed as those for the orthorhombic perovskite structure. For
  , diffractions due to the impurity
  20 were clearly observed. Lattice parameters
  ,
,  , and
, and  increased with the increasing doping level in the range
  , as shown in Fig. 1a and 1b. Therefore, the
  with
with  was shown as single phases having the orthorhombic perovskite structure. For
  , all the diffractions in the XRD patterns for
  were indexed as those for the cubic perovskite structure (space group
  ). The lattice parameter distinctly increased with the increasing doping level as shown in Fig. 2. Therefore, the samples of
  prepared in the present study are single phases with a cubic perovskite structure. Consequently, the
  with
with  , the
, the  with
with  , and the
  with
with  were subjected to the following IR measurements.
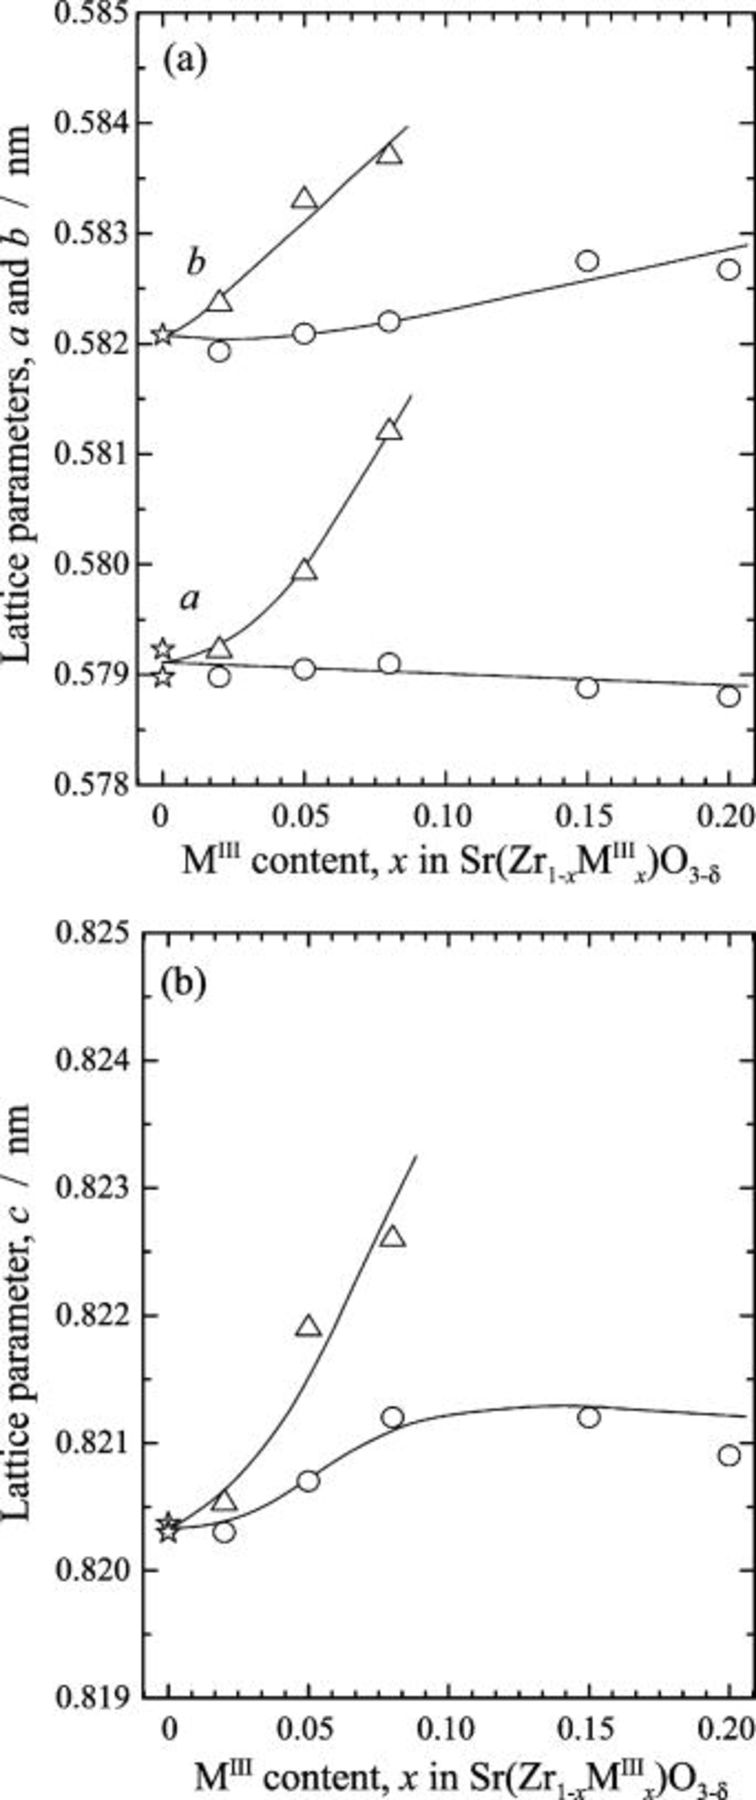
Figure 1. Lattice parameters,  ,
,  , and
, and  , of the orthorhombic perovskite-related phases (space group
  ) of Sc- and Y-doped
  : (○)
: (○)  and (▵)
  ; (a) lattice parameters
  and
and  and (b) lattice parameter
  .
.
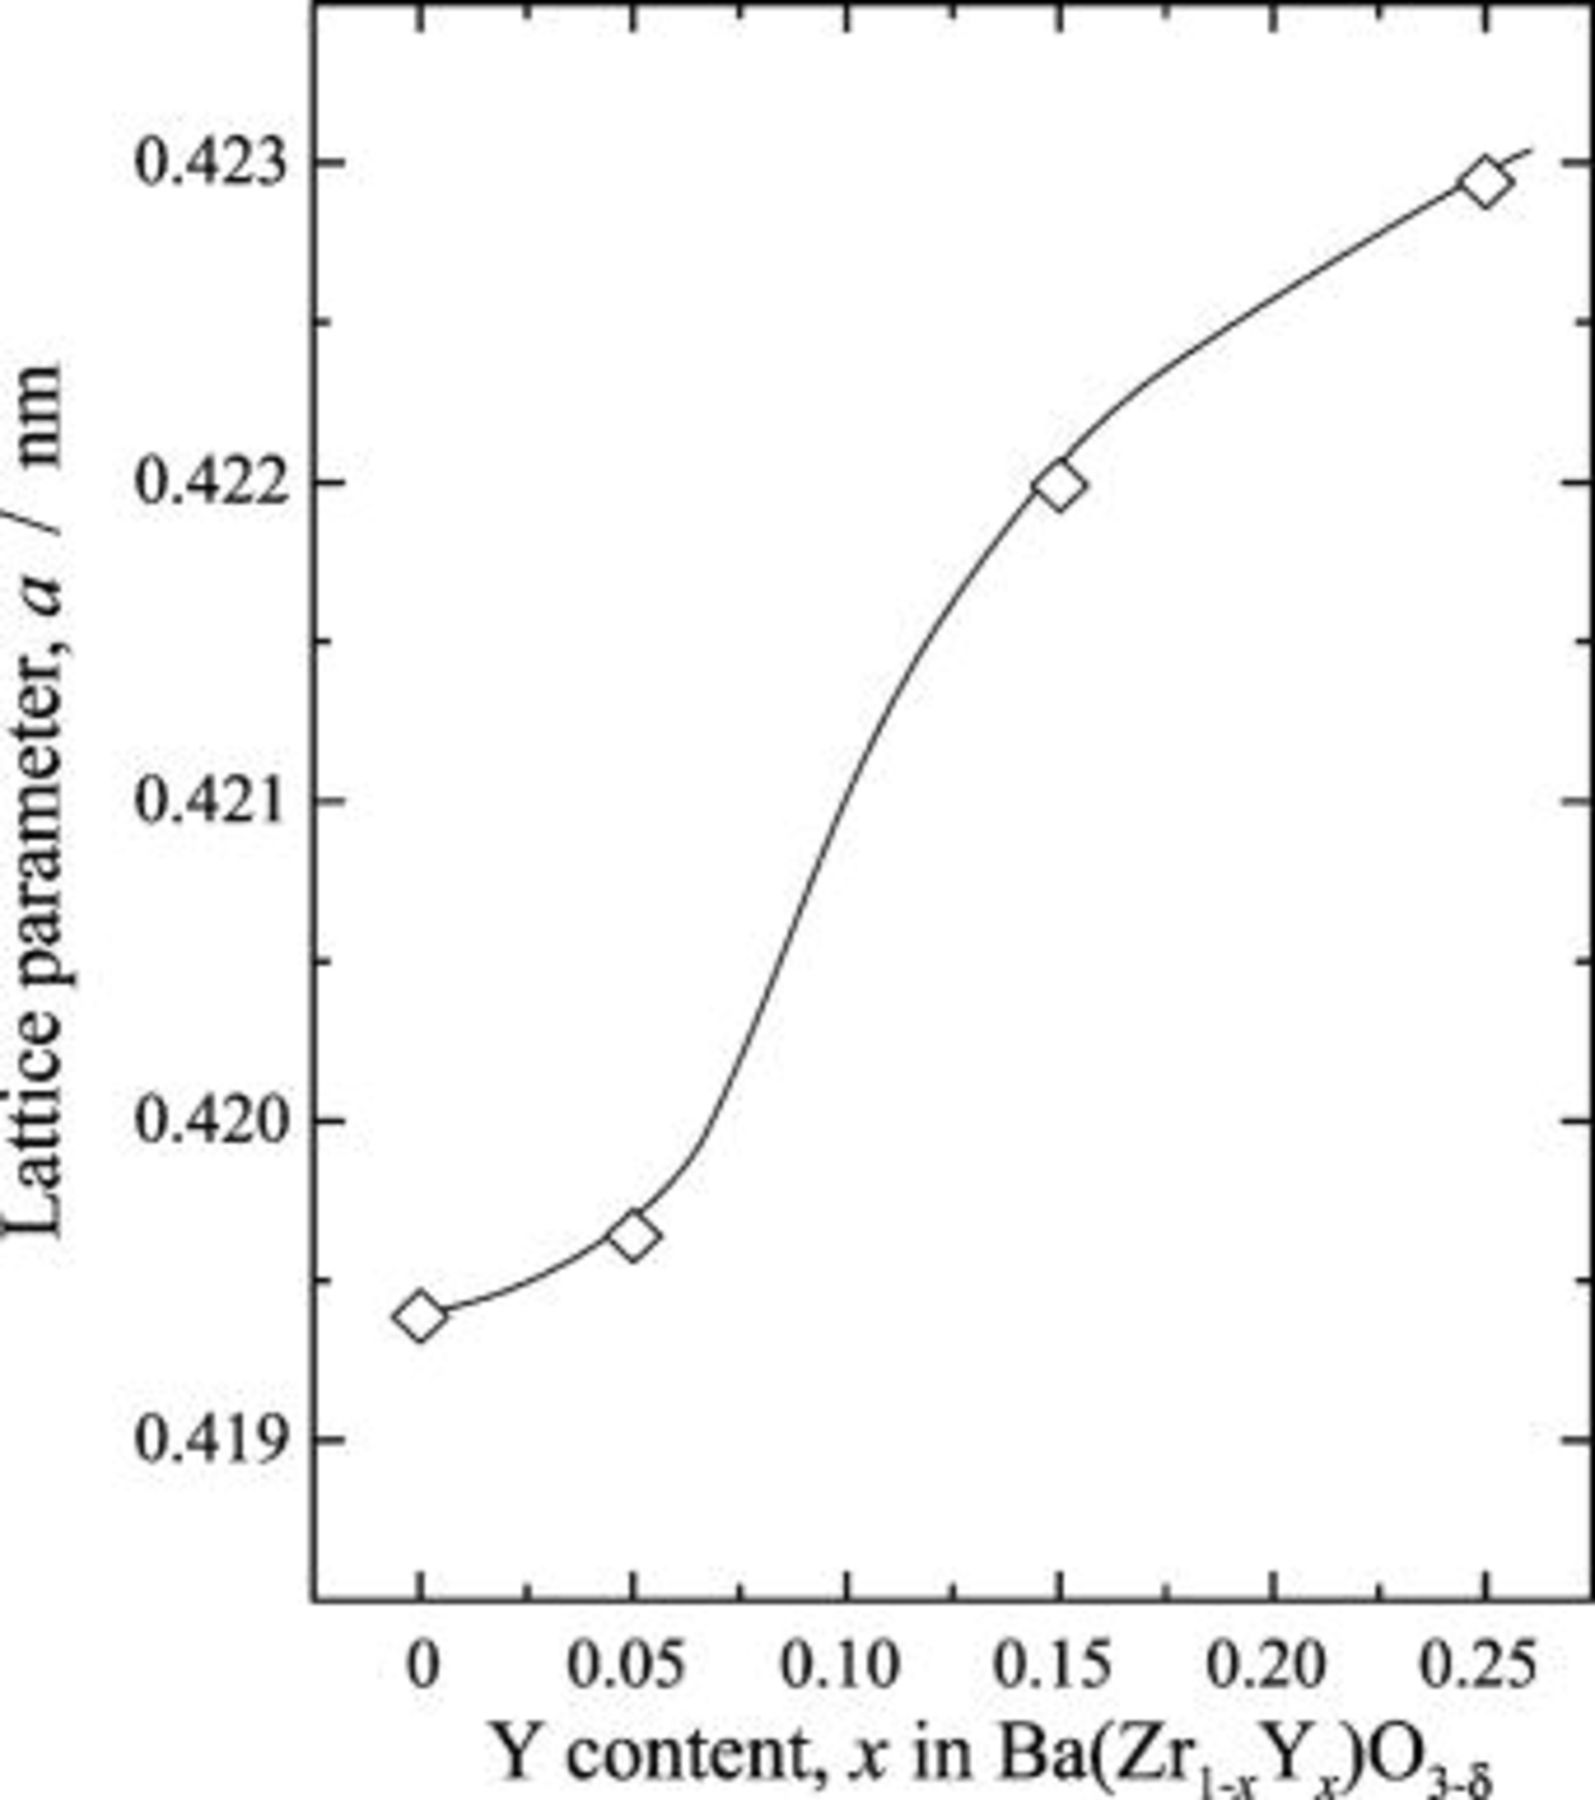
Figure 2. Lattice parameter,  , of the cubic perovskite phases (space group
  ) for the
  systems.
IR spectra
Figure 3 shows the IR spectra for the  region of
  . For
. For  , two
, two  bands were observed at
  and
and  , and no absorption band was observed below
  . The weak absorption at
  was attributed to a combination band.21 The spectrum for
  (Fig. 3b) agreed well with the reported spectrum obtained using the transmission mode for a single crystal.14 The spectral features of the
  with
with  were close to those for the previously reported 5 atom % In- and Ga-doped
  and 5 atom % In- and Y-doped
  .15 For
  , small
  bands at
  and
and  appeared in addition to the bands at
  and
and  . By increasing the Sc-doping level above
  , the absorption intensity for the two
  bands at
  and
and  distinctly increased. It was shown that the
  bands at
  and
and  did not appear for the low Sc-doping level of
  , while these bands grew in the heavily Sc-doped samples of
  .
.
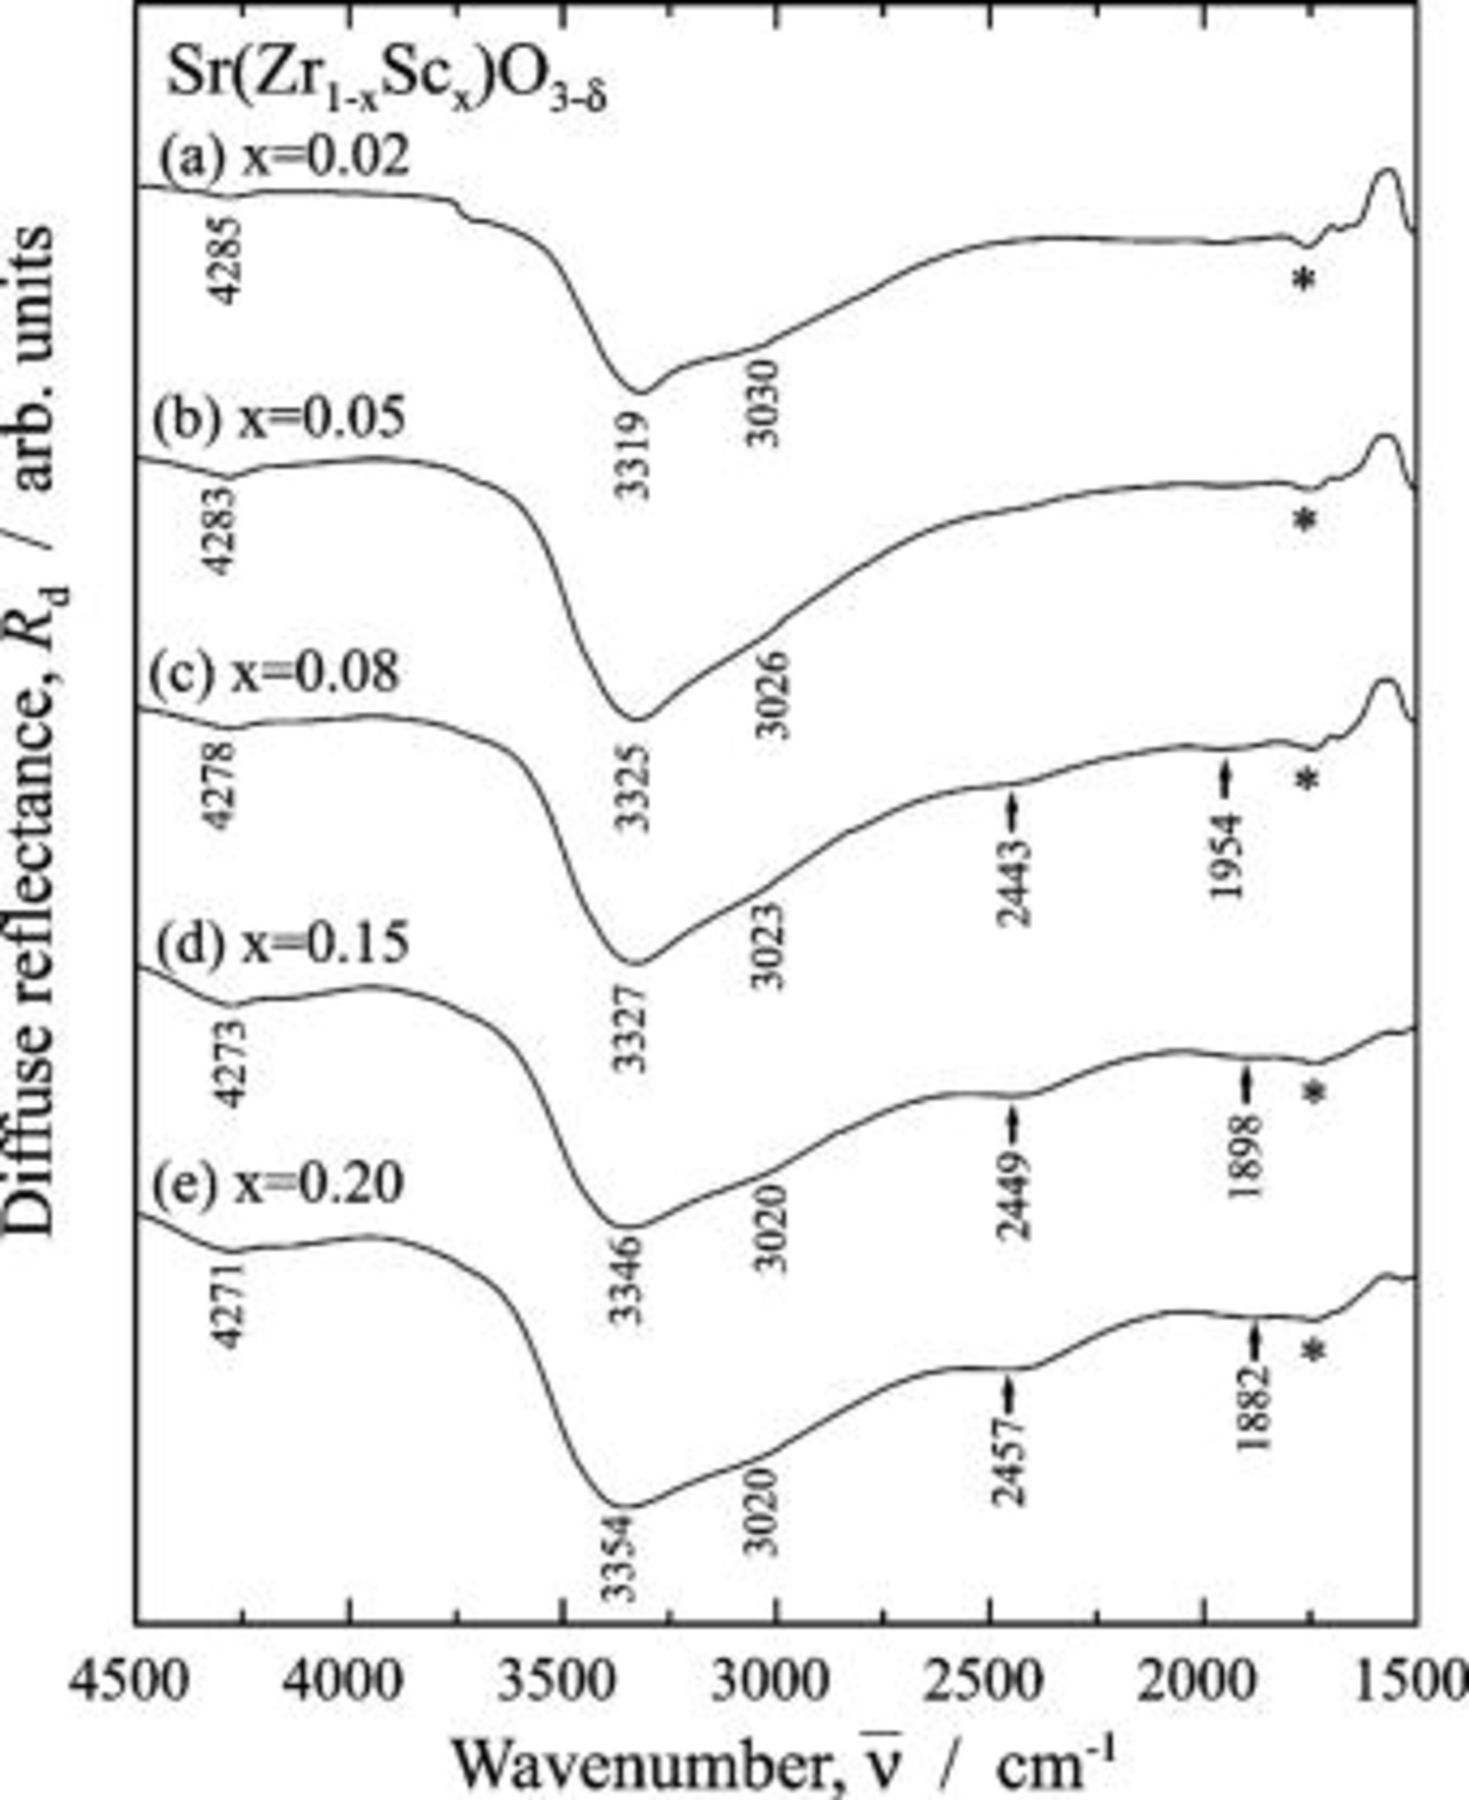
Figure 3. Infrared diffuse reflectance spectra for  region of
  dissolving protons. Protons were dissolved into the samples at
  for
for  in a wet
  atmosphere humidified by water
  . (a)
. (a)  , (b)
, (b)  , (c)
, (c)  , (d)
, (d)  , and (e)
  . The proton-free
  was used as the reference material. The absorption dip marked by the asterisk in the figure was spectral distortion, i.e., a ghost.
Figure 4 shows the IR spectra for the  region of
  . Four
  bands at
  ,
,  ,
,  , and
, and  were observed for the sample with
  . The absorption intensities of these bands were comparable. The spectral shape did not change upon increasing the doping level. The situation that the
  bands at
  and
and  observed for the low Y-doping level was quite different from the case of the Sc-doped
  . The relative intensity of the bands at
  and
and  to the bands at
  and
and  was high compared to the case of the heavily Sc-doped
  .
.
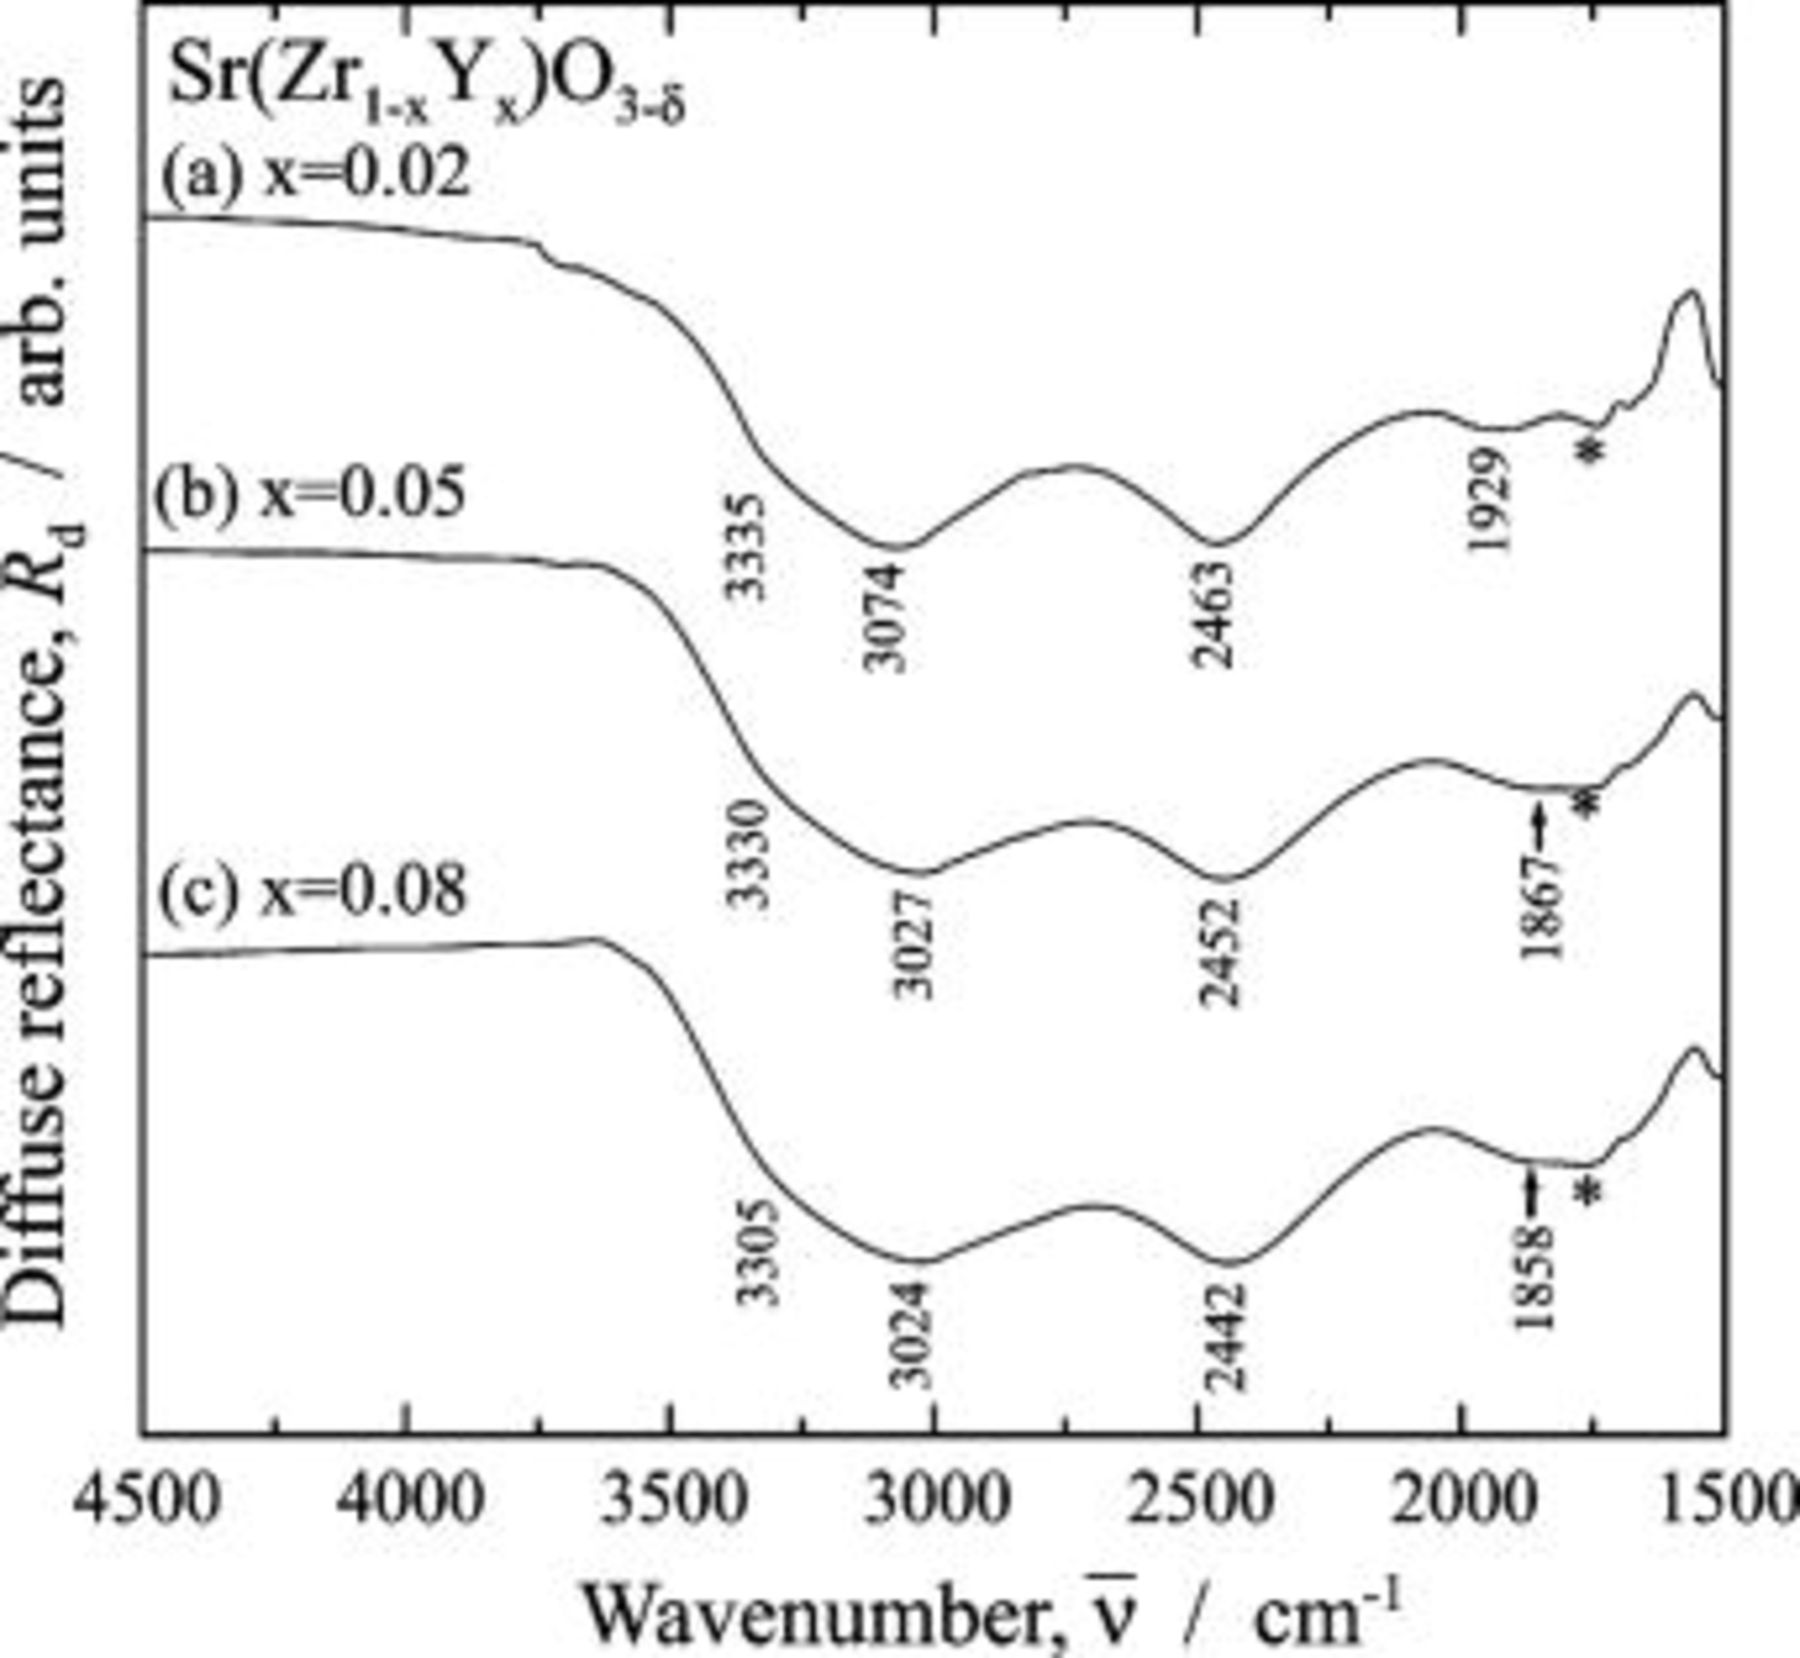
Figure 4. Infrared diffuse reflectance spectra for the  region of
  dissolving protons. Protons were dissolved into the samples at
  for
for  in a wet
  atmosphere humidified by water
  . (a)
. (a)  , (b)
, (b)  , and (c)
  . The proton-free
  was used as the reference material. The absorption dip marked by the asterisk in the figure was spectral distortion, i.e., a ghost.
Figure 5 shows the IR spectra for the  region of
  . For
. For  , two
, two  bands were observed at 3465 and
  , and no absorption band was observed below
  . For
. For 
 , the band at
  observed for
  disappeared, and four
  bands were observed at 3309, 3019, 2376, and
  . The absorption intensity for the two
  bands at
  and
and  increased with the increasing doping level. The appearance of the bands at
  and
and  for heavily doped samples and the increase of their intensity upon doping for the Y-doped
  was close to the results for the Sc-doped
  and quite different from the results for the Y-doped
  . We could not give an interpretation of the disappearance upon increasing doping level of the band at
  . The appearance and increase of intensities of the bands at
  and
and  are discussed in the following section.
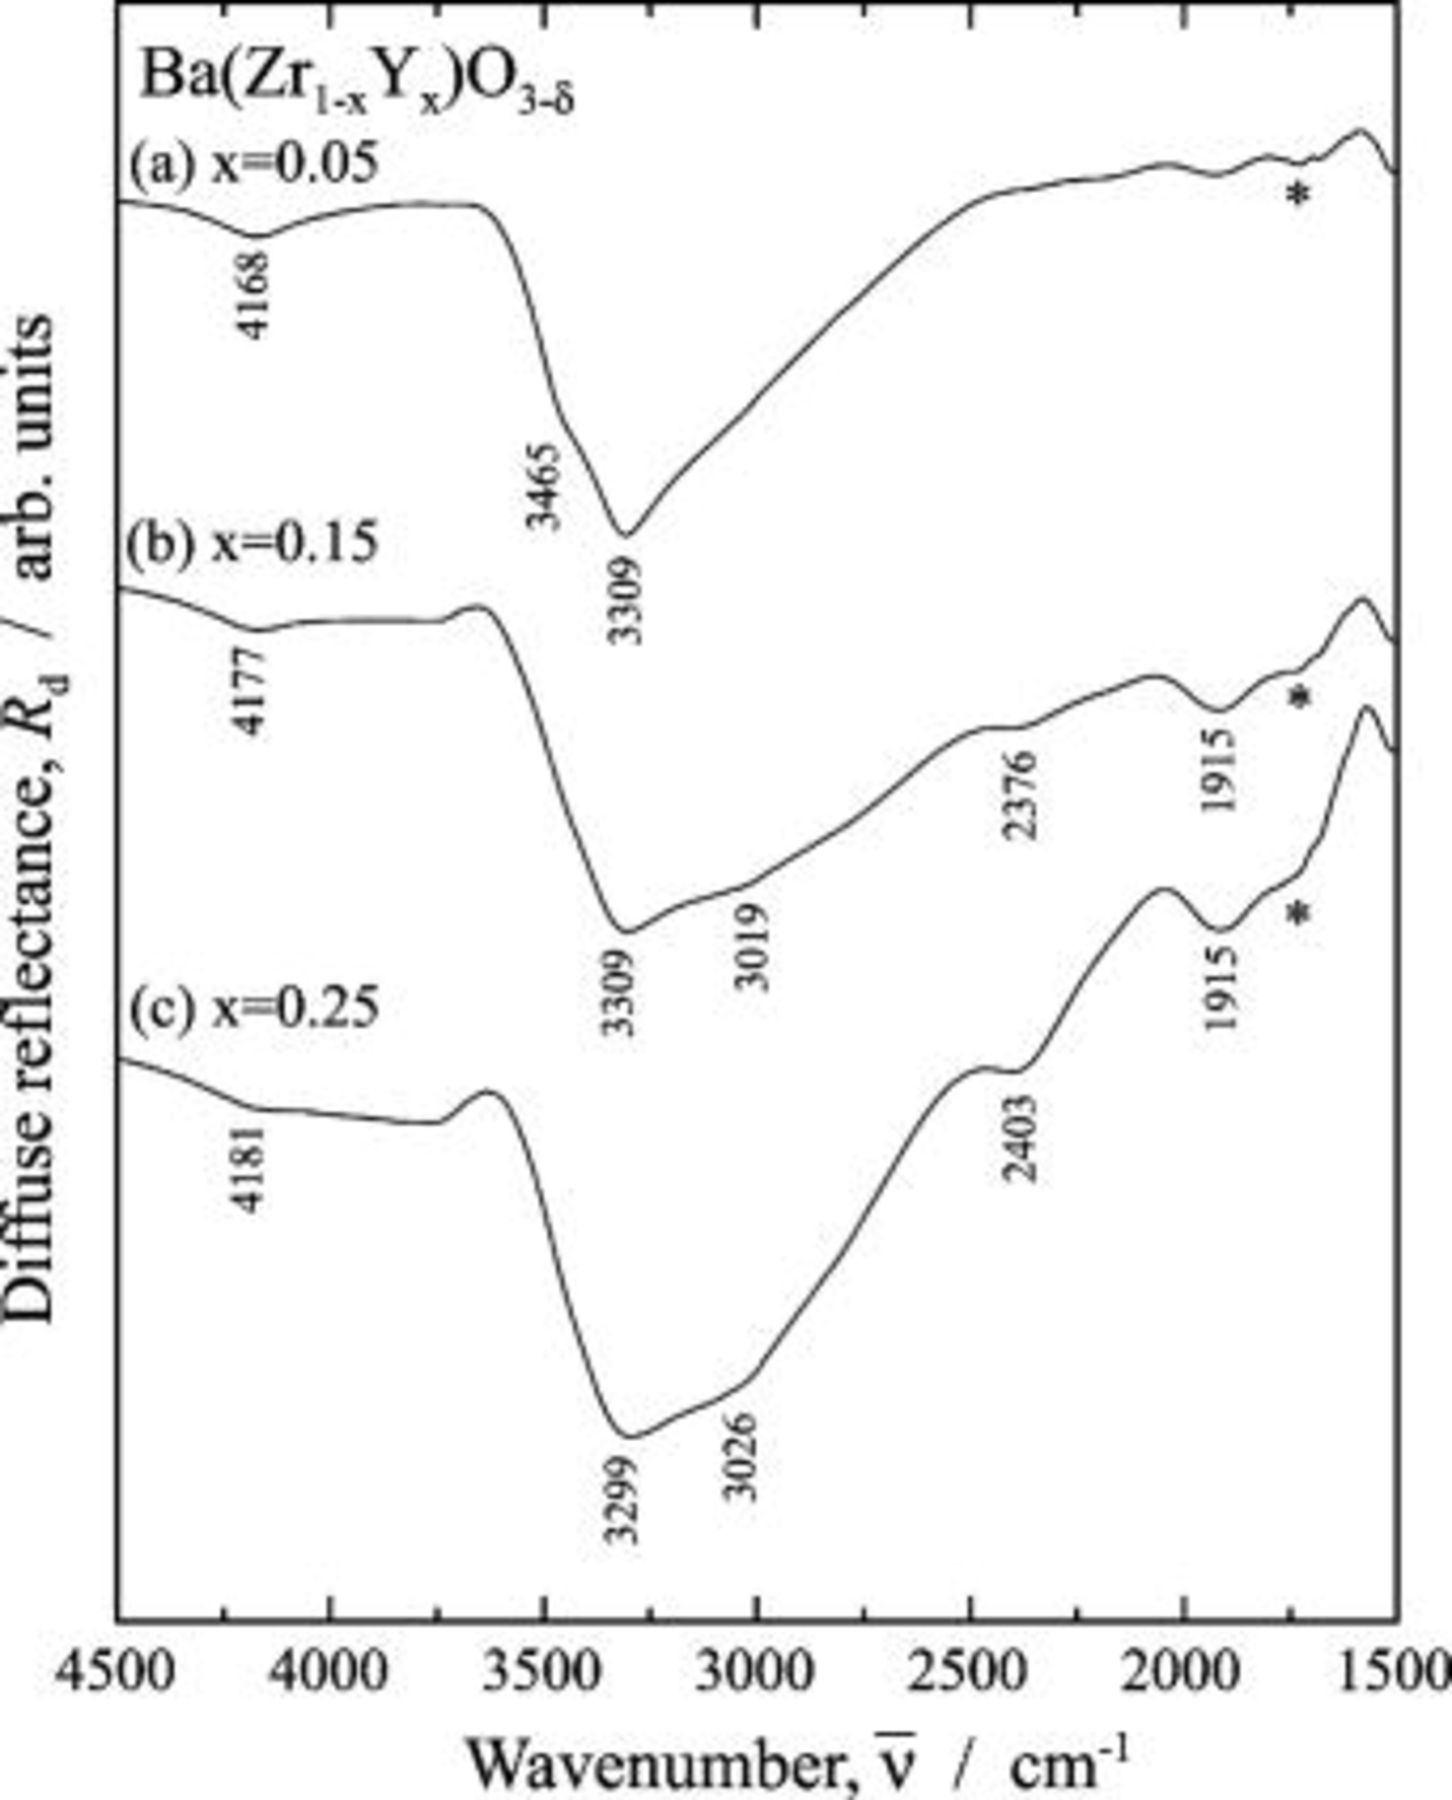
Figure 5. Infrared diffuse reflectance spectra for  region of
  dissolving protons. Protons were dissolved into the samples at
  for
for  in a wet
  atmosphere humidified by water
  . (a)
. (a)  , (b)
, (b)  , and (c)
  . The proton-free
  was used as the reference material. The absorption dip marked by the asterisk in the figure was spectral distortion, i.e., a ghost.
Discussion
First, we discuss the attributions of the four  bands at
  ,
,  ,
,  , and
, and  , i.e., the chemical environment of the dissolved protons corresponding to the
  bands. The appearance and the absorption intensity of the bands at
  , and
, and  , were distinctly dependent on the doping level for the Sc-doped
  and Y-doped
  . The attributions are then discussed based on the changes in the local structure near the dopant trivalent cations upon doping, because it is known that protons are trapped by the oxygen neighboring the dopant and form hydroxyl (OH) groups at room temperature.22, 23 Figure 6 shows a schematic illustration of the framework of the perovskite structure. The framework consists of corner-linked
  octahedra. For instance, one
  is surrounded by six
  as illustrated in Fig. 6a. From the standpoint of probability, when Zr is substituted by dopant
  and its doping level,
  , is lower than
  , i.e.,
  , only one
  ion appears in the block consisting of seven
  octahedra at most, as shown in Fig. 6b. When the doping level becomes higher than
  , i.e.,
  , two
, two  ions appear in the block as shown in Figs. 6c and 6d. For a probability of
  , the two
  ions are adjacent through the oxygen as shown in Fig. 6c; the adjacent
  pair can be expressed as
  . Such a structural change upon increasing the doping level introduces two kinds of oxygens near the dopant. One is the oxygen between dopant
  and the host Zr ions, i.e., M-O-Zr. This kind of oxygen exists in the entire
  -doping level as seen in Fig. 6b, 6c and 6d. The other is the oxygen between the two
  ions, i.e., M-O-M, which appears for the heavily
  -doped samples with
  . Thus, the
  bands at
  and
and  observed in the entire doping level were attributed to the M-OH-Zr, and the
  bands at
  and
and  that appeared for the heavily Sc-doped
  and Y-doped
  were attributed to the M-OH-M. A schematic illustration of the proposed proton sites is shown in Fig. 7, assuming the ideal cubic perovskite framework.
  and its doped samples were of the orthorhombic phase of space group
  .24 Two oxygen sites of O(1) and O(2) exist in this phase; therefore, the O-H bonds of M-OH-Zr should make a distinction between M-O(1)H-Zr and M-O(2)H-Zr. The two
  bands at
  and
and  observed for the M-OH-Zr seemed to be consistent with the crystallographic feature. The appearance of the two
  bands at
  and
and  for the M-OH-M can be interpreted by a similar reason. However, when the respective splitting into two
  bands for M-OH-Zr and M-OH-M was due to the crystallographic feature of orthorhombic
  , it was difficult to explain the similar splitting observed for the cubic
  , in which only one oxygen site exists.25 For the aliovalently doped samples, the oxygens near the dopant and/or dopant must deviate from their ideal positions as pointed out by Kamishima et al.26 and Yoshino et al.27 For instance, the atomic positions of the oxygen around dopant in doped samples must be different from that of oxygen in the undoped sample. Therefore, we inferred that the respective splitting into two
  bands observed was not caused by the crystallographic features of the orthorhombic
  , but the two oxygens with different chemical environments appeared by structural relaxation upon doping. We could not obtain the evidence for this inference from the present results. Heisel et al. discussed the dissolving site of protons in Sc-doped
  based on the muon-spin relaxation
  experiment.28 They proposed two different sites for the dissolved protons. One was near one Sc ion expressed as "Trapping #1" in their paper and the other was near two Sc ions expressed as "Trapping #2." The M-OH-M proposed in the present paper corresponds to the "Trapping #2" proposed by Heisel et al.

Figure 6. Schematic illustration of the framework of the perovskite-type  (AE denotes alkaline-earth element) consisting of seven corner-linked coordination octahedra. (a)
  and (b) when doping level,
  , is lower than
  , i.e.,
  , only one dopant
  ion appears in the block. The
  ion is adjacent to the host Zr ions. When the doping level is higher than 0.14, two
  ions appear in the block from the standpoint of probability. (c) Two
  ions adjacent to the oxygen, and (d) two
  ions are not adjacent. Cubic perovskite lattice is assumed in the figure for simplicity.
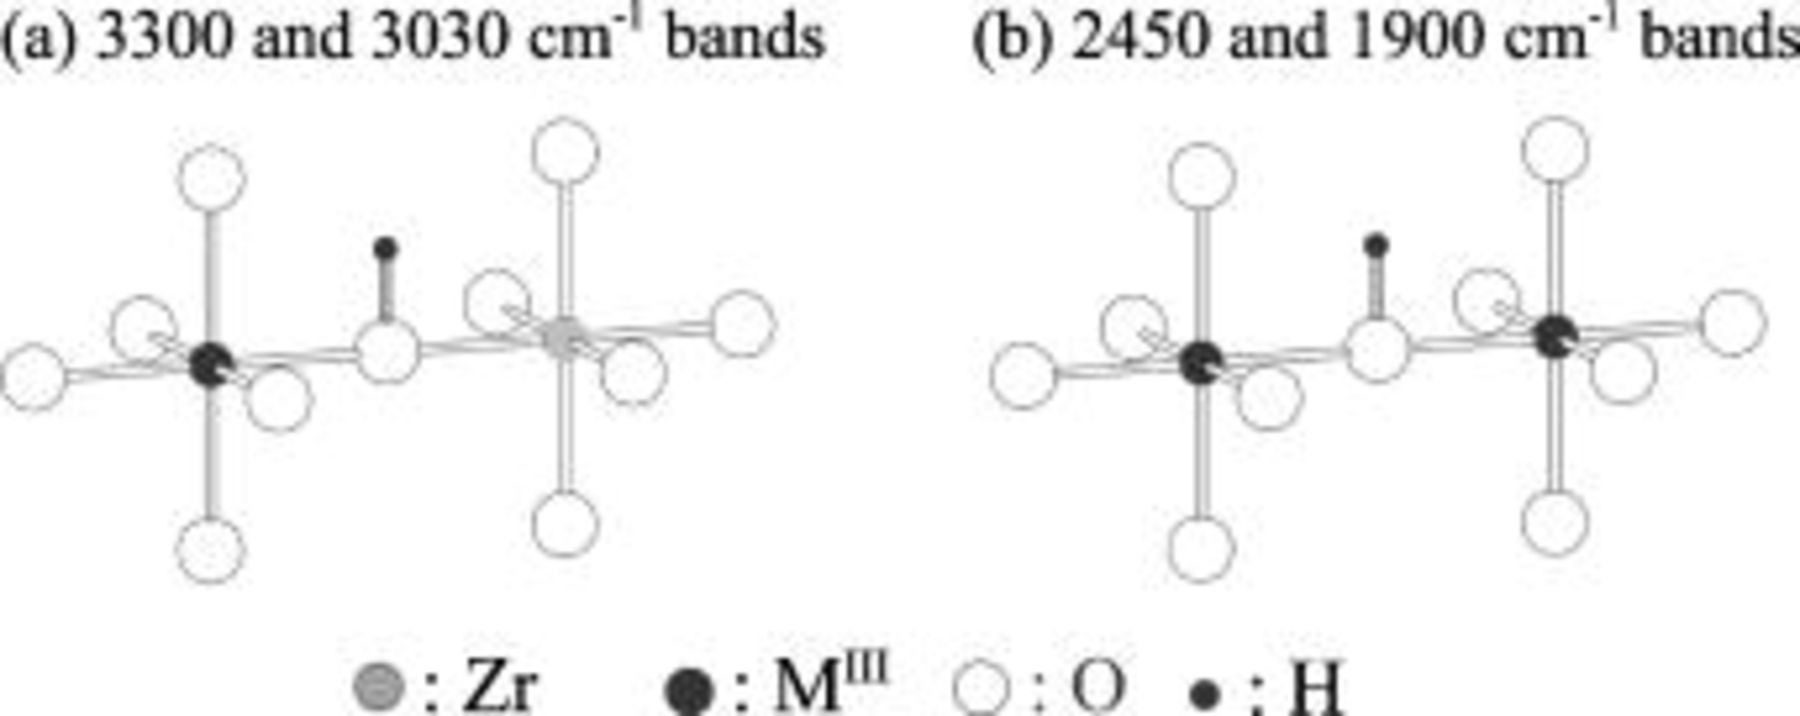
Figure 7. Schematic illustration of proton sites corresponding to observed  bands: (a) protons bonded to the oxygen adjoining dopant
  and host Zr ions, i.e.,
  , which corresponds to the
  bands at
  and
and  ; and (b) protons bonded to the oxygen adjoining two dopant
  ions, i.e.,
  , which corresponds to the
  bands at
  and
and  .
.
Next, we discuss the appearance of the  bands at
  and
and  for the low doping level in Y-doped
  . Based on the attributions discussed, the spectra showed that a significant Y was adjacent through the oxygen, i.e., significant Y-O-Y bonds were formed in the Y-doped
  in spite of the low doping level compared with the
  value. Because the intensities of the bands at
  and
and  were strong and comparable with those of the bands at
  and
and  , it was better to realize that Y in the
  formed the
  cluster rather than the
  pair. In comparison with the Sc-doped
  , such a situation can be explained in terms of the difference in size between the host Zr and dopant as follows. The ionic radius for the six-fold coordination reported by Shannon29 is
  for
for  ,
,  for
for  , and
, and  for
for  . For the Sc-doped
  , because the size of the dopant Sc and host Zr are very close, it is inferred that the doping does not introduce a large structural distortion into the
  octahedra. Because a large structural distortion should be introduced for the Y-doped
  due to the large difference in size between Zr and Y, it was inferred that the lattice energy of the Y-doped
  , in which Y is homogeneously distributed, was higher than that of the Sc-doped
  . In order to decrease such a large lattice energy, Y aggregated on an atomic scale; then the
  cluster must be formed in the early doping level for the Y-doped
  . Bending of Y-O-Y bonds as observed for the
  network in the small
  can decrease the spatial size of the
  cluster. The stress generated at the boundary between
  cluster and the host
  network must be reduced by the spatial size adjustment of the
  cluster to the host
  network. In comparison with the Y-doped
  , the formation of the
  cluster in the Y-doped
  can be interpreted by the smaller
  octahedron in
  than in
  . The crystallographic data reported for the alkaline-earth zirconates.24, 25, 30 are summarized in Table I. Because the ionic radius of the alkaline-earth ion is ranked as
  , the monomolecular volume of the phases was ranked as
  . However, the average distances between the oxygen atoms and between Zr and oxygen in the
  octahedron were ranked as
  . These characteristics suggested that the
  octahedron in
  is tight and compulsive compared to those in
  and
and  . In other words, the size of Zr in
  is actually smaller than that in
  and
and  . Therefore, the structural distortion of the
  octahedra introduced by Y-doping in
  must be greater than that introduced by Y-doping in
  .
.
Table I. Crystallographic data for alkali-earth zirconates.
| Lattice parameter (nm) | Monomolecular volume 
| Average O–O distance 
| Average Zr–O distance 
| Ionic radius of 12-fold coordinated alkali-earth ion, (nm) (nm) | |
|---|---|---|---|---|---|

|
 , , , , 
| 0.06457 | 0.2965 | 0.2096 | 0.134 |

|
 , , , , 
| 0.06894 | 0.2957 | 0.2091 | 0.144 |

|
| 0.07394 | 0.2968 | 0.2099 | 0.161 |
aThe values of  correspond to a quarter of unit cell volume for orthorhombic
  and
and  , and the value is the same for the unit cell volume of cubic
  .
.
Conclusion
Infrared absorption spectra in the  region were studied for the HTPC Sc- and Y-doped
  and Y-doped
  . The wavenumber of the observed
  bands and their intensities were discussed from the viewpoint of the local structure change near the dopant upon increasing the doping level. The obtained results are summarized as follows:
1. For the Sc-doped  , i.e.,
  , two
, two  bands at
  and
and  were observed for the low doping level of
  . For
. For  , small bands at
  and
and  appeared in addition to the bands at
  and
and  . The intensities of the two
  bands at
  and
and  increased with the increasing Sc-doping level. The intensities of the two bands at
  and
and  were much lower than that of the bands at
  and
and  , even for the heavily doped sample of
  .
.
2. For the Y-doped  , i.e.,
  , four absorption bands at
  ,
,  ,
,  , and
, and  were observed over the entire doping level of
  . The intensities of the four bands were comparable and independent of the Y-doping level.
3. For the Y-doped  , i.e.,
  , two
, two  bands at 3465 and
  were observed for the low doping level of
  . For the heavily doped samples of
  , two
, two  bands at
  and
and  appeared in addition to the bands above
  . The spectral shape, features, and their changes upon doping were close to the Sc-doped
  .
.
4. The two  bands at
  and
and  were attributed to the proton bonded to the oxygen between dopant
  and host Zr ions, i.e.,
  . The bands at
  and
and  were attributed to the proton bonded to the oxygen between the two dopants, i.e.,
  .
.
5. Based on the attributions, the IR spectra of the Y-doped  showed that the dopant Y aggregated on an atomic scale and formed the
  cluster even for the low doping level of Y-doped
  . The
. The  -cluster formation in Y-doped
  was interpreted by the larger size of
  than
than  and the practically smaller size of
  in
in  than that in
  and
and  .
.
Osaka University assisted in meeting the publication costs of this article.