
Abstract
The performance of vanadium redox flow batteries (VRFBs) is impacted by the diffusion and migration of the vanadium species across the separator. In this work, the vanadium crossover as a function of current density for vanadium-containing electrolytes of various state of charge (SOC) and state of discharge (SOD) is measured. Experiments conducted with electrolytes at complete charge/discharge yielded direct measurements of the transference numbers of the vanadium species. The transference numbers of V2+, V3+, VO2+, and VO2+ were estimated to be 0.064 ± 0.002, 0.087 ± 0.003, 0.068 ± 0.003, and 0.018 ± 0.002, respectively. Experiments conducted with electrolytes at intermediate states of charge/discharge yielded direct measurements of the sum of transport numbers of the vanadium species. The transport number estimates are quantitatively related to faradaic efficiency loss and capacity fade of a working VRFB.
Export citation and abstract BibTeX RIS

This is an open access article distributed under the terms of the Creative Commons Attribution 4.0 License (CC BY, http://creativecommons.org/licenses/by/4.0/), which permits unrestricted reuse of the work in any medium, provided the original work is properly cited.
List of symbols
| Symbol | Description |
| A | Cross-sectional area of membrane, cm2 |
| cj | Concentration of component j in membrane, mol cm−3 |
| cj,bulk | Concentration of component j in bulk electrolyte mol cm−3 |
| Dj | Diffusion coefficient of component j in membrane, cm2 s−1 |
| F | Faraday's constant, 96485 C mol−1 |
| i | Current density, A cm−2 |
| L | Thickness of membrane, cm |

|
Ratio of migration to diffusion across the separator |
| Nj | Molar flux of component j, mol cm−2 s−1 |
| Nj,i=0 | Diffusive molar flux of component j, mol cm−2 s−1 |
| Q | Volumetric flow rate, cm3 s−1 |

|
Coulombs of charge per unit area of membrane, mol cm−2 |

|
Coulombs of discharge per unit area of membrane, mol cm−2 |

|
Total coulombs of charge in electrolyte, mol cm−2 |

|
Total coulombs of discharge in electrolyte, mol cm−2 |
| tj | Transference number of component j |
| tj/zj | Transport number of component j |
| zj | Charge of component j |
| Greek Symbol | Description |

|
Change in moles of vanadium, mol cm−2 |
| σ | Standard deviation |
| Subscript | Description |
| H | Proton |
| j | Component j in membrane |
| j,bulk | Component j in bulk electrolyte |
| SO4 | Sulfate ion |
| V2 | Vanadium (II) ion (V2+) |
| V3 | Vanadium (III) ion (V3+) |
| V4 | Vanadyl ion (VO2+) |
| V5 | Dioxovanadium ion (VO2+) |
Vanadium redox flow batteries (VRFBs) are promising for large-scale energy storage due to their potential to have long life cycles, low emission of pollutants, and low levelized cost of energy. A lot of the pioneering research for VRFBs has been conducted at the University of New South Wales,1–7 where the battery was first developed. The positive electrolyte and negative electrolytes of the VRFB consist of the V2+/V3+ and VO2+/VO2+ redox couple, respectively, each solubilized in sulfuric acid. During charge, VO2+ (V4) ions are oxidized to VO2+ (V5) ions at the positive electrode, while V3+ (V3) ions are reduced to V2+ (V2) ions at the negative electrode, as shown in Reactions 1 and 2.


A separator is positioned between the V4/V5 and the V2/V3 redox couples to minimize mixing. During charge, when migration dominates, the V4/V5 is transported across the separator, while during discharge, the V2/V3 is transported. Nafion is commonly used as the separator due to its chemical stability, mechanical rigidity, and ionic conductivity. The performance of working VRFBs is impacted by the diffusion and migration of the vanadium species across the Nafion separator, which lead to undesirable Reactions 3–5.8 Studies have been conducted to characterize vanadium uptake and diffusion through Nafion in various conditions.9–13


Reactions 3–5 lower the faradaic efficiency of the battery but can be mitigated by the design of membranes that reject the flux of vanadium species. One approach is to design Nafion composite membranes that improve ion selectivity while maintaining high ionic conductivity. Nafion has been modified with inorganic additives including SiO2,14,15 TiO215–17 and WO3,18 which are thought to block the polar clusters of Nafion to reduce vanadium permeability. Nafion has also been modified with layers of SPEEK,19 PTFE,20,21 PP,22 silicate,23 silicalite,24 and graphene25 for improved ion selectivity.
Another approach to mitigate vanadium crossover is to utilize anion-selective membranes, which have cations covalently bonded to their structures.26–29 Anion-exchange membranes tend to have low vanadium permeability due to electrostatic effects between vanadium and the cationic groups of the membrane. However, they also tend to have lower ionic conductivity due to their reliance on the mobility of sulfate, which is intrinsically less mobile than the proton. Amphoteric membranes, which have both cations and anions covalently bonded to their structures, have been synthesized and characterized to maintain good conductivity while lowering vanadium permeability.30–43
Studies have characterized the permeability of vanadium ions across the membrane, but such studies often do not consider the migrative flux of vanadium that may dominate in working VRFBs. Equation 6 shows a non-dimensional parameter,  that may be helpful to quantify the significance of migration in VRFBs. The parameter physically represents the ratio of migrative flux to diffusive flux across a separator. Vanadium crossover can be attributed to solely the diffusive flux of vanadium in the limit of
  and can be attributed solely to the migrative flux of vanadium in the limit of
  Simulations of this work show that values of
  are sufficiently large for migration to dominate.
Values of  in VRFBs are not known with confidence due to the incomplete knowledge of the transference numbers and diffusion coefficients of the vanadium species in the separator. VRFBs, however, often operate with high current densities (40–100 mA cm−2), and therefore, the system may be migration-dominated even with small values of the vanadium transference numbers. Recently, researchers have conducted experiments44 and developed models45–48 to assess vanadium crossover in the migration-dominated regime.
An experimental protocol has recently been introduced to measure salt transference numbers in ion-selective membranes49 and the technique has been employed to measure salt transference numbers of novel membrane architectures.50 In addition to the technique's experimental simplicity, high accuracy, and high precision, it has been shown that dilute solution theory and concentrated solution theory yield the same transference number estimates under some conditions.51 The technique has been employed to measure transference numbers of V4 in various concentrations of sulfuric acid,52 and in this work, transference numbers of all vanadium species (V2, V3, V4, and V5) are estimated in Nafion 117. The transport numbers ( ) of vanadium species are estimated for intermediate states of charge/discharge.
Theory
Figure 1 presents the experimental protocol of the tracer technique used to measure transference numbers. An electrochemical device was constructed to fasten a membrane between two flowing electrolytes. The anolyte inlet was comprised of a vanadium-containing solution solubilized in sulfuric acid, while the catholyte inlet was comprised of a sulfuric acid blank of identical ionic strength. A constant current was applied between the electrodes, and therefore its value was accurately known. The current density across the membrane is given by the flux of the proton, sulfate, V4, and V5 ions during charge. Similarly, the current density is given by the flux of the proton, sulfate, V2, and V3 ions during discharge.

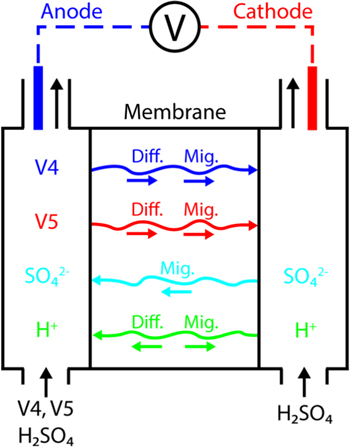
Figure 1. Experimental procedure employed to measure vanadium crossover for electrolytes of various SOC. The V4 and V5 ions are replaced with the V2 and V3 ions to measure vanadium crossover for electrolytes of various SOD. At complete charge/discharge only one vanadium ion flows through the anolyte inlet. The vanadium concentration in the catholyte outlet was measured with ICP-OES as a function of applied current density.
Download figure:
Standard image High-resolution imageThe catholyte effluent was measured for total vanadium content  which was related to the sum of the fluxes of the V4 and V5 species by Eq. 8. An analogous expression was used for the V2/V3 redox couple. The steady-state fluxes were used to estimate the transport properties of vanadium species.
The ratio of the flux measurement ( ) to the applied current density
  can be directly related to the transport numbers (
 ) of the vanadium species when the ratio of migration to diffusion is sufficiently high. Equation 9 shows an empirical relationship describing the conditions necessary for the migrative flux to dominate the diffusive flux. Equation 10 shows the direct measurement of transport numbers is attained in the migration-dominated regime.
It should be noted that when the anolyte inlet consists of one vanadium ion, a direct measurement of the transference number can be attained, rather than the sum of transport numbers, since the vanadium concentration measurement can be attributed to the flux of one ion.
Code was written in fortran95 using a block tridiagonal matrix algorithm developed by Newman53 to validate Eqs. 9 and 10. The model of the tracer experiment, shown in Table I, is discussed in more detail in the literature.49,52 The model assumes that electroneutrality is preserved across the thickness of the membrane and that the flux measurement has reached steady state.
Table I. Implementation of outlined physics into the numerical model for transference estimation of the V4/V5 redox couple. An analogous model is used for the V2/V3 redox couple.
| Dependent variable | Boundary condition at x = 0 | Boundary condition at x = L | Governing equation |
|---|---|---|---|

|

|
0 |

|

|

|
0 |

|

|

|

|

|

|

|

|

|
| ϕ | 0 |

|

|
Figure 2 shows that the ratio of vanadium flux to current density can be directly related to the sum of transport numbers in the migration-dominated regime. The x-axis of the figure is proportional to the ratio of migrative flux to diffusive flux of the vanadium species, and the migration-dominated regime is given by Eq. 9. The y-axis of the plot converges to the sum of the vanadium transport numbers, which is given by Eq. 10, when migration is the predominant transport mechanism. The straight vertical lines of each data series depict when the quantity  converges to the sum of transport numbers.
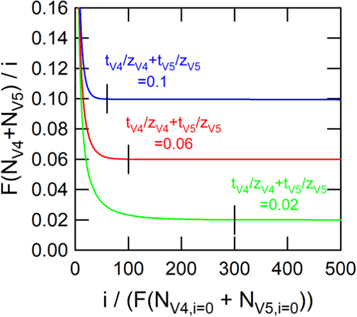
Figure 2. Simulated flux of total vanadium species normalized by current density for the estimation of transport numbers. The quantity,  converges to the sum of transport numbers when the ratio of migration to diffusion is sufficiently high, which is shown with the straight vertical lines (given by Eqs. 9 and 10).
Download figure:
Standard image High-resolution imageA Markov Chain Monte Carlo (MCMC) algorithm was used to attain probability distribution functions for the sum of vanadium transport numbers. The Metropolis–Hastings algorithm was used to empirically determine the posterior distributions. The likelihood of the experimental data given the simulation parameters was assumed to follow a normal distribution.
Methodology
An electrochemical device was constructed by etching a slab of poly methyl methacrylate (McMaster Carr) with dimensions similar to the literature.49,52 The inlets and outlets of the device were equipped with tube fittings (McMaster Carr) to connect the device to an external tubing and pumping system. Platinum wire with a diameter of 0.5 mm (Sigma Aldrich) was pierced through the outlets of the tubing fittings, inserted into the device, and epoxied to fill the piercings. Platinum was chosen as the anode and cathode material due to its electrochemical stability.
Vanadium crossover as a function of current density was measured for Nafion 117 (Sigma Aldrich) since this membrane is predominantly used in VFRBs. The Nafion membrane was pretreated by heating in 3% H2O2 at 80 °C for one hour, followed by heating in DI water at 80 °C for two hours, followed by heating in 0.5 M H2SO4 at 80 °C for one hour. Electroplaters tape was punctured with a hole and placed on the two sides of the Nafion membrane to precisely define the cross-sectional area available for transport to be a 0.2 cm2 circle. The membrane was secured between the two chambers of the device. The same membrane was used for all experiments and was soaked in dilute H2SO4 between each set of experiments.
The general process for the experiments is shown in Fig. 1. The anolyte, consisting of 0.05 M vanadium solubilized in 0.2 M H2SO4, was pumped through its respective chamber of the device while in contact with the membrane. Simultaneously, the catholyte, consisting of a H2SO4 blank, was pumped through its respective chamber of the device while in contact with the opposite side of the membrane. The flux of vanadium into the blank catholyte was measured. The anolyte and catholyte were each pumped through the device at flow rates of 1.0 ml min−1 using a Cole-Parmer Masterflex L/S peristaltic pump. As electrolyte flowed through the device, a Keithley 2410 1100 V SourceMeter power supply was used to apply a constant current ranging from 0–100 mA cm−2. The reactions at the negative electrode were presumed to be vanadium reduction and hydrogen evolution, while the reactions at the positive electrode were presumed to be vanadium oxidation and oxygen evolution. Since the electrodes were placed through the outlet tube fittings, the products of the electrochemical reactions were immediately purged out of the device having minimal interference with the processes at the membrane. Therefore, reactions involving vanadium did not affect the measured flux of vanadium across the membrane. For each current density, 55 ml of electrolyte was pumped through each side of the device. The first 45 ml of electrolyte ensured a steady-state measurement and was discarded, while the last 10 ml of the catholyte outlet was collected and analyzed for vanadium content. A set of seven current densities was applied across the membrane in order of increasing magnitude for the V4/V5 redox couple, and a set of four current densities was applied for the V2/V3 redox couple. Subsequent to each set of experiments, the flow cell was purged with dilute H2SO4 to remove residual salts in the device and tubing.
The catholyte outlet was analyzed for vanadium content using an Agilent 720 inductively coupled plasma optical emission spectrometer (ICP-OES). The signal intensity scaled linearly (R2 > 0.999) with vanadium concentration for standards of 0, 2.5, 5, 10, 15, 20, and 25 ppm. The calibration standards, prepared with appropriate backgrounds of H2SO4, were measured immediately before concentration measurements of the catholyte outlets. The characteristic wavelength of 311.837 nm yielded the highest signal intensity, and therefore, was used to estimate vanadium concentration. The bulk concentration measurement of the catholyte outlet was related to the flux of V4 and V5 across the membrane by Eq. 8. An analogous expression was used for the V2/V3 redox couple. The same applied flow rate (Q) and membrane surface area (A) was used for all experiments of this study.
The V4/V5 redox pair was prepared by the dissolution of VOSO4 and V2O5 salts (Alfa Aesar). The degree of hydration of the VOSO4 salt was reported to be VOSO4 4.4H2O by the manufacturer, which was accounted for in the preparation of 0.05 M V4 in 0.2 M H2SO4. The protons consumed by the dissolution of the V2O5 salt was considered in the preparation of 0.05 M V5 in 0.2 M H2SO4. The V4 and V5 solutions were mixed to generate electrolytes at 25%, 50%, and 75% SOC. The V2/V3 redox pair was prepared using a working VRFB charged with a cell potential of 1.8 V from the dissolution of 1 M VOSO4. Argon was purged through the negative electrolyte to prevent the oxidation of ions by dissolved oxygen. The stoichiometry of the electrochemical reactions were considered in the preparation of 1 M V2 in 4 M H2SO4 and 1 M V3 in 4 M H2SO4, which were subsequently diluted to yield 0.05 M V2 in 0.2 M H2SO4 and 0.05 M V3 in 0.2 M H2SO4. The V2 and V3 solutions were mixed to generate electrolytes at 25%, 50%, and 75% SOD.
Results
Figure 3a shows the steady-state flux of vanadium across Nafion 117 as a function of current density for electrolytes of various states of charge (SOC), and Fig. 3b shows the results for electrolytes of various states of discharge (SOD). The results at 0% SOC were conducted in the literature, and therefore, a different set of current densities were applied.52 The steady-state flux of the vanadium species increased with current density, which is anticipated from the outlined theory. The results show that the V4 ion is more inclined to migrate across the membrane than the V5 ion. Direct measurements of transference numbers of the V4 and V5 ions can be attained from the data at 0% SOC and 100% SOC, respectively in the migration-dominated regime, while direct measurements of  can be attained for intermediate SOCs in the migration-dominated regime. An estimate of the diffusion coefficient for each vanadium species was attained from the zero-current results, which is discussed below. Figure 3b shows that the V2 and V3 ions are prone to migrate across the membrane to similar extents. Similarly, the transference numbers of the V2 and V3 ions were attained from the data at 0% SOD and 100% SOD, respectively, and the diffusion coefficients can be attained from the zero-current data, which is discussed below.
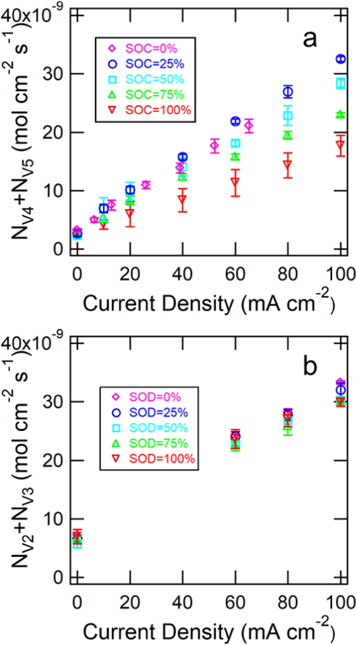
Figure 3. (a) Experimentally measured flux of total vanadium species across the membrane for the V4/V5 redox couple. SOC values of 0% and 100% correspond to the V4 ion and V5 ion, respectively. (b) Experimentally measured flux of total vanadium species across the membrane for the V2/V3 redox couple. SOD values of 0% and 100% correspond to the V2 ion and V3 ion, respectively. Error bars show the standard deviations of experiments conducted in triplicate.
Download figure:
Standard image High-resolution imageFigure 4a shows the flux of vanadium across the membrane normalized by current density and compared to numerical simulation for the estimation of the transference numbers or the sum of transport numbers ( ). The best-fit simulation is shown alongside each of the experimental data sets. In general, the experiments and simulations are in good agreement, especially at high current densities. Although the simulations are shown, they are not necessary because Eqs. 9 and 10 provide similar transport number estimates. Figure 4b shows the flux of vanadium across the membrane normalized by current density and compared to numerical simulation for the estimation of the transference numbers or the sum of transport numbers
  Since the sum of transport numbers is very similar for the electrolytes of various SOD, a single simulation is shown with
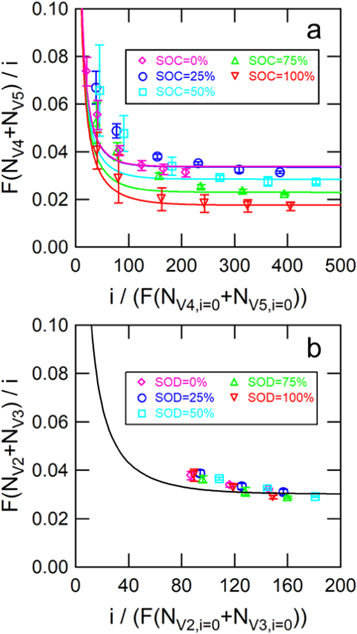
Figure 4. Flux of total vanadium species normalized by current density and compared to numerical simulation for the estimation of transference numbers for (a) the V4/V5 redox couple, and (b) the V2/V3 redox couple. Error bars show the standard deviations of experiments conducted in triplicate.
Download figure:
Standard image High-resolution imageDiscussion
Transference number and diffusion coefficient estimates of the V2, V3, V4, and V5 ions were attained from the data sets at 0% SOD, 100% SOD, 0% SOC, and 100% SOC, respectively. The flux measurements at all current densities were used to estimate the transference numbers, while the flux measurements at zero current were used to estimate the diffusion coefficients. Figure 5a shows the transference number estimate of each vanadium species in Nafion 117 with a ratio of H2SO4:Vj of 4:1. The values of the transference numbers reflect the proclivity of each vanadium species to species to adhere to and migrate across the membrane. The transference number of the V3 ion is the largest due to its +3 charge and relatively high mobility across the membrane, and the transference number of V5 is the lowest due to its +1 charge and relatively low mobility across the membrane. The proton is thought to carry the majority of current across the membrane.
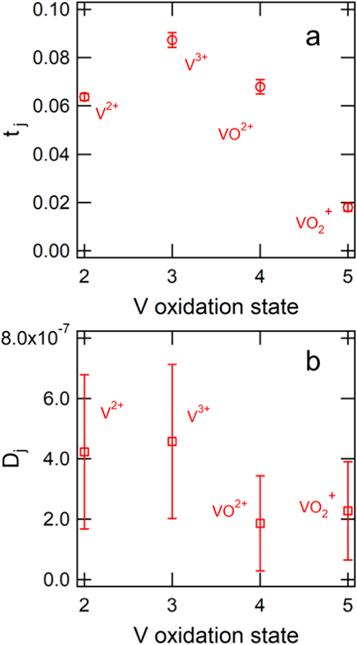
Figure 5. (a) Estimated transference number of each vanadium oxidation state in Nafion 117 at complete charge/discharge. (b) Estimated diffusion coefficient of each vanadium oxidation state in Nafion 117. The ratio of sulfuric acid to total vanadium content was 4:1 for these estimates.
Download figure:
Standard image High-resolution imageFigure 5b shows the diffusion coefficient estimate for each vanadium species in Nafion 117. The diffusion coefficients of V2, V3, V4, and V5 were estimated from the zero-current experiments to be 4.2 ± 2.6 × 10⁻⁷, 4.6 ± 2.6 × 10⁻⁷, 1.9 ± 1.6 × 10⁻⁷, and 1.3 ± 1.6 × 10⁻⁷ cm2 s−1, respectively. The diffusion coefficients of the V2 and V3 ion are similar, while the diffusion coefficients of V4 and V5 are approximately half as large. It should be noted that the estimated diffusion coefficients are affected by the properties of the tracer ion, whereas the transference number estimates are independent of the properties of the tracer ion. Therefore, the transference numbers are estimated with a greater degree of confidence than the diffusion coefficients. The use of the proton as the tracer ion is known to affect the zero-current flux and was considered in the diffusion coefficient estimate.11,52
The sum of transport numbers were directly measured for experiments conducted at intermediate states of charge/discharge. It was assumed that the sum of transport numbers was linearly dependent on SOC/SOD to develop Eq. 11 for the V4/V5 redox couple and Eq. 12 for the V2/V3 redox couple.
Where 

 and
and  represent the transference numbers at 0% SOC, 100% SOC, 0% SOD, and 100% SOD, respectively. Figure 6a shows the sum of transport numbers as a function of SOC using Eq. 11 to model the data, and Fig. 6b shows the sum of transport numbers as a function of SOD using Eq. 12 to model the data. As the battery is charged, the transport number of V5 increases due to the generation of V5 in the bulk electrolyte, while the transport number of V4 decreases due to the depletion of V4 in the bulk electrolyte. As the battery is discharged the transport number of V3 increases due to the generation of V3 in the bulk electrolyte, while the transport number of V2 decreases due to the depletion of V2 in the bulk electrolyte. A linear relationship between the transport number and the SOC/SOD gives good agreement with the experimental measurements of the sum of transport numbers.
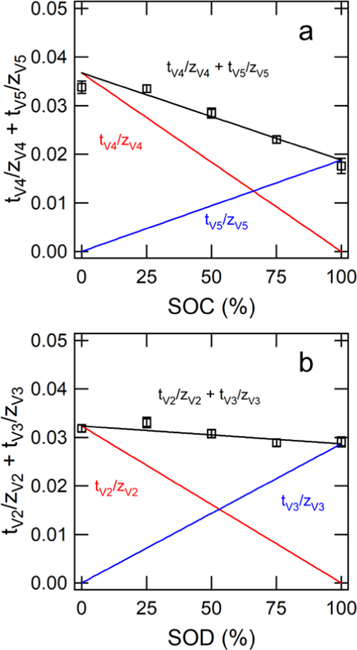
Figure 6. (a) Sum of vanadium transport numbers as a function of SOC. (b) Sum of vanadium transport numbers as a function of SOD. The ratio of sulfuric acid to total vanadium content was 4:1 for these estimates. Error bars show the standard deviations determined from the MCMC algorithm.
Download figure:
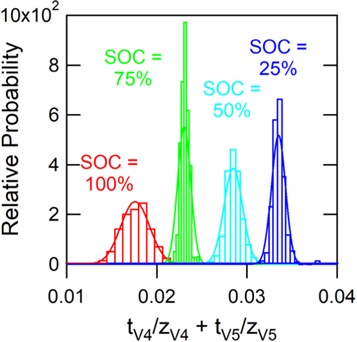
Standard image High-resolution imageFigure 7 shows the probability distribution functions for the transport number estimates obtained from the MCMC algorithm. The histograms generated by the algorithm were fit to normal distributions to attain mean and standard deviation values of the transport number estimates. The MCMC simulations show that the sum of transport numbers can be estimated with relative uncertainty of less than 5%, consistently. The uncertainties in the transport number estimates stem primarily from the experimental uncertainty in the vanadium flux measurements as opposed to the uncertainty in the other parameters in the model. The histograms indicate that vanadium transport is dependent on SOC due to the different transport properties of V4 and V5. However, the vanadium transport is relatively independent of SOD due to the similar transport numbers of the V2 and V3 ions.
Figure 7. Probability distribution functions of the estimates of the sum of transport numbers for the V4/V5 redox couple at 25%, 50%, 75%, and 100% SOC.
Download figure:
Standard image High-resolution image
The loss in faradaic efficiency of the VRFB due to vanadium crossover ( ) can be attained from the fluxes of the vanadium species. The loss is equal to the rate of vanadium crossover divided by the rate of reaction. The crossover of one V4 or V3 ion is correlated to the loss of 0.5
  from Reaction 5, and the crossover of one V5 or V2 ion results in the loss of 1.5
  from Reactions 3 and 4. This stoichiometry leads to Eq. 13 to predict the loss in faradaic efficiency of the VRFB.

During charge, the fluxes of the V4 and V5 ions increase with current density according to their respective transference numbers, whereas the fluxes of the V2 and V3 ions converge to zero. Conversely during discharge, the fluxes of the V2 and V3 ions increase with current density according to their respective transference numbers, and the fluxes of the V4 and V5 ions converge to zero. The diffusive flux of vanadium ions is not important in the migration-dominated regime, which can be predicted by Eq. 14 during charge. Equation 15 shows that the loss in faradaic efficiency is directly related to the transport numbers of the vanadium species in the high-current regime.
Similarly, during discharge, the diffusive flux of vanadium ions becomes unimportant in the high current-regime, and the  is directly related to the transport numbers of the V2 and V3 ions. The faradaic efficiency is thought to increase with current density and becomes independent of current density in the migration-dominated regime. Therefore, it is desirable to operate a VRFB at high current density to mitigate losses in faradaic efficiency associated with diffusive crossover of the vanadium species.
The experimental results indicate that  increases as a function of SOC and decreases as a function of SOD. The
  for a complete charge/discharge cycle can be estimated by Eq. 16.
The integrated  for a complete charge cycle is estimated to be 2.3%, while the integrated
  for a complete discharge cycle is estimated to be 3.1%. The
  is estimated to be 5.4%, which similar to efficiencies reported for VRFBs in the literature with Nafion at high current densities.13,14,20,41,54
Due to the differences in transference number, current-driven vanadium crossover can also lead, long term to an imbalance in the amount of vanadium in the anolyte and the catholyte, potentially causing capacity fade in the VRFB. For example, it is possible that vanadium accumulates in the V4/V5 redox couple due to the low transport number of the V5 ion in Nafion. The moles of vanadium per unit area of membrane ( ) that accumulate on one side of the battery per charge/discharge cycle is given by Eq. 17.
Carrying out the integration leads to  mol cm−2 for the first charge/discharge cycle assuming
  which represents a loss in capacity of 0.3%. The value of
  may change for additional cycles due to alterations in the bulk vanadium concentration and pH of each redox couple. The operation of VRFBs with anion-selective separators may have low capacity fade due to small and similar transport numbers of the vanadium species in the separator.
Conclusions
Experiments were conducted to measure vanadium crossover as a function of current density for electrolytes comprised of various SOC and SOD. Transference number and diffusion coefficient estimates of the V2, V3, V4, and V5 ions were attained from the data sets at 0% SOD, 100% SOD, 0% SOC, and 100% SOC, respectively. The transference numbers of V2, V3, V4, and V5 solutions were estimated to be 0.064 ± 0.002, 0.087 ± 0.003, 0.068 ± 0.003, and 0.018 ± 0.002, respectively, while the diffusion coefficients were estimated from zero-current experiments to be 4.2 ± 2.6 × 10⁻⁷, 4.6 ± 2.6 × 10⁻⁷, 1.9 ± 1.6 × 10⁻⁷, and 1.3 ± 1.6 × 10⁻⁷ cm2 s−1, respectively. The sum of transport numbers,  or
or  were directly measured for experiments conducted at intermediate states of charge/discharge. The sum of transport numbers were found to be directly related to the fraction of each species in the bulk electrolyte. The transport numbers of the vanadium species can be directly related to the loss in faradaic efficiency of the VRFB, and the transport numbers reported here are in agreement with efficiency losses reported in the literature.55
Acknowledgments
This material is based upon work supported by the National Science Foundation Graduate Research Fellowship under grant no. (DGE - 1644869). Any opinion, findings, and conclusions or recommendations expressed in this material are those of the authors and do not necessarily reflect the views of the National Science Foundation.