
Abstract
Overcharge presents a serious safety concern for large scale applications of Li-ion batteries. Despite the availability of several studies of aging-induced and overcharge-induced degradation, there still exists a knowledge gap of what would happen if both degradation mechanisms simultaneously occur. In this work, commercial graphite/LCO pouch cells (5 Ah) are continuously cycled at different upper cutoff voltages, 4.2 through 4.8 V, to elucidate the cumulative effect of the overcharge process on the long-term cycling. As the upper cutoff voltage is extended, the cell gains a higher initial capacity but the cycle life diminishes significantly. Cells overcharged beyond 4.5 V experience significant volume expansion and a high rate of capacity fade, as well as a considerable increase in the temperature and internal resistance. Lithium plating and electrolyte decomposition are observed in cells charged beyond 4.5 V, with SEM-EDS verifying their presence. Electrochemical evidence of both degradation modes appears as a voltage undershoot in the discharge curves. A comparative study of various State of Health (SoH) estimation parameters is presented with the introduction of a new dimensionless SoH indicator, ΦR, based on internal resistance measurement. The proposed degradation number is found to be a good indicator of aggravated degradation in Li-ion cells.
Export citation and abstract BibTeX RIS

This is an open access article distributed under the terms of the Creative Commons Attribution Non-Commercial No Derivatives 4.0 License (CC BY-NC-ND, http://creativecommons.org/licenses/by-nc-nd/4.0/), which permits non-commercial reuse, distribution, and reproduction in any medium, provided the original work is not changed in any way and is properly cited. For permission for commercial reuse, please email: permissions@ioppublishing.org.
Humanity faces the challenge of satiating the ever-increasing energy demand. This has led to rapid growth in the adaptation of renewable sources of energy, such as wind and solar. Although they produce the cleanest form of energy, the fluctuations in electricity generation from these sources present a great challenge to integrate it into the grid. Energy storage is required to compensate for the fluctuations and balance the supply and demand of electricity. Electrochemical systems, such as lithium-ion batteries (LIBs) are one of the most common techniques to store energy because they can produce electricity without any harmful emissions and minimal maintenance requirement.1,2 LIBs come as a boon to facilitate the use of renewable energy sources; however, safety-related incidents remain a concern. Although stringent battery safety standards are being followed in the industry, accidents involving LIBs are still frequently witnessed.3 To prevent these accidents from occurring, it is important to understand the various off-nominal conditions leading to catastrophic events.
Aging-induced degradation
To enhance battery life, a thorough understanding of cell and battery aging mechanisms become essential. The capability of LIBs to store energy depletes over time and this phenomenon is defined as capacity fading (CF). Capacity fade may be a consequence of long-term cycling, unsuitable storage conditions, or an unanticipated abuse condition. Battery aging can be broadly classified in two ways: calendar aging and cycle aging. Calendar aging refers to the capacity loss that occurs when the cell is on the shelf and not in use.4 Cycling aging refers to capacity fade and degradation of a cell being used continuously. Cycling rate,5 operating temperature,6 voltage range,7 and the charge-discharge protocol5 are the major parameters that affect the battery life and the extent of degradation.
The degradation of the components, including the electrodes, electrolyte, separator, and current collectors, is attributed to several chemical side reactions that occur along with long-term cycling8 or with storage under unfavorable conditions. The reasons can be classified as loss of active material on the positive and the negative electrode, loss of the lithium inventory, and electrolyte decomposition.9,10 The reaction between the anode, usually graphite, and the electrolyte forms a passivating layer commonly known as solid electrolyte interphase (SEI). SEI layer growth, due to cycling, results in a reduction of the lithium inventory, electrolyte decomposition, and an increase the cell internal resistance.11,12 The capacity loss that occurs in the initial cycles is dominated by the SEI growth and the capacity under load is observed to have a linear dependence on the charge throughput.13,14 Schuster et al.10 report an aberration from the linear dependence and have observed the appearance of nonlinear aging after prolonged cycling for NMC/graphite cells at moderate temperature and charging rates. The transition point from linear to nonlinear degradation is believed to be the point where lithium plating becomes the dominant degradation process.15
Lithium plating most commonly occurs during charging under extreme conditions, such as very low temperature16,17 or high charge rates.18 Charging the battery under these conditions can lead the anode potential to fall below 0.0 vs Li/Li+, thus, not allowing the lithium to intercalate and instead depositing on the graphite anode active material surface. This phenomenon results in consumption of lithium inventory and consequently in the cell capacity fade.19–21 The plated lithium can again react with the electrolyte to form a new layer of SEI or can detach from the surface becoming dead lithium.22 Furthermore, the consumption of electrolyte through SEI formation can result in electrolyte dry-out, causing some electrode area to become inactive and accelerating capacity fade.23 In the worst-case scenario, the plated lithium layer may grow in dendritic structures, which can pierce through the separator causing an internal short circuit and resulting in a catastrophic situation.
The likelihood of lithium plating increases over the lifespan of the battery due to deterioration of ionic kinetics in the anode due to SEI growth.10 Additionally, the anode pores can become clogged by SEI or the SEI can thicken, reducing ionic transport pathways in the anode and increasing the local current density and propensity for lithium plating near the anode-separator interface.15,24 Yang et al. conducted a study of long-term aging behavior for NMC/graphite pouch cells and reported an anomalous voltage undershoot at high discharge rates of 3C. This behavior has been reported in the study of cells at freezing temperatures and is a typical indicator of poor electrolyte performance.16 Voltage undershoot may be an indication of rapid self-heating, dissolution of plated lithium, or a combination of both factors.
Overcharge-induced degradation
The failure of a Battery Management System (BMS) to stop charging cells/cell banks beyond the upper cutoff voltage recommended by the manufacturer, is the primary cause for overcharging a cell and consequently the battery.25 Zhang et al. define overcharge as a state when electricity is forced through even after it has gained full capacity.26 Over the years, both experimental27–31 and model-based32,33 efforts have been undertaken by researchers to understand the behavior of LIBs under overcharge abuse condition. For LCO cathode, irreversible structural changes and cobalt dissolution becomes the cause of active material loss when delithiated beyond 4.5 V.34 As the cathode potential rises above 4.5 V, the electrochemical stability window of the electrolyte is also exceeded and decomposition of the electrolyte is observed. Although most commercial cells are designed with an anode-to-cathode capacity ratio greater than 1 to inhibit lithium plating, the intercalation sites in the anode start filling up in extreme overcharge conditions and as the anode becomes completely lithiated, lithium starts plating on the anode active material surface.35
Gas and heat generation attributed to the occurrence of the various side reactions are the most commonly reported characteristics observed during overcharge.33 The cathode is the major source of heat generation, since the cobalt dissolution process is accompanied by a release of oxygen from the cathode, resulting in rapid gas evolution and exothermic reactions with the electrolyte.36 The increase in cell temperature facilitates the exothermic reactions of the plated lithium with electrolyte as well as the surface layer formation at the cathode. Both processes cause gas generation, which increases the cell internal pressure.37,38 Gas generation is believed to displace the electrolyte and block the ionic path for transport of Li+ ions, thus making a region of electrode inactive and resulting in the capacity fade.31 It was determined by Metzger et al. that during the overcharge test of LIBs, CO2 and CO are produced at cathode, whereas H2, CH4, C2H4 are formed at the anode.39 While gases can be vented safely in a cylindrical cell format, pouch cells contain no vents and the gas generation can lead to severe swelling and, in extreme cases, cell rupture.27 The cell rupture exposes lithium to the atmosphere, resulting in an exothermic reaction with moisture present in the air, and aerosolizes the flammable carbonates in the electrolyte.40 Along with this, the growth of lithium dendrites may pierce through the separator, causing an internal short circuit and even further increasing the cell temperature. The heat generated through the side reactions and the internal short circuit can lead to thermal runaway. This becomes a serious issue when the cell is embedded in a module or stored close to other cells, since the cell to cell propagation of thermal runaway can be even more catastrophic.41 Thermal runaway induced by overcharge is considered harsher than the other abuse conditions as the cells gain additional energy while overcharging.
The extent of degradation in overcharge depends on various factors such as C-rate, operating temperature, size, architecture, and chemistry of the cell. Ouyang et al. conducted a short-term performance study on a single time overcharge NMC + LMO/graphite pouch cells. Fresh cells were overcharged one time at different SOCs > 100% up to 155% SOC. Then, the cells were cycled in the recommended voltage window in order to investigate the overcharge-induced capacity fade. Capacity fade occurred until 120% SOC with an increase in the internal resistance. At 140% SOC, the cell started swelling and loss of active material took place. At 167% SOC the cell ruptured.42 Leising et al. studied the effect of C-rates for an overcharge of prismatic LCO/graphite cells. They observed that at low C-rates swelling, temperature and internal resistance increased at a lower rate as compared to the cells overcharged at higher C-rates.43
Current work
Despite the availability of several studies of aging-induced degradation and overcharge-induced degradation, there still exists a knowledge gap of what would happen if a LIB is continuously cycled under an overcharge condition. It is important to understand how the increase in the voltage window affects the capacity retention, cycle life, and degradation of the cell components. The objective of this work is to understand the degradation behavior of Li-ion pouch cells when cycling under overcharge extremes. This study aims to provide an in-depth understanding of such degradation mechanisms and be a guide in the development of safer battery systems.
Experimental
In this study, a 5 Ah commercial pouch cell obtained from a reputable vendor, with a specific energy of 190 Wh kg−1, is used as the working cell for the electrochemical test. The pouch cell has graphite (C) and lithium cobalt oxide (LCO) as its anode and cathode, respectively. The electrochemical tests are carried out at ambient temperature using a battery tester (Arbin, BT-2000). Voltage, current, resistance, temperature, and capacity are recorded for each cycle and further used to analyze the results. The sampling rate for all tests and parameters is 1 Hz.
Conditioning test
Prior to any test, a conditioning cycle is conducted on every cell under the recommended voltage window, Esafe = [2.7, 4.2] V, given by the manufacturer. The conditioning test helps to evaluate the charge/discharge capacity accounting for the cell-to-cell variation and to bring the cells back to their actual capacity in case they were store for a long time. The conditioning test consists of three cycles using a Constant Current—Constant Voltage (CCCV) charge and a Constant Current (CC) discharge at a C/10-rate with a cutoff current of C/50 (100 mA). A 30-min rest is left in between the charge and discharge process.
Long-term cycling
After performing the conditioning test, the cells are subjected to long-term cycling at different overcharge levels. The cells are charged up to the upper cutoff voltage, Eupper, at 1C-rate using a CCCV protocol with a C/50 (100 mA) cutoff current. The selection of Eupper values is done in such way that the cell has to be overcharged while still being cyclable, i.e., the cell must not be driven to a no-return point where the cell can no longer be discharged. Thus, a fully discharged fresh pouch cell is overcharged at C/5-rate until failure to characterize the overcharge behavior of the working cell. The electrochemical result is used to select the Eupper values to be used for cycling under the continuous overcharge condition. Figure 1a shows that the cell starts to fail as the voltage rises to 5.0 V. In order to avoid failure of the cell in the initial cycles, the upper cutoff voltages up to 4.8 V are chosen for this study. The cells are discharged to a common lower cutoff voltage, 2.7 V, at 1C-rate using a CC protocol. In between every charge and discharge process, the cell is rested for 30 min with an internal resistance (IR) measurement using the in-built function from the battery cycler, as shown in Fig. 1b. The initial 25-min rest allows the cell to reach thermal and electrochemical equilibrium. At this point, a current pulse train is passed through the cell and the average IR is calculated from the Ohm's law, see Fig. 1c. The in-built function uses a total of 10 pulses with a 1.0C current amplitude (5 A) for a period of 100 ms. Then, the cell is rested for another 5 min before moving to the next cycle. For every cycle, two IR values are calculated: one after the charge, RInt,C, and one after the discharge, RInt,D. Monitoring the IR provides valuable information on the SoH of the cell as it ages. A 20% capacity loss with respect to the nominal capacity of the cell (5 Ah) is set as the stopping criteria for the aging + overcharge test. If the LIB is driven beyond this degradation level, it no longer fulfills the primary application requirements and it compromises the safe and useful operation in a secondary application.44

Figure 1. Design of the long-term cycling protocol. (a) Selection of the cutoff voltages selection based on the voltage response from an extreme overcharge. The onset of failure takes place when the cell reaches 5.1 V. (b) Internal resistance measurement during cycling after charge and discharge process. (c) In-built function method to estimate the average internal resistance.
Download figure:
Standard image High-resolution imageHeat generation
The temperature evolution of the cell is investigated as a function of the SOC, SoH and the upper cutoff voltage during cycling under continuous overcharge conditions. Temperature is monitored using T-type thermocouples (Omega). Cell skin temperature is measured with a thermocouple attached to the side of the cell. A second thermocouple is placed nearby the cell to measure ambient temperature. Heat generation is back-calculated using the inverse heat transfer method proposed by Mistry et al.45 based on the thermal response of the cell. The method is applied to the CC discharge and the CC charge. CV charge is not analyzed because heat generation starts decreasing as a consequence of the current decrement and convection becomes more dominant than the heat generated. An analysis of the energy balance involves the heat generated during the charge/discharge process, heat dissipated to the environment by convection and energy stored by the cell, as shown in Eq. 1,
where m is the mass of the cell (m = 0.097 kg), c is the heat capacity (c = 837 J/(kg K)),45 A is the surface area (A = 12.344 × 10⁻³ m2), T is cell skin temperature (°C), T∞ is the ambient temperature, h is the convective heat transfer coefficient (W/(m2K)), and
  is the heat generation (W). No spatial variation in temperature is considered since
  From all the properties in Eq. 1,
  and
and  varies with time. To account for the temporal variation, the cell temperature is fitted by the analytical expression in Eq. 2.

The time constants (τi) in the exponential function are logarithmically distributed between the Nyquist frequency and the convection time constant, i.e., ![${\tau }_{i}\in \left[{\tau }_{\min },{\tau }_{\max }\right]=\left[2/{f}_{s},mc/hA\right].$](https://content.cld.iop.org/journals/1945-7111/167/9/090547/revision2/jesab9569ieqn5.gif) The number of terms, N, is estimated via a sensitivity test using the coefficient of determination, R2, as the decision criteria.
The number of terms, N, is estimated via a sensitivity test using the coefficient of determination, R2, as the decision criteria.
The convective heat transfer coefficient is assumed to vary with time and it is back-calculated from the resting period, after the discharge process, when the heat is not generated and convection is the only heat transfer mode. The estimated h value varies as  Once h is known, the heat generation profile can be calculated. This method has the advantage of showing the variation of the heat generation as a function of the SOC rather than estimating a single value with the applied current and the internal resistance,
Destructive physical analysis
At the end of the cycling test, the aged cells are subjected to a destructive physical analysis (DPA) to complement the electrochemical results. Overcharged cells have more energy stored than fresh cells; hence, opening them poses a threat to safety. For that reason, the cell autopsy is carried out in an argon filled glovebox (H2O and O2 content < 0.1 ppm, MBraun) at a fully discharged condition to minimize the risk of a hazard.
An effort has been made to measure the volume expansion in the cells by quantifying the increase in cell thickness, taking a fresh cell as the reference for comparison. The fixture has two parallel acrylic plates fastened at the ends with 4 sets of nuts and bolts. The cell is placed between the two plates and is tightened using the screws until the cell stopped moving and remained fixed in that position. A Vernier caliper is used to measure the inner distance between the plates at 12 different locations (3 on each side).
Electrodes taken out after dismantling the aged cells are studied via Scanning Electron Microscopy (SEM) (Hitachi S4800) and Energy Dispersive X-ray Spectroscopy (EDS) techniques. Representative samples are extracted by cutting small pieces of electrodes inside of the glovebox and then transferred to the microscope. A 30 kV acceleration voltage and 10 μA current are used to get the SEM images at different magnifications. EDS analysis is also done on the same samples to get the chemical composition of the electrodes.
Gas chromatography/mass spectroscopy (GC/MS)
The electrolyte collected while conducting the cell DPA is analyzed with the Agilent 5975C MSD equipment. The chromatographic separation is performed using a DB-5MS column (30 M × 0.250 mm × 0.25 μm film). Helium is used as the gas carrier with a constant flow rate of 0.8 ml min−1. Electron impact and chemical ionization are obtained in the mass range of 45–500 atomic mass unit (amu). The injector temperature is 250 °C and the split ratio of 1:20 is used with 1 μl of the sample being injected.
Results and Discussion
Cycling performance
The typical protocol used for cycling the cell under continuous overcharge is exemplified with the cycling profile for the cell cycled in the voltage range of [2.7, 4.8] V, see Fig. 2a. In agreement with previous results, as the cell degrades, capacity decreases, maximum temperature increases, CC charge time decreases, and the CV charge time extends. The temperature during discharge is greater than during charge due to morphological differences between the electrodes and the asymmetrical intercalation/deintercalation rates.46
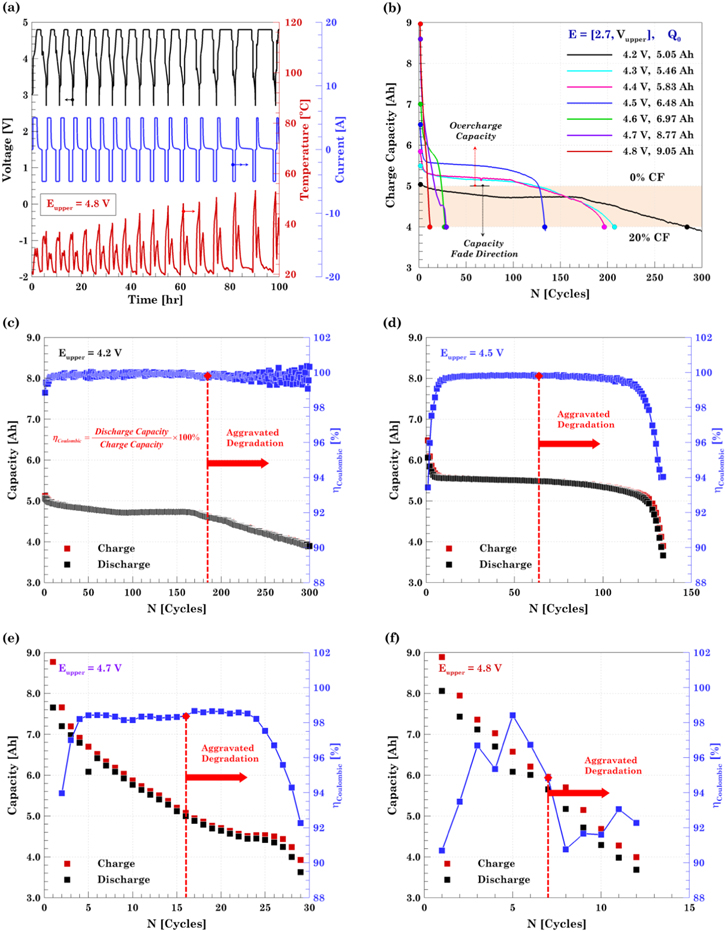
Figure 2. Long-term cycling and cycle life. (a) Representative cycling protocol corresponding to the 4.8 V cell. (b) Capacity fading definition and cycle life comparison. Capacity fading and coulombic efficiency for (c) aging dominated regime, 4.2 V; (d) slight overcharge regime, 4.5 V; (e) overcharge dominated regime, 4.7 V; and (f) extreme overcharge regime, 4.8 V. The red dashed line represents the cycle at which degradation is exacerbated..
Download figure:
Standard image High-resolution imageFor this study, the end of life capacity has been set to 4 Ah. This charge capacity represents 20% capacity loss with respect to the nominal capacity, 5 Ah, and was used as the stopping criteria for all the tests, Fig. 2b. The additional capacity obtained above 5 Ah due to the charge to higher end-of-charge voltages, is defined as the overcharge capacity. An initial comparison of the long-term cycling at the different end-of-charge cutoff voltages is shown in Fig. 2b, and Table I. The charge capacity for the first cycle, denoted by Q0, are the actual values obtained with charging to the various overcharge conditions. The cell attains maximum capacity (9.05 Ah corresponding to an 81% overcharge capacity) when cycled from 2.7–4.8 V and least (5.05 Ah corresponding to only 1% overcharge capacity) when cycled from 2.7–4.2 V. As expected, the results indicate that as the upper cutoff voltage increases, the cell decay increases rapidly, Fig. 2b. The cell cycled under the safe voltage window of 2.7–4.2 V faded to 3.95 Ah (21.7% CF) in 290 cycles whereas the cell cycled in the voltage window of 2.7–4.8 faded to 3.99 Ah (55.9% CF) in 12 cycles. The final capacity for the 4.3, 4.4, 4.5, 4.6, and 4.7 V cells is: 3.97 Ah (27.2% CF), 3.96 Ah (32.0% CF), 3.89 Ah (39.9% CF), 3.95 Ah (43.3% CF), and 3.92 Ah (55.3% CF), respectively. So, there exists a trade-off between the initial capacity obtained and the cycle life of the cell. By expanding the voltage window, i.e., by increasing the extent of overcharge, a higher initial capacity can be obtained whereas the cell cycle life is compromised.
Table I. Summary of cell cycle life under overcharge extremes.
| Eupper [V] | Initial capacity [Ah] | Initial capacity normalized w.r.t. nominal capacity | Final capacity [Ah] | Final capacity fade normalized w.r.t. initial capacity | Number of cycles |
|---|---|---|---|---|---|
| 4.2 | 5.05 | 101.0% | 3.95 | 21.7% CF | 290 |
| 4.3 | 5.46 | 109.2% | 3.97 | 27.2% CF | 209 |
| 4.4 | 5.83 | 116.6% | 3.96 | 32.0% CF | 198 |
| 4.5 | 6.48 | 129.6% | 3.89 | 39.9% CF | 134 |
| 4.6 | 6.97 | 139.4% | 3.95 | 43.3% CF | 28 |
| 4.7 | 8.77 | 175.4% | 3.92 | 55.3% CF | 29 |
| 4.8 | 9.05 | 181.0% | 3.99 | 55.9% CF | 12 |
Depending on the overcharge level, two degradation mechanisms, aging and overcharging, compete in terms of the degradation dominance. Thus, the cell cycled up to 4.2 V is purely dominated by the normal aging processes, including SEI growth and age-induced lithium plating. By contrast, the long-term performance from the cell cycle up to 4.8 V, is fully dominated by the degradation mechanisms associated to overcharge, including cathode structural instability, overcharge-induced lithium plating, and gas generation. In between the two upper cutoff voltage extremes, there is a competition between aging and overcharging. The long-term cycling results allow elucidating that at 4.6 V, the overcharge effect becomes dominant and cycle life gets significantly reduced as shown in Fig. 2b. Based on the long-term cycling and the overall results, the tests are grouped into four regimes according to similarity in electrochemical and thermal characteristics. For that reason and from hereafter, only one representative result from each of the following groups is presented.
Aging dominated regime
This degradation scenario is represented by the cell cycle up to Eupper = 4.2 V, i.e., the safe voltage window. Capacity fade results from this cell are mainly due to conventional degradation mechanisms. This cell achieves an initial capacity of 5.05 Ah and it takes 285 cycles to reduce it to 80% of the nominal capacity. The capacity fading plot for this scenario is shown in Fig. 2c. Capacity fades quickly during the first cycles due to SEI formation. Once the SEI layer becomes stable, capacity decreases at a slower rate until pore clogging and lithium plating takes place (NCycle ≈ 170) and then capacity fades at a faster rate.
Slight overcharge regime
This degradation scenario is represented by the cells charged up to Eupper = 4.3, 4.4, and 4.5 V. Aging-related SEI growth still dominates the degradation phenomena with a slight contribution from overcharge as the LCO cathode is delithiated beyond its reversible limit. The 4.3, 4.4, and 4.5 V cells achieve an initial capacity of 5.46, 5.83, 6.48 Ah, and they take 209, 198, 135 cycles, respectively, to reduce their charge capacity to 4.0 Ah, as shown in Fig. 2d. The increased transport resistance associated with SEI growth leads to the transition from the linear to non-linear capacity fade trend (NCycle ≈ 120) and the eventual presence of lithium plating.
Overcharge dominated regime
This degradation scenario is represented by the cells charged up to Eupper = 4.6 and 4.7 V. Degradation phenomena associated with overcharge becomes dominant with a minor degradation associated with aging. The 4.6 and 4.7 V cells achieved an initial capacity of 6.97, 8.77 Ah and both take about 29 cycles, for the capacity to drop to 4.0 Ah. The capacity fading plot for this scenario is shown in Fig. 2e. At this level of overcharge, the electrolyte decomposes at the cathode and the anode reaches its intercalation limit, causing lithium plating. Additionally, the structural collapse of the LCO becomes increasingly severe with higher voltage, causing increased cobalt dissolution and oxygen evolution. The two cells under this condition exhibit a slight volume expansion due to the aforementioned gas generation processes.
Extreme overcharge regime
This degradation scenario is represented by the cell charged up to Eupper = 4.8 V. Degradation imposed by overcharge drastically hinders the cell cyclability and leads the cell to an early failure. This cell achieved an initial capacity of 9.05 Ah and it took 15 cycles to reduce it to the end of the cycle life. The capacity fading plot for this scenario is shown in Fig. 2f. The cell under this condition swelled to a size almost twice its initial volume. Lithium plating and electrolyte decomposition are the two degradation mechanisms behind the accelerated capacity fade. The electrolyte decomposition not only generates the gases but also reduces the pathways in the electrolyte to transport the Li-ions. Coulombic efficiency, η, is defined as the ratio of discharge to the charge capacity. It is an indicator of how much energy can be extracted from the LIB with respect to the energy stored. Low coulombic efficiency signifies that less discharge capacity is obtained as compared to the charge step, indicating that the cell is losing capacity as a consequence of side reactions. Figures 2c–2f shows the evolution of the coulombic efficiency with its corresponding charge and discharge capacity. Coulombic efficiency is low at the beginning of the aging test due to the formation of the SEI passivating layer. As aging goes, η increases again since lithium inventory stops decreasing as the SEI becomes stable. At the end of the cycle life, η decreases again as the chemical and electrochemical degradation takes over the cell performance. In extreme cases such as the cells charged up to 4.6, 4.7 and 4.8 V, the η does not show the characteristic parabolic trend and starts decreasing at a faster rate due to additional side reactions.
It is important to have knowledge of SoH in order to predict the occurrence of any severe failure and avoid hazardous events.47 Although the point at which the cell starts failing faster can be inferred directly from the capacity fade plot, an analytical way to predict the onset of rapid degradation needs to be explored. Two previously proposed methods of doing so are differential analysis of capacity (dQ/dN) and coulombic efficiency (dη/dN) with respect to the number of cycles, as shown in Fig. 3.48 Third-order and sixth-order polynomial are found to be the best fit for the charge capacity and coulombic efficiency data, respectively. The peaks obtained in the dQ/dN serves as an indicator for aggravated cell degradation. In the aging-dominated regimes, this transition from linear to nonlinear capacity fading is related to the onset of lithium plating. Similarly, the point at which the dη/dN crosses zero indicates the point where the coulombic efficiency reaches its maximum value. Usually, the coulombic efficiency increases in the first few cycles and remains relatively constant until the cell starts to fail. There are several points in the dη/dN curve at which the curve crosses zero, see Figs. 3a–3b. Although multiple zeros can be found, only a few of them represent the onset of faster degradation, so the selection must be done with the aid of the capacity fade plot. This brings to light a clear limitation of the strategy, since there is no definite way of knowing which zero is the correct one. A general trend visible in both the plots for dη/dN and dQ/dN is that as the upper cutoff voltage is increased the number of cycles for initiation of aggravated degradation decreases. For example, the prediction for the onset of failure for a cell cycled up to 4.2 V is 140 cycles and 95 cycles as per the dη/dN and dQ/dN, respectively. Whereas, for the cell cycled up to 4.8 V the prediction for the onset of failure is 5 cycles and 7 cycles as per the dη/dN and dQ/dN, respectively. The discrepancies between the predictions made by the differential coulombic efficiency and the differential capacity do not allow elucidating the cycle where the cell starts fading fast.
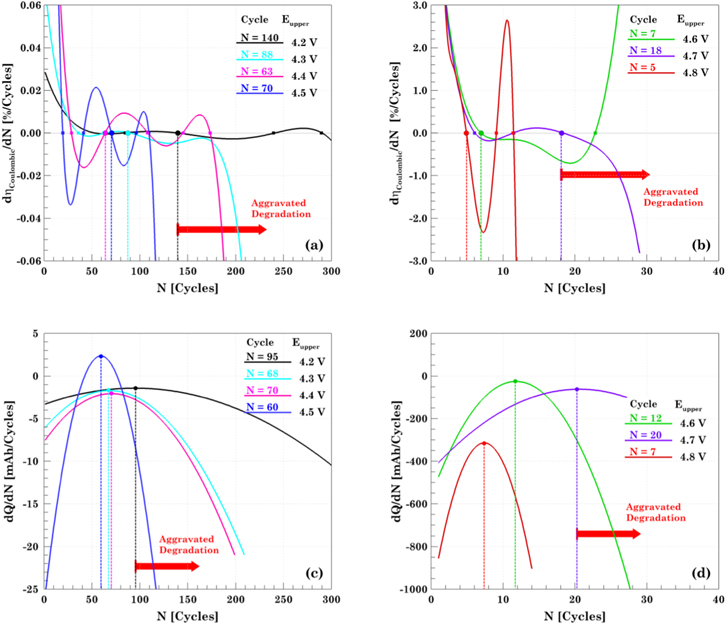
Figure 3. State of health prediction based on the aggravated degradation onset. Differential coulombic efficiency for (a) the aging dominated and slight overcharge regimes, 4.2–4.5 V; and (b) overcharge dominated and extreme overcharge, 4.6–4.8 V. The onset of aggravated degradation is represented by the maximum coulombic efficiency. Differential capacity analysis for (c) the aging dominated and slight overcharge regimes, 4.2–4.5 V; and (d) overcharge dominated and extreme overcharge, 4.6–4.8 V. The peak of the parabola represents the capacity trend changes, in particular, the cycle where capacity starts fading faster.
Download figure:
Standard image High-resolution imageInternal resistance (IR) is another indicator for the prediction for SoH and consequently for the aggravated degradation. Two major inferences can be made by observing the data presented in Fig. 4. Firstly, it can be observed that the cell internal resistance increases at the end of life, indicating that the cell has started degrading. Another notable inference is that as the upper cutoff voltage is increased, the IR magnitude increases at a faster rate. Moreover, the resistance of the cell charged up to a higher voltage increases in a lesser number of cycles. For example, both the charge and discharge resistance of the cell cycled from Eupper = 4.2 V goes from 28.7 to 35.8 mΩ (24.7% increment) after 285 cycles. However, for a cell cycled up to Eupper = 4.8 V, the resistance of the cell increases from 17.8 to 44.4 mΩ in just 13 cycles. The rise in the internal resistance of the 4.2 V cell is mainly attributed to SEI layer growth and electrolyte dry out; and LCO structural collapse and electrolyte decomposition at both electrodes, in the 4.8 V cell.49

Figure 4. Internal resistance evolution at the end of the charge/discharge process and proposed degradation number for the (a) aging dominated regime, 4.2 V; slight overcharge, (b) 4.3 and (c) 4.5 V; (d) overcharge dominated, 4.6 V; and (e) extreme overcharge, 4.8 V. (f) Cycle number predicted by each SoH parameter representing the onset of aggravated degradation.
Download figure:
Standard image High-resolution imageThe magnitude of resistance at the end of the discharge is higher than the one at the end of the charge when the cells are fresh. The discharge resistance remains higher for the majority of the initial cycles but after a point, the charge resistance becomes larger than the discharge resistance. Owing to this characteristic trend a non-dimensional parameter ΦR has been defined and proposed as an indicator of aggravated degradation. The proposed degradation number, ΦR, is defined as the following ratio,
The proposed SoH indicator is negative when the cell is fresh since RInt,C > RInt,D. The cell is said to experience aggravated degradation when ΦR crosses the zero mark. The cycle number where the crossing happens is indicated in Figs. 4a–4e, e.g., for the cell cycle up to 4.5 V, ΦR = 0 at the 51st cycle. At this point, the resistance at the end of the charge surpasses the discharge one due to the degradation imposed by cycling and overcharging the cell. Although the exact cause of this observation is unclear, it may be related to the reversible plating and stripping of metallic lithium at the anode on each charge and discharge.
To compare the accuracy of all the SoH indicators analyzed in this study, a comparative study with the actual point at which the cell starts to fail faster has been presented in Fig. 4f. The "actual" point is obtained by directly analyzing the capacity fade results. It can be observed that for cells in the aging dominated and slight overcharge regimes, ΦR is a better predictor as compared to the other parameters. The inaccuracy of the dQ/dN and dη/dN predictions comes from the fact that both the capacity fade and the coulombic efficiency curves are relatively flat, making it difficult to predict the onset of fast failure. For the cells in the overcharge dominated and extreme overcharge regimes, all three parameters are very close to the actual point of failure. Overall, ΦR is found to be the best predictor of aggravated degradation and can be utilized for SoH monitoring in LIBs. Based on the cycle prediction done via the degradation number, voltage profiles are obtained at five cycles corresponding to: first cycle (0% CF), last cycle (20% CF), and the cycle where faster degradation starts (ΦR = 0), as well as two more cycles in between the last three points, see Figs. 5a–5d.
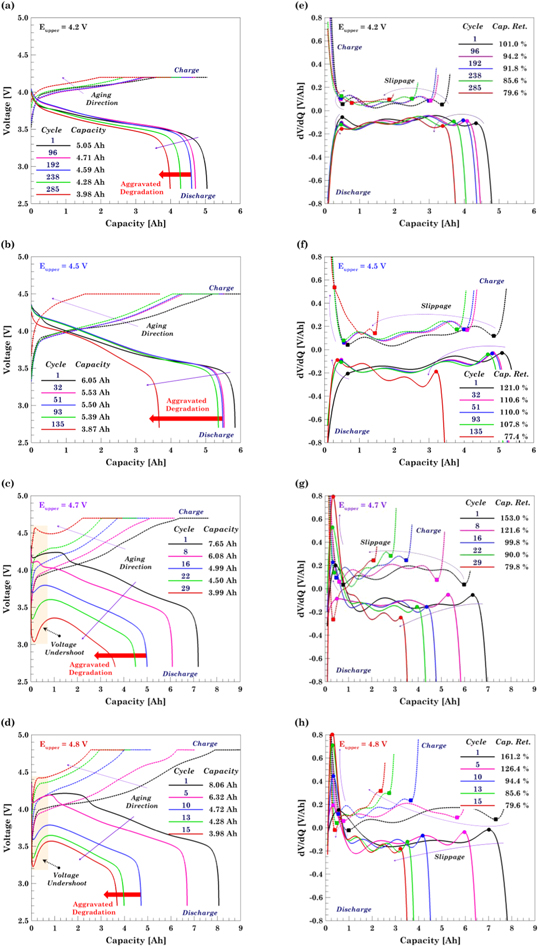
Figure 5. Charge/discharge voltage profiles at different degradation levels for the (a) aging dominated regime, 4.2 V; (b) slight overcharge regime, 4.5 V; (c) overcharge dominated regime, 4.7 V; and (d) extreme overcharge regime, 4.8 V. Differential voltage curves obtained by differentiating the 7th order polynomial fitting curves associated to the (e) 4.2, (f) 4.5, (g) 4.7, and (h) 4.8 voltage curves. Electrolyte degradation and pore clogging in graphite are the main causes behind the voltage undershoot on the cells charged beyond 4.6 V. Horizontal peaks slippage in the differential voltage curves indicates the capacity loss rate.
Download figure:
Standard image High-resolution imageLong-term cycling results show that the number of cycles to retain capacity decreases with an increase in upper cutoff voltage. However, a sudden drop in the cycle life is observed when the cell is driven into the overcharge dominated regime, Eupper ≥ 4.6 V. In order to further investigate the reason, voltage vs capacity plots are shown in Figs. 5a–5d. The four cells cycled up to 4.2, 4.3, 4.4, and 4.5 V are similar to a typical voltage capacity curve of lithium-ion. This confirms the hypothesis that overcharge has a reduced effect on the cell degradation in the voltage range of [2.7, 4.5] V, although it is expected that this range would depend strongly on cell design and cathode chemistry. An aberration is observed when the upper cutoff voltage is increased beyond 4.5 V. A unique feature of "voltage undershoot" is observed for all the plots shown in Figs. 5c–5d. In the discharge curve for cells charged up to 4.6, 4.7 and 4.8 V, the voltage decreases to a low value (local minima) and suddenly starts to increase. The occurrence of this voltage undershoot is considered a typical indicator of poor electrolyte performance and occurs when the cells transitions from linear to non-linear aging, resulting in lithium plating.15 The subsequent occurrence of SEI growth along with lithium plating clogs the pores near anode-separator interface and increases the transport resistance in the electrolyte. At the beginning of discharge, plated lithium is reversibly stripped from the graphite, unclogging the pores and relieving the overpotential due to transport resistance.15,16 However, a portion of the plated lithium is irreversibly converted to SEI products or electrically isolated, causing the transport resistance to increase with each cycle. The magnitude of voltage undershoot increases as the cell ages and as the upper cutoff voltage is increased, since both increase the propensity for lithium plating.
To elucidate the overcharge behavior of the cell and further investigate the changes occurring during the overcharge reaction, a differential voltage (dV/dQ) analysis is performed. Differential voltage plots shed light on how the cell resistance varies as a function of the SOC. Data for CC charge and discharge is acquired and a 7th order polynomial is found to be the best fitting curve for the experimental data and from them, dV/dQ is calculated. The mirror trend between the charge and discharge dV/dQ curves arises from the numerical method. The vertical asymmetry between the two processes is an enhancement of the morphological difference between anode and cathode and their intercalation reaction rates.46
One similar trend observed in all the plots is that as the capacity decreases, there is a slippage of the peaks towards left. This is considered a characteristic feature of the aging process and it is associated with a reduction of capacity utilization.50 The dV/dQ curve signifies the temporal variation of resistance and the peaks represent the completion of a transition between phases in the electrodes. Voltage undershoot is reflected as a large initial peak indicating a fast increase in the cell internal resistance due to pore clogging and a subsequent fast decrease in resistance as the plated lithium is stripped. The U-shape of the dV/dQ plot implies that the cell internal resistance is larger when the cell is fully discharged and fully charged and it keeps increasing as the cell is driven farther away from the recommended voltage window.
Thermal response
Thermal response for the charge and discharge cycles in Figs. 5a–5d is shown in Figs. 6a–6d. It can be inferred from all the plots that the temperature of the cell increases with an increase in the capacity fade and the number of cycles. It should also be noted that the cell temperature rise during each cycle is related to Joule heating. For the charge cycle, the temperature first increases and reaches a maximum until the end of the CC charge process then starts decreasing in the CV phase. Temperature decay in the CV phase occurs due to a drop in the Joule heating (i2RInt) as a consequence of the charging current decay. The thermal signature difference between charge and discharge is due to the fact that entropic (reversible) heat is endothermic during CV step of the charging process and exothermic during discharge, whereas the ohmic and kinetic (irreversible) heat are always exothermic for both cases. Thus, the total heat generated during the discharge is always greater than the charge one.

Figure 6. Temperature profiles for the charge/discharge process at different degradation levels for the (a) aging dominated regime, 4.2 V; (b) slight overcharge regime, 4.5 V; (c) overcharge dominated regime, 4.7 V; and (d) extreme overcharge regime, 4.8 V. Heat generated curves for the (e) 4.2, (f) 4.5, (g) 4.7, and (h) 4.8 V cells are obtained via an inverse heat transfer method. Voltage undershoot effect from the cells charged up beyond 4.6 V induces a larger heat generation particularly for the discharge process. Horizontal peaks slippage indicates capacity loss with cycling and vertical slippage represents the degradation effect on the cell.
Download figure:
Standard image High-resolution imageAs the cell degradation aggravates, the maximum temperature change also increases. For instance, the temperature rise for the 4.5 V cell at the end of the discharge is 19.2 °C after 20% CF as compared to the 15.2 °C from the initial cycle. Hence, it can be inferred that structural degradation of LCO contributes to temperature change through the exothermic reaction of released oxygen with the electrolyte. LCO degradation also increases the cell internal resistance and thus the ohmic heat generation. For the cells charged up to 4.7 V and 4.8 V, the maximum temperature rise is approximately 35 °C. Hence, charging the cell to a higher upper cutoff voltage will increase the cell temperature. The effect of the voltage undershoot phenomenon, associated with high electrolyte transport resistance, is reflected as a fast temperature rise in the cells charged beyond 4.6 V. The generated gases within the cell, from the exothermic reactions between the electrolyte and LCO electrode, increase the internal pressure, lead to swelling, and raise the internal temperature. Although swelling is more severe in the 4.8 V cell, the temperature rise is smaller than in the 4.6 and 4.7 V cells. A possible reason is that the gases generated during overcharge can cause separation of the electrodes and electrochemically secludes certain regions reducing the reaction area and increasing the heat generated.
Heat generation (Figs. 6e–6h) directly correlates with the dV/dQ (Figs. 5e–5h) curve and its peaks. The heat generation peaks, at the beginning of the charge/discharge, align with the fast internal resistance rise. The irreversible heat associated with the Joule heating effect dominates the cell thermal response. When the voltage undershoot occurs in the 4.6 and 4.7 V cells, the additional peak in the dV/dQ curve translates as a new peak in the heat generation curve. As the SOC increases the heat generation decreases because the internal resistance also decreases. At the end of the charge, heat generation and cell temperature rise again.
Destructive physical analysis
Cell swelling is a well-known characteristic of overcharge in a pouch cell due to electrode degradation and gas evolution. The average thickness of a fresh cell (3.7 V) is 8.5 mm. A slight increase in the cell thickness is observed for the cell cycled under the aging dominated (4.2 V) and the slight overcharge regime (4.3–4.5 V). On the other extreme, the cell cycled up to 4.8 V experienced a 300% increase in its thickness, Figs. 7a–7b. At higher voltages, electrolyte reduces at the LCO cathode and produces gases in between the LCO-separator interface. Moreover, the Li-plating on anode also reacts with electrolyte contributing to the gas generation. Gas generation, along with the physical constraints imposed by the pouch edge, creates a bubbling effect that separates the electrodes around the center. Physical alteration of the electrode-separator assembly poses a safety concern because the opposite electrodes can get in contact with each other and produce an internal short circuit that could be disastrous if the cell is in an overcharged condition.

Figure 7. Destructive physical analysis of the cells aged under overcharge condition at the end of the cycle life. (a) Volume expansion and (b) thickness of the cell increase with the extent of the upper cutoff voltage. LCO, (c)–(f), and graphite, (g)–(j), electrodes retrieved after cell autopsy of overcharged cells. No visual evidence of degradation is found in the electrodes extracted from the aging dominated and the slight overcharge regime. The sand-like pattern on graphite from the 4.5 V cell is left by the liquid electrolyte. The marks in the 4.7 V cell are created by micro-internal shorting caused by lithium plating dendrites. In the extreme overcharge condition, 4.8 V cell, degradation starts from the electrode edge to the center.
Download figure:
Standard image High-resolution imageCell DPA also includes analyzing the condition of the cell components. For safety reasons, DPA is conducted in a fully discharged condition. No visual degradation is observed for the cells cycled up from 4.2 to 4.5 V, see Figs. 7c–7d, 7g–7h. However, for the cells cycled to higher voltages, delamination of the LCO active material can be observed. The cathode of cell cycled to 4.8 V shows the highest amount of delamination, particularly in the zones next to edges. The cathode material from the electrode is heavily transferred to the separator. While performing the cell autopsy it is also observed that the extraction of the cathode from the separator got more difficult for the highly overcharged cell, since excessive delithiation of cathode leads to destabilization of LCO microstructure, leading to particle cracking and cobalt migration to the separator and anode.51
Similarly, images of graphite electrodes extracted from all the cells are shown in Figs. 7g–7h. The anode degradation evidence is visually more significant as compared to the cathode one. As the voltage window is extended, the extent of degradation also increases. A closer look at the anode of cell cycled up to 4.8 V reveals traces of lithium deposit around the edges. Moreover, different degree of delithiation is also observed, thus strengthening the result of physical deformation of the electrode due to gas generation. Since the central regions of the electrodes are not being fully utilized, the edges of the cell experience local current densities much higher than the intended 1C rate, causing dendritic lithium deposits to form. A small trace of lithium plating and charring (dark spots) is observed in cells overcharged to 4.6 and 4.7 V. The occurrence of lithium plating on cells charged beyond 4.6 V also corroborates the inference of the voltage undershoot observed in voltage-capacity curves being an indicator of lithium plating.
SEM/EDS
DPA does not provide insights on morphological and chemical changes that occur in the LIB, this becomes evident in the samples from the 4.2 to 4.5 V cells shown in Figs. 7c–7d, 7g–7h. Micrographs of representative samples extracted from the graphite and LCO electrodes are shown in Figs. 8 and 9. SEM image of a pristine electrode is taken as a reference to analyze the extent of degradation.
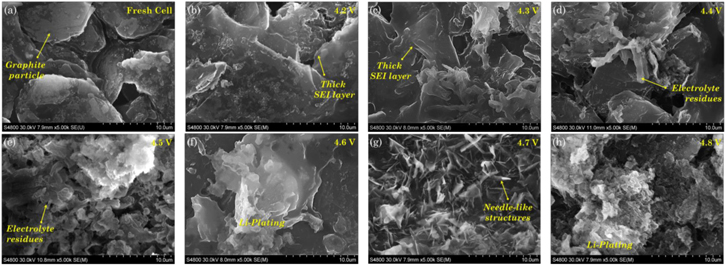
Figure 8. Micrographs of graphite electrode samples extracted from aged cells at different cutoff voltages. (a) Pristine electrode; (b) aging dominated regime characterizes by SEI growth; (c)–(e) slight overcharge regime characterizes with deposits of electrolyte and further SEI thickening; (f)–(h) overcharge dominated and extreme overcharge regimes exhibit different morphologies of Li-plating covering the electrode surface. Scale bar for all images is 10 μm.
Download figure:
Standard image High-resolution image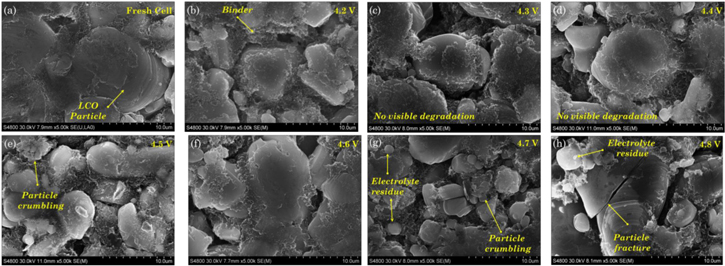
Figure 9. Micrographs of LCO electrode samples extracted from aged cells at different cutoff voltages. No evidence of fracture is found on samples from the (a) pristine electrode; (b) aging dominated regime cell; and (c)–(e) slight overcharge regime cells. Fracture and delamination predominantly happen in the cells under (f)–(g) overcharge dominated, and (h) extreme overcharge condition. Scale bar for all images is 10 μm.
Download figure:
Standard image High-resolution imageConsidering the pristine condition of the graphite electrode as a reference, Fig. 8a, cell degradation is clearly visible as the value of upper cutoff voltage for cycling is increased. Thickening of the SEI layer can be appreciated in the 4.2 and 4.3 V samples as a layer covering the active particle and filling the spaces in between the graphene layers, Figs. 8b–8c. This feature is characteristic of the normal aging process. As the upper cutoff voltage extends, electrolyte starts reacting and residues of electrolyte deposits are observed on the graphite surface. Lithium plating also happens and contributes to electrolyte deterioration. Pore clogging become more evident in the graphite samples from the cells charged beyond 4.5 V, Figs. 8e–8h, support the voltage undershoot hypothesis. The cells charged up to 4.6 and 4.7 V exhibit needle-like structures over the graphite electrode surface, Fig. 8g. The dendritic structures are one of the morphological forms that Li plating typically adopts.52 Dendrites penetrate the porous separator and eventually induce an internal short circuit creating the charred spots on the graphite anode as shown in Fig. 7i.
A demarcation of LCO particle and binder material has been shown in the fresh cell image, Fig. 9a. No visible degradation is found in the LCO samples extracted from the cells aged between 4.2 and 4.6 V, Figs. 9b–9e, show only isolated zones where the active particle crumbles. As the upper cutoff voltage is increased beyond 4.7 V, Figs. 9b–9e, fracture occurs due to a continuous deep delithiation of LCO active material mechanically compromising the microstructure and resulting in delamination of the electrode. Residues of electrolyte are found in the sample under overcharge condition, 4.6–4.8 V cells that could only be observed at large scale.
Degradation at the electrode level is complemented with a chemical composition analysis; see Table II, on the graphite and LCO samples shown in Figs. 8 and 9, respectively. EDS analysis of anode shows that the carbon content is high in the pristine electrode and it decreases as the cells are aged independent of the upper cutoff voltage. SEI thickening increases the amount of oxygen due to the compounds on it, such as lithium carbonate (Li2CO3), lithium hydroxide (LiOH), lithium oxide (Li2O), lithium alkyl carbonate (ROCO2Li, RCOLi),11 where R is the alkyl group. As the upper cutoff voltage is extended beyond 4.6 V, side reactions from the electrolyte and lithium plating increase the content of phosphorous and fluorine producing compounds such as (LiF), hydrogen fluoride (HF), and isopropyl fluorophosphate (C6H14FO3P). The small increment in the cobalt content in the anode with an increase in the overcharge voltage confirms the occurrence of cobalt dissolution.
Table II. Electrodes composition extracted from the EDS test of graphite and LCO electrodes at different overcharge voltages for the samples shown in Figs. 8 and 9a).
| Anode | Cathode | |||||||||||||
|---|---|---|---|---|---|---|---|---|---|---|---|---|---|---|
| Eupper [V] | C | O | F | Al | P | Cu | Co | C | O | F | Al | P | Cu | Co |
| 4.2 | 76.4 | 18.5 | 2.7 | 1.4 | 0.5 | 0.5 | 0.0 | 31.3 | 18.8 | 6.8 | 5.3 | 0.3 | 0.0 | 37.5 |
| 4.3 | 58.0 | 35.0 | 5.0 | 0.8 | 0.7 | 0.4 | 0.1 | 32.9 | 19.8 | 7.3 | 6.1 | 0.7 | 0.1 | 33.1 |
| 4.4 | 40.3 | 45.4 | 3.1 | 8.0 | 0.8 | 2.2 | 0.2 | 33.6 | 19.7 | 7.8 | 2.2 | 0.7 | 0.0 | 36.0 |
| 4.5 | 36.3 | 50.6 | 5.1 | 5.7 | 1.9 | 0.2 | 0.2 | 32.8 | 19.8 | 8.2 | 2.3 | 0.8 | 0.0 | 36.1 |
| 4.6 | 45.2 | 40.8 | 8.6 | 3.2 | 1.3 | 0.7 | 0.2 | 31.5 | 14.7 | 9.6 | 5.2 | 0.2 | 0.1 | 38.8 |
| 4.7 | 37.2 | 53.7 | 3.8 | 1.4 | 2.8 | 0.8 | 0.4 | 34.8 | 19.1 | 5.3 | 4.3 | 0.2 | 0.1 | 36.3 |
| 4.8 | 28.4 | 49.0 | 15.5 | 3.1 | 2.6 | 0.9 | 0.6 | 35.1 | 19.6 | 6.0 | 2.7 | 0.1 | 0.1 | 36.4 |
a)The values listed correspond to the wt% of each element found in the samples.
EDS analysis of cathode shows a slight rise in carbon content as the voltage window is extended, because of the electrolyte decomposition. Cobalt content remains quasi-constant independent of the upper cutoff voltage indicating that main degradation in the LCO electrode is mechanical. Electrolyte reacts with oxygen released by the cathode and slightly increases in its content is observed. The presence of aluminum in both anode and cathode comes from the Al2O3 ceramic from the separator.
GC/MS
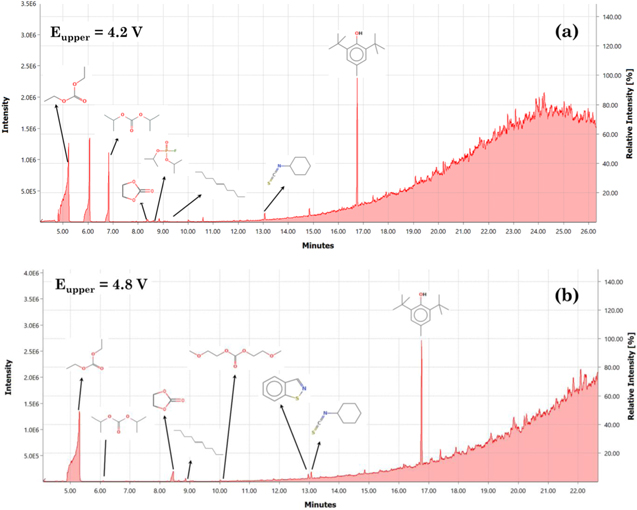
The composition of electrolyte obtained during DPA is analyzed via GC/MS technique and the electron impact ionization spectrums are analyzed using the in-built NIST library. The chromatograms corresponding to the cell cycled under the aging dominated regime, 4.2 V, and the extreme overcharge regime, 4.8 V, are shown in Fig. 10. The chromatograms obtained reveal several peaks corresponding to a specific compound. The presence of diethyl carbonate, ethylene carbonate and butylated hydroxytoluene (BHT) is detected in all cells. Therefore, these components are an integral part of the initial electrolyte composition. BHT is a widely used additive to improve the cycling performance of the cells.53 Presence of di-isopropyl carbonate is also observed in all aged cells. A previous study by Kamui et al. also found the presence of dipropyl carbonate for overcharged and overdischarged cells.54 From the analysis of the electrolyte the presence of isopropyl fluorophosphate is observed, therefore, suggesting that LiPF6 salt also degrades with overcharge.
Figure 10. GC/MS Chromatograms of electrolyte for the cell cycled in the (a) aging dominated regime, 4.2 V; and (b) extreme overcharge regime, 4.8 V.
Download figure:
Standard image High-resolution image
The list of compounds detected after analyzing the GC/MS spectrums for all the cells is listed in Table III. Electrolyte solvents such as ethyl carbonate (EC), diethyl carbonate (DEC) are present in all cells. The carbonic acid solvent is stable until 4.6 V. Beyond that, it decomposes particularly when the graphite potential becomes negative. Some of the byproducts from the overcharge reaction, for cells charged to 4.6–4.8 V, are ethanol, 2 methoxy carbonate, and 1,2-enzisothiazole. Although the study of electrolyte composition is carried out to observe the change in decomposition compounds with an increase in the cycling upper cutoff voltage, the complexity of the produced molecules made it difficult to identify several peaks that were observed in the ionization spectrum. It is also observed that most of the gaseous byproducts get dispersed when the cell is opened.
Table III. Compounds detected in the electrolyte recovered from the cells subjected to cycling under continuous overchargea).
| Eupper [V] | ||||||||
|---|---|---|---|---|---|---|---|---|
| Chemical structure | Name | 4.2 | 4.3 | 4.4 | 4.5 | 4.6 | 4.7 | 4.8 |

|
Diethyl carbonate | × | × | × | × | × | × | × |

|
Carbonic acid | × | × | × | × | × | — | — |

|
Ethylene carbonate | × | × | × | × | × | × | × |

|
5-Decene | × | × | × | × | × | × | × |

|
Dutylatedhydroxy toluene (BHT) | × | × | × | × | × | × | × |

|
Cyclohexyl, isothiocyanate | × | × | × | × | × | × | × |

|
Isopropyl fluorophosphate | × | — | × | — | — | — | — |
|
Ethanol,2 methoxy carbonate | — | — | — | — | × | × | × |

|
1,2-Benzisothiazole | — | — | — | — | — | × | × |
Conclusions
In this work, the interplay effect of both aging and overcharge on pouch cells was studied via a comprehensive experimental and analytical program. The cells were subjected to cycling under continuous overcharge condition wherein the upper cutoff voltage is varied (4.2 through 4.8 V). The electrochemical analysis showed that with an increase in the upper cutoff voltage, cells gain higher initial capacities. However, their cycle life was compromised resulting in a faster and more accelerated degradation.
Four different degradation and cycle life regimes were identified in the test. Cells cycled under the safe voltage window represented the purely aging dominated regime with SEI growth and the delayed onset of lithium plating as the main degradation mechanisms. Slight overcharge regime exhibited a similar behavior to the aging dominated one with an increasing rate of capacity fade due to LCO destabilization and increased SEI growth. Overcharge became more relevant on the cells cycled beyond 4.6 V, where electrolyte decomposition and lithium plating dominate the cell performance. A characteristic feature of this degradation was voltage undershoot. The overcharge extreme regime, 4.8 V, showed an excessive presence of lithium plating and an accelerated production of gases.
The gradual rise in internal resistance is attributed to the growth of SEI and degradation of the LCO, which are seen for the cells charged up to 4.5 V. However, an abrupt increase of cell resistance and faster decay of the cell capacity are observed for the cells charged beyond 4.6 V. Electrolyte decomposition along with the presence of lithium plating on graphite and fracture of LCO active particle are the main reasons for the faster decay. A new dimensionless SoH indicator, ΦR, was introduced in order to predict the onset of aggravated degradation, ΦR = 0. The proposed indicator can be easily integrated into a working battery module and could be utilized as a way to predict battery failures and prevent any hazardous event.
The thermal results indicated that the cell temperature increased with an increase in the upper cutoff voltage. Although the temperature rise is significant as compared to the cell cycled in the aging dominated regime, it is very unlikely that the cell goes into thermal runaway. The destructive physical analysis showed evidence of significant amount lithium plating on the graphite electrode from the cells charged beyond 4.4 V, corroborating the voltage undershoot feature observed in the voltage-capacity curve. Delamination of active material and particle cracking was also observed in cathodes of cells charged up to 4.6, 4.7 and 4.8 V representing destabilization of the cathode structure.
Acknowledgments
Financial support from the Underwriter's Laboratories Inc. is gratefully acknowledged. The Birck Nanotechnology Center characterization and analysis facility at Purdue University is acknowledged.