Abstract
We present a model that enables simulations of concurrent coupled lithium dendrite growth, SEI formation and growth on the dendrite surface, dendrite penetration of the SEI layer, and SEI regrowth. The concept of SEI coverage density is introduced, which is conceptually similar to SEI thickness but broader. SEI and dendrite growth interacts with each other by evolving dendrite morphology, stretching of SEI by the dendrite surface, and the effect of evolving SEI thickness (coverage density) on lithium deposition reaction. The model shows that even under low current density, small protrusions on lithium surface can still grow into dendrites by penetrating SEI and causing inhomogeneous electrical resistance on dendrite surface. We find that dendrite growth shows two distinct stages: fast acceleration during SEI penetration, and stable growth after reaching an equilibrium SEI thickness at the dendrite tip. Under low current density, increasing current scales up the growth rate of dendrite without much shape change. High current density causes dendrite morphology to change significantly, forming a needle shape. We show that local SEI defects/inhomogeneity can induce dendrite formation and growth. Our study suggests that flat lithium surface, uniform SEI layer, and low SEI resistivity are important to reduce dendrite formation.
Export citation and abstract BibTeX RIS

This is an open access article distributed under the terms of the Creative Commons Attribution 4.0 License (CC BY, http://creativecommons.org/licenses/by/4.0/), which permits unrestricted reuse of the work in any medium, provided the original work is properly cited.
Lithium metal, which was first proposed in the 1970s as anode material for rechargeable lithium batteries, has received significant attention recently for its high theoretical capacity (3860 mAh/g) and low negative potential (−3.040 V vs Standard Hydrogen Electrode).1 While lithium metal holds great potential to meet the increasing demand for energy storage, a major challenge is that dendritic and mossy lithium surface can form easily during the lithium deposition process while charging a lithium metal battery, which can potentially cause short circuits.2 Some dendrites might break away from lithium metal and become isolated from the anode, which are known as "dead lithium", leading to the loss of active material and capacity fade.3 Therefore, controlling the surface morphology during lithium deposition is key to successful development of lithium metal battery.
Lithium metal is thermodynamically unstable in organic electrolyte solvents, so that an interphase would form between lithium metal and the electrolyte solution. This thin film on the surface of lithium metal anode, known as the solid electrolyte interphase (SEI), is widely believed to have a significant impact on the cycling performance of lithium metal batteries.4 The formation and growth of SEI consumes active lithium material and electrolyte solvent, resulting in permanent capacity loss, though a SEI layer also passivates the lithium surface and slows down the side reaction. If the electrolyte is not designed carefully, a SEI layer might grow so thick that eventually leads to high-impedance failure of the battery.5 Moreover, the SEI layer is usually not strong enough to accommodate the morphological evolution of lithium surface and can be penetrated by lithium dendrites. Then SEI will regrow on the exposed lithium surface and consume more active materials.6 Due to this inherent coupling between SEI growth and dendrite formation, the distribution and property of SEI have significant impacts on the morphology of lithium metal anode.
Various models have been proposed to simulate lithium dendrite formation and growth during the past decades. The majority of existing models are based on the work of Barton and Bockris in the analysis of silver dendrites,7 which argued that lithium deposition is faster on protrusions because of the larger spherical diffusion flux comparing to the flux toward a flat surface. This flux leads to narrowing of the dendrite tip, while surface tension prevents infinite dendrite thinning.8 Monroe and Newman9 applied this approach in a parallel-electrode lithium/polymer cell and derived a one-dimensional model for an isolated needle-like dendrite. In subsequent papers, they further extended the model to include the effect of mechanical pressure on dendrite growth and evaluated the effectiveness of using bulk solid electrolyte to block dendrite growth.10,11 Haataja et al.12 proposed a model that includes the effect of electrolyte additives on lithium surface morphology in stability analysis. Chazalviel13 introduced a model of dendritic growth in a high electric field where the growth rate is determined by the space charge developed upon the anion depletion near the electrode. This model requires a high current above the critical level to trigger dendrite formation, thus does not apply to those dendrites observed under low currents. The model was supplemented by follow-up papers to include surface non-uniformity as a trigger of dendrite formation under small currents.14,15 Yamaki et al.16 assumed lithium as a fluid and analyzed three types of dendrite shape depending on the values of the surface tension and pressure. Chen et al.17 developed a nonlinear phase-field model to investigate the dendritic pattern as a function of applied voltage and initial electrode surface morphology.
Current works on lithium dendrite growth have neglected the evolving SEI layer on top of it, though the two are inherently coupled. In this paper, we present a model that enables simulations of concurrent lithium dendrite growth, SEI formation and growth, dendrite penetration through the SEI layer, and SEI regrowth on the exposed surface. Our model includes the electrochemical process of dendrite growth, the process of SEI growth on a moving dendrite surface, and coupling of the two processes by considering SEI stretching associated with the dendrite growth beneath it and the effect of SEI resistance on reaction current for dendrite growth. With this model we have evaluated the effect of various parameters, such as applied current, SEI resistivity, and initial SEI distribution on dendrite formation. The results have provided important insights on how to reduce dendrite formation, which can guide the design of lithium metal batteries.
Model Development
Fig. 1 shows a parallel electrode cell. The negative electrode at the bottom is a lithium metal (we will refer it as 'substrate') with a moving boundary governed by the lithium deposition rate. The substrate surface is described by the curve z = z(x, t), where x, z are coordinates and t is time. For a two dimensional surface the form is given by z = z(x, y, t), where y is another coordinate. A SEI layer on the substrate surface separates it from the electrolyte. The electrolyte is assumed to be EC (ethylene carbonate)-based with LiPF6 as salt. The counter electrode only serves as the source of lithium ions during the charging process.
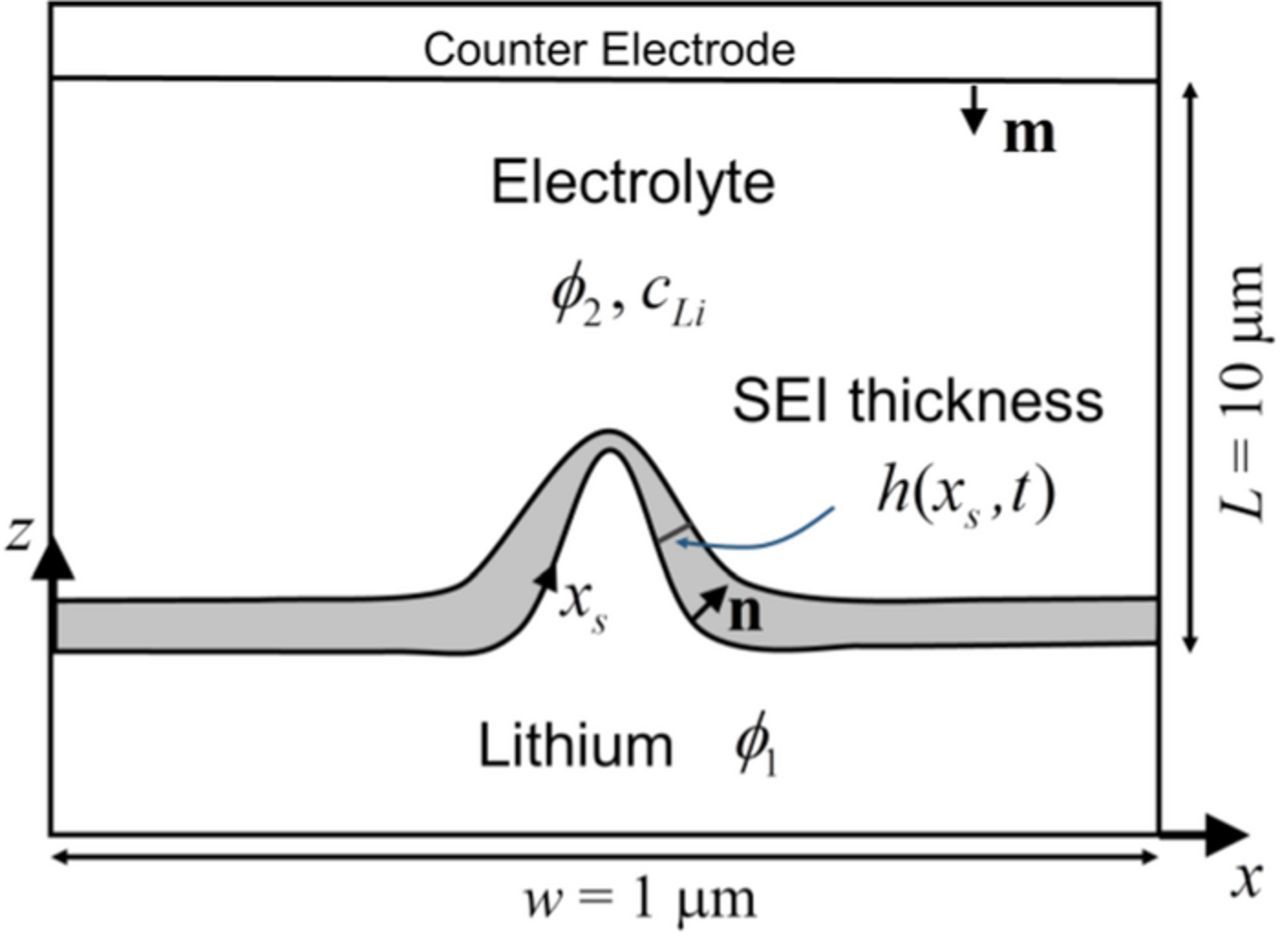
Figure 1. Schematic of the model. The negative electrode at the bottom is a lithium metal substrate with a moving boundary governed by the lithium deposition rate. The substrate surface is described by the curve z = z(x, t). The SEI layer on the substrate surface has an evolving thickness (coverage density) of h(xs, t).
SEI growth on an evolving surface
We first introduce the concept of SEI coverage density, h(xs, ys), which is a spatial dependent variable on the metal substrate surface and is defined as the volume of SEI on a unit area of the substrate surface. Here xs, ys are the surface coordinates (Fig. 1 shows xs). h(xs, ys) can be understood as the SEI thickness at location xs, ys, but the definition of SEI coverage density is more general. For instance, the definition is applicable even for a submonolayer of SEI molecules, where the usual concept of thickness becomes unclear. The definition is applicable no matter what is the SEI material, whether it is elastic, ductile or brittle. While here we define the coverage density based on volume, it can also be defined by mass or moles per unit area. The essence is that we can relate SEI properties, such as resistance, to the SEI coverage density. Local SEI growth will increase the SEI coverage density, while stretching of the substrate surface will decrease it since the SEI volume will be distributed on a larger surface area. Here the stretching of substrate surface comes purely from the geometric effect associated with the substrate growth morphology. The SEI, by itself, is a highly complex and porous structure containing multiple phases. In this paper we use 'SEI stretching' to refer to the decrease of SEI coverage density associated with the increase of the substrate surface area. Note that a SEI layer does not need to physically get stretched simply like a rubber, along with a decrease in its thickness, though this can be viewed as a simplified analogy. Here the concept of 'SEI stretching' is much broader. The physical significance of 'SEI stretching' can be understood in terms of the SEI resistance. Imagine that a SEI layer with a porous structure is stretched to cover a larger substrate surface. The porosity of the SEI layer will increase since now the SEI needs to distribute on a larger substrate surface area. Physically this increase of porosity for ion transport as a result of reduced SEI coverage density leads to a decrease of the SEI resistance. Mathematically, the SEI coverage density at a spatial point on the substrate surface can be viewed as the SEI thickness at that point. Then the overall physical picture is that 'SEI stretching' causes a decrease of the SEI coverage density (or equivalently SEI thickness), while this decrease of the SEI coverage density increases the SEI porosity proportionally and reduces the SEI resistance. In this paper we use the terms of SEI coverage density and SEI thickness interchangeably, and a relation between SEI resistance and SEI thickness will be formulated. Later we will simply refer SEI coverage density by SEI thickness since it is more visually intuitive.
Next we consider the mass conservation. To explain the idea, we look at a two dimensional problem so that the substrate surface is a one dimensional curve. The SEI layer on the substrate surface is described by its thickness h(xs) or h(x). Consider a small SEI line element and denote its length at time t by l. After a time interval dt, the length of the element becomes l + dl, while its thickness becomes h + dh. Denote the SEI growth rate from electrochemical reaction by qSEI, which is defined as the increase of SEI thickness per unit time due to reaction. The mass conservation gives
![Equation ([1])](https://content.cld.iop.org/journals/1945-7111/164/9/A1826/revision1/d0001.gif)
We define the strain rate of the substrate surface by  . With
  , We can rewrite Eq. 1 into a growth equation
![Equation ([2])](https://content.cld.iop.org/journals/1945-7111/164/9/A1826/revision1/d0002.gif)
This equation shows that the overall SEI growth rate is the growth rate from electrochemical reaction minus the rate of coverage density reduction due to stretching of the substrate surface area.
The strain rate  results from the geometric effect of evolution of the substrate surface morphology. It is related to the normal velocity of the substrate surface, vn, and the surface curvature, κ, by
  . Here convex surfaces are defined to have positive curvatures. Then Eq. 2 becomes
![Equation ([3])](https://content.cld.iop.org/journals/1945-7111/164/9/A1826/revision1/d0003.gif)
It can be shown that Eq. 3 is also applicable to a two dimensional surface, where κ is the sum of the principal curvatures, or κ = 2κm with κm being the mean curvature. For a one dimensional surface, the curvature is given by
![Equation ([4])](https://content.cld.iop.org/journals/1945-7111/164/9/A1826/revision1/d0004.gif)
With EC as the electrolyte solvent, the component of SEI is considered to be made of (CH2OCO2Li)2, and the SEI formation reaction occurs at the interface between lithium and electrolyte.18 The growth rate of SEI from electrochemical reaction is governed by
![Equation ([5])](https://content.cld.iop.org/journals/1945-7111/164/9/A1826/revision1/d0005.gif)
where ΩSEI is the molecular volume of SEI, F is Faraday constant, and the SEI formation current density iSEI is determined by the following Tafel-type kinetics19
![Equation ([6])](https://content.cld.iop.org/journals/1945-7111/164/9/A1826/revision1/d0006.gif)
Here λ is a scale factor of SEI formation current with respect to the SEI thickness, kSEI is the SEI reaction rate coefficient, cEC is solvent concentration, αSEI is the charge transfer coefficient of SEI formation reaction, ϕ1 is the lithium substrate potential, ϕ2 is the electrolyte potential, it is the total lithium current density whose expression will be given later, R is gas constant, and T is temperature. The SEI resistance, RSEI, is assumed proportional to the SEI thickness by
![Equation ([7])](https://content.cld.iop.org/journals/1945-7111/164/9/A1826/revision1/d0007.gif)
where rres is the resistivity of SEI.
The growth of SEI is obtained by solving Eqs. 3–7. Note that the growth of SEI is coupled with dendrite growth by the lithium surface morphology z(x, t), curvature κ, normal velocity of the substrate surface vn, SEI resistance RSEI, total lithium current it, and the electrolyte potential which depends on the surface morphology of the substrate.
Dendrite growth
To model dendrite formation and growth, we need to solve the concentration and potential fields in the electrolyte domain, and calculate the normal velocity of the lithium interface. The mass conservation is governed by the Nernst-Plank equation and electroneutrality, namely
![Equation ([8])](https://content.cld.iop.org/journals/1945-7111/164/9/A1826/revision1/d0008.gif)
![Equation ([9])](https://content.cld.iop.org/journals/1945-7111/164/9/A1826/revision1/d0009.gif)
![Equation ([10])](https://content.cld.iop.org/journals/1945-7111/164/9/A1826/revision1/d0010.gif)
where subscript i represents the species, which can be 'Li' (lithium ion) or '-' (salt anion PF6−). For each species, ci is the concentration, Ni is the flux of species, Di is the diffusion coefficient, and zi is the charge number. The electroneutrality gives c− = cLi.
The current density,  , is governed by
![Equation ([11])](https://content.cld.iop.org/journals/1945-7111/164/9/A1826/revision1/d0011.gif)
The boundary conditions on the lithium substrate surface are
![Equation ([12])](https://content.cld.iop.org/journals/1945-7111/164/9/A1826/revision1/d0012.gif)
![Equation ([13])](https://content.cld.iop.org/journals/1945-7111/164/9/A1826/revision1/d0013.gif)
where n is the normal direction of the substrate surface. We set ϕ1 = 0.
The total lithium current density is given by
![Equation ([14])](https://content.cld.iop.org/journals/1945-7111/164/9/A1826/revision1/d0014.gif)
where the reaction current density, iLi, is described by the Butler–Volmer equation,
![Equation ([15])](https://content.cld.iop.org/journals/1945-7111/164/9/A1826/revision1/d0015.gif)
Here i0 is the exchange current density given by i0 = FK(cLi)1 − α, where K is the lithium deposition rate coefficient and α is the charge transfer coefficient for lithium deposition. A negative iLi corresponds to lithium deposition. The over-potential, η, is given by
![Equation ([16])](https://content.cld.iop.org/journals/1945-7111/164/9/A1826/revision1/d0016.gif)
where Ueq is the equilibrium over-potential. Note that with consideration of stress on the substrate surface, the over-potential used in Eq. 15 can be replaced by a generalized form ηtotal = η − ΩLiσ/F, where ΩLi is the molecular volume of lithium atom and σ is the hydrostatic stress. Using the typical parameters in Table I, i0 is about 18.6 A/m2. With even a low current density of |iLi| = 10 A/m2, we will have |ηtotal| = 13.4 mV according to Eq. 15. A higher current leads to a larger |ηtotal|. It should be noted that the surface energy of the lithium metal can have a significant effect on preventing fine dendrites. The surface energy of lithium metal depends on the choice of electrolyte and the engineering of electrode surface. With liquid electrolytes, a representative surface energy density for lithium metal, γ, is about 0.5 J/m2. The pressure on lithium surface exerted by surface tension is γκ, and the corresponding hydrostatic stress has similar or smaller magnitude. When the radius of curvature is as small as 5 nm, the effect of surface tension on potential is about ΩLiγκ/F = 13.5 mV, which becomes comparable to the magnitude of ηtotal. To highlight the new physics, in this work we simulate dendrites whose size is much larger and neglect the effect of surface energy to avoid unnecessary complexity.
Table I. Simulation parameters.
| Parameter | Value | Unit | Source |
|---|---|---|---|
| Faraday constant F | 96485.3 | C/mol | |
| Gas constant R | 8.31 | J/(mol · K) | |
| Temperature T | 293.15 | K | |
| Initial electrolyte concentration cLi, 0 | 1000 | mol/m3 | |
| Li ion diffusion coefficient DLi | 7.5 × 10− 11 | m2/s | 19 |
| Salt anion PF−6 diffusion coefficient D− | 1.3 × 10− 10 | m2/s | 19, a |
| Lithium deposition rate coefficient K | 6.1 × 10− 6 | mol0.5/(m0.5 · s) | 20 |
| Charge transfer coefficient α | 0.5 | 20 | |
| Li atom molar volume ΩLi | 1.2998 × 10− 5 | m3/mol | 20 |
| SEI molecule molar volume ΩSEI | 9.586 × 10− 5 | m3/mol | 19, b |
| Charge transfer coefficient αSEI | 0.5 | 19 | |
| Solvent EC concentration cEC | 4541 | mol/m3 | 19 |
| SEI reaction scale factor λ | 1.2 × 10⁷ | 1/m | 19 |
| SEI reaction rate coefficient kSEI | 6 × 10− 10 | m/s | 19 |
| SEI resistivity rres | 2 × 10⁵ | Ω · m | 21 |
aCalculated from transference number and lithium ion diffusion coefficient. bCalculated from density and molar weight.
The boundary conditions at the counter electrode are
![Equation ([17])](https://content.cld.iop.org/journals/1945-7111/164/9/A1826/revision1/d0017.gif)
![Equation ([18])](https://content.cld.iop.org/journals/1945-7111/164/9/A1826/revision1/d0018.gif)
where m is the normal direction of the counter electrode surface and I is the current density applied to the counter electrode.
The normal velocity of the substrate surface is given by
![Equation ([19])](https://content.cld.iop.org/journals/1945-7111/164/9/A1826/revision1/d0019.gif)
The cell was charged under the galvanostatic condition with a constant current density I applied to the counter electrode. COMSOL Multiphysics was used to implement the model into finite element to simulate the evolution using the moving mesh module. Below is a brief description of the implementation. The concentration and potential profiles are simulated by the tertiary current distribution module which solves mass conservation and current density conservation based on the Nernst-Planck equation and the Poisson equation. On the lithium metal surface, the lithium deposition current is determined by the Butler-Volmer equation, which is further used to calculate the normal velocity of the surface. The surface morphology is updated by the moving mesh module based on the normal velocity, with re-meshing invoked when necessary. The SEI formation current density, which is determined by the Tafel-type kinetics, is passed to the boundary ODE module to simulate the evolution of SEI thickness. We update the boundary of the counter electrode based on the moving mesh module with a velocity of vm = −ΩLiI/F in the normal m direction. Table I lists the values of parameters used in simulations based on literature values.19–21
Results and Discussion
In the simulation we set the distance between the two electrodes to be 10 μm and the width of the simulation domain to be 1 μm. We start with a case where a protrusion having a Gaussian height profile exists at the lithium metal surface. The height of the protrusion is 200 nm. The initial SEI thickness is uniform with a value of 10 nm. The simulation is run with a low current density of I = 10 A/m2.
Fig. 2a shows snapshots of the lithium surface morphology and SEI coverage density as a function of evolution time. The results show that dendrite growth has two distinct stages. In the first 10 seconds, the SEI around the dendrite tip is stretched thinner, while the shape of dendrite does not change much. In the next 40 seconds, the dendrite grows longer, driven by the higher lithium deposition rate at the tip area.
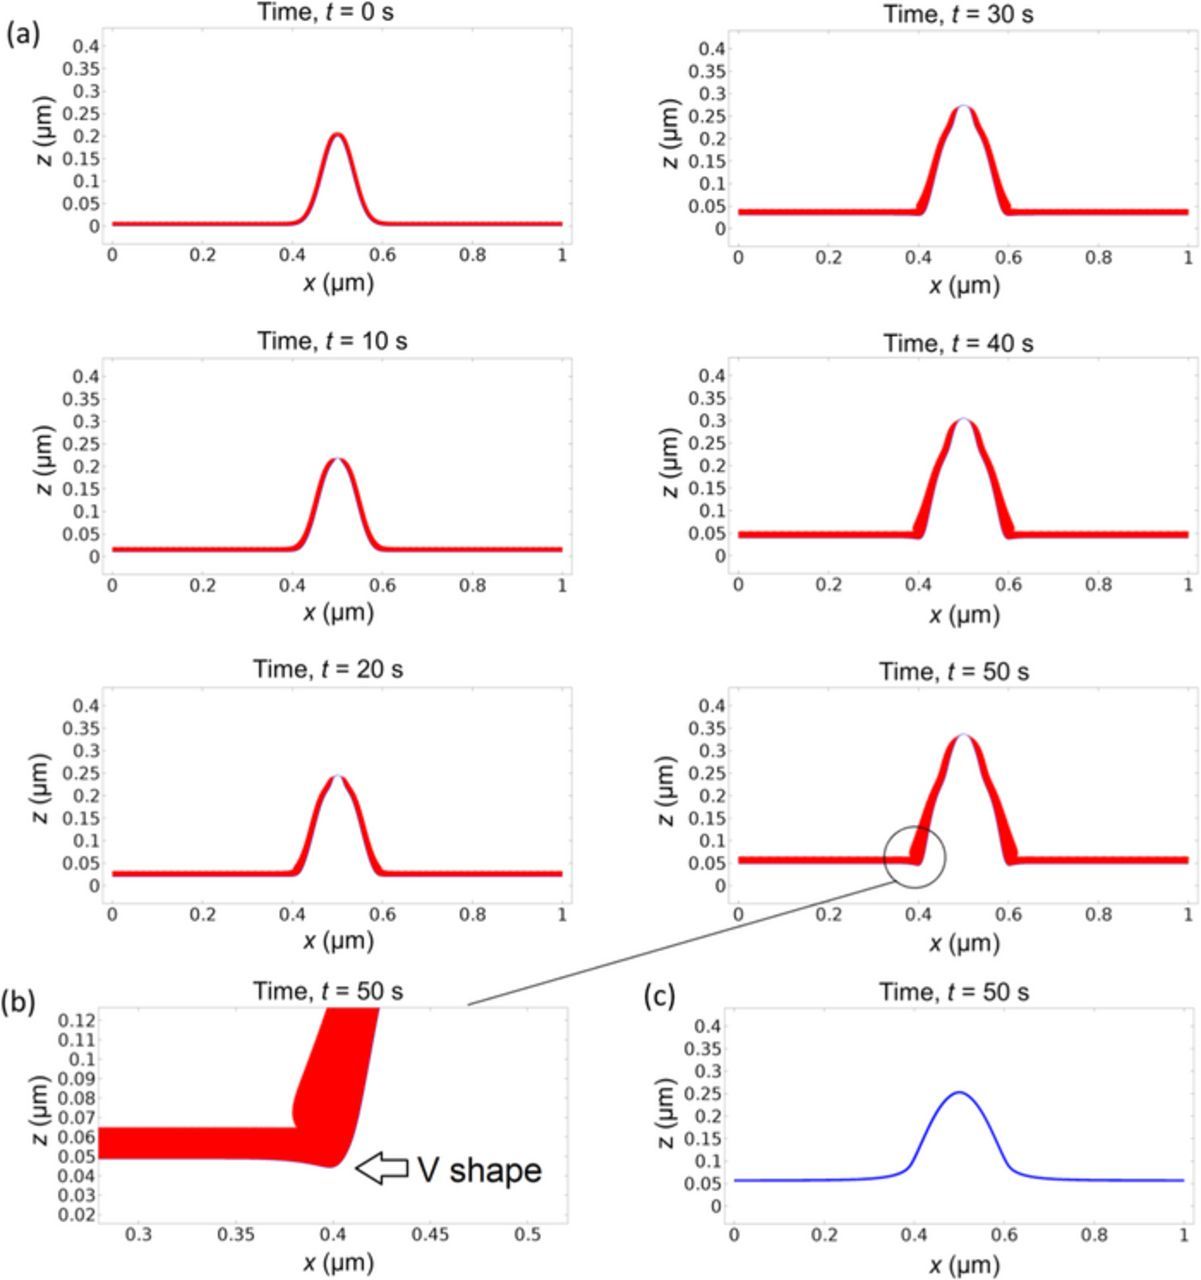
Figure 2. (a) Concurrent evolution of lithium surface morphology (blue line) and SEI layer thickness (red layer) starting with an initial surface protrusion and uniform initial SEI thickness. The applied current density is 10 A/m2. (b) Zoom-in of the left bottom corner of the dendrite at t = 50 s. The dendrite appears to slightly pinch into the substrate surface with a V-shape due to the thick SEI and therefore slow growth at the corner. (c) Morphology at t = 50 s without integrating SEI in the simulation. The shape is rounder and shorter without any V-shape at the bottom corner.
Notice that the curvature at the bottom area of a dendrite where it curves to the flat surface is negative or concave. The SEI coverage density or thickness in this area will increase due to negative stretching or compression, in addition to the growth from electrochemical reaction. The larger SEI thickness at the bottom corners of the dendrite causes lithium to grow slower than the flat area, so that the bottom of dendrite appears to slightly pinch into the substrate surface with a V-shape, as shown in Fig. 2b. This makes it easier for the dendrite to break away from the substrate.
To highlight the importance of integrating SEI in modeling dendrite growth, we run a simulation with the same parameters but without SEI, as shown in Fig. 2c. Comparing it with Fig. 2a, we can clearly see the difference in morphology and height, which are rounder and shorter without any V-shape at the bottom corner. We can observe that when there is no SEI, this protrusion will not grow into dendrite.
The two dendrite growth stages are further confirmed by the height and growth rate profile in Fig. 3. Fig. 3b shows that the dendrite growth rate accelerates quickly at the beginning. After about 10 s, the acceleration slows down considerably, which is reflected by the sharp change of slope at about 10 s. This transition can be explained by comparing the SEI thickness in the flat area and in the tip area, as shown in Fig. 3c. In the first stage of growth, the SEI thickness in the tip area decreases quickly. When the SEI thickness around the dendrite tip is low enough, the growth of SEI balances the decrease of SEI caused by stretching. Then the SEI thickness reaches local equilibrium, as shown by the horizontal line after 10 s. This is the second stage of growth. In contrast, the SEI thickness in the flat area keeps increasing. According to Eq. 3, both surface normal velocity and surface curvature affect SEI growth. As shown in Fig. 4, the initial normal velocity of the lithium surface is almost uniform. So the large curvature at the dendrite tip area is the main reason that causes the SEI thickness to decrease very quickly at the beginning. As the difference in SEI thickness between the tip area and the flat area becomes larger, the difference in surface normal velocity between the two areas also becomes larger. These two effects together lead to the large acceleration of dendrite growth rate in the first stage. After the SEI thickness at the tip reaches equilibrium, the dendrite growth rate can still increase slowly because the SEI keeps growing in other areas. This results in increasing difference in SEI resistance and lithium surface velocity between the tip area and the flat area, causing the tip area to appear accelerating due to slowing down of growth in the flat area.
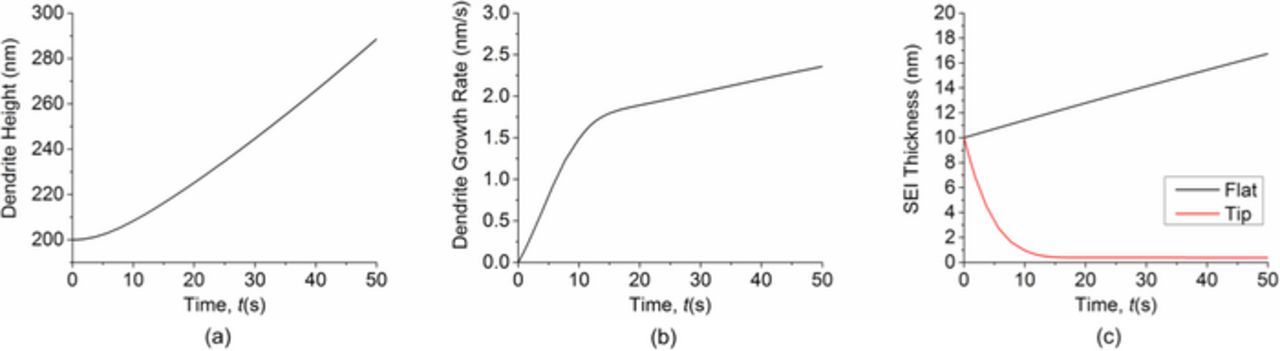
Figure 3. (a) Dendrite height as a function of time. (b) Dendrite growth rate as a function of time. (c) Comparison of SEI thickness in the flat area and in the dendrite tip area as a function of time. Simulation starts with an initial surface protrusion and uniform initial SEI thickness.
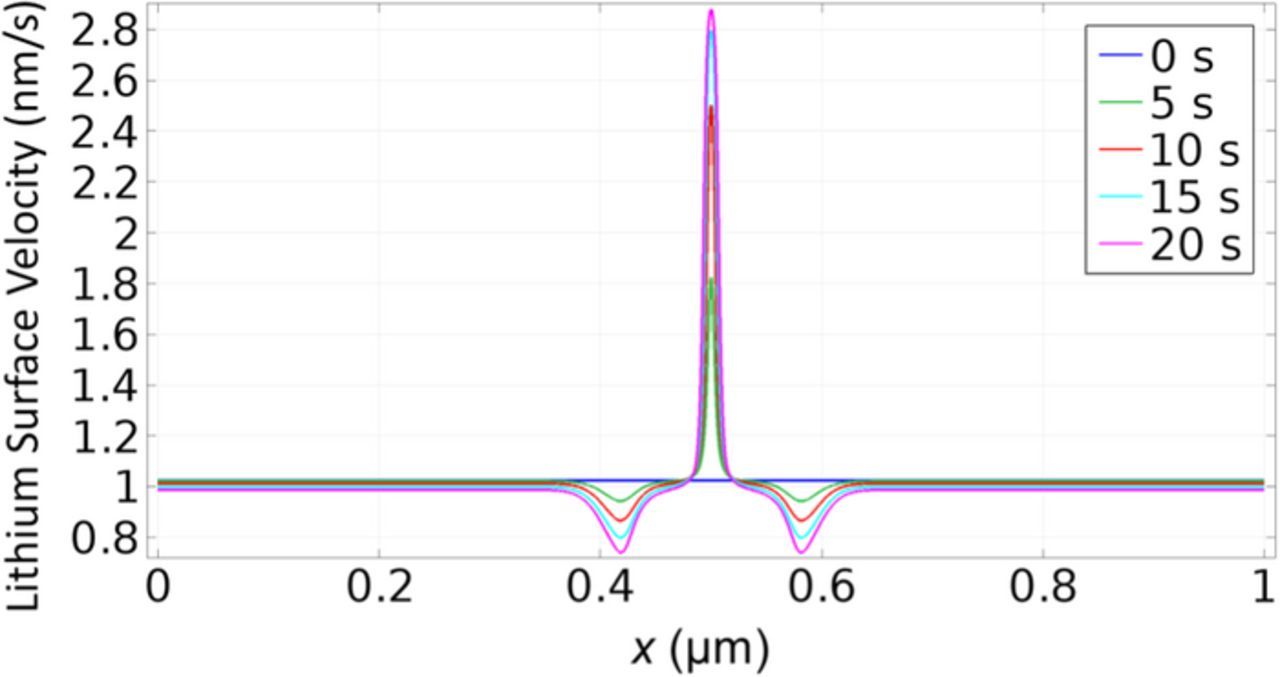
Figure 4. Normal velocity of the lithium surface. At t = 0, the initial normal velocity of the lithium surface is almost uniform. As the difference in SEI thickness between the tip area and the flat area becomes larger, the difference in surface normal velocity between the two areas also becomes larger.
Integrating the SEI thickness over the lithium surface, we can obtain the total amount of SEI formed during the simulation period. Fig. 5 shows the comparison of normalized total SEI between the case with an initial surface protrusion and the case of a perfectly flat surface. The normalized total SEI is given by the ratio of the SEI volume at time t to the initial SEI volume. We find that SEI penetration and reformation lead to about 40% more electrolyte consumption. Hence dendrite growth coupled with SEI penetration and formation causes reduced Coulombic efficiency.
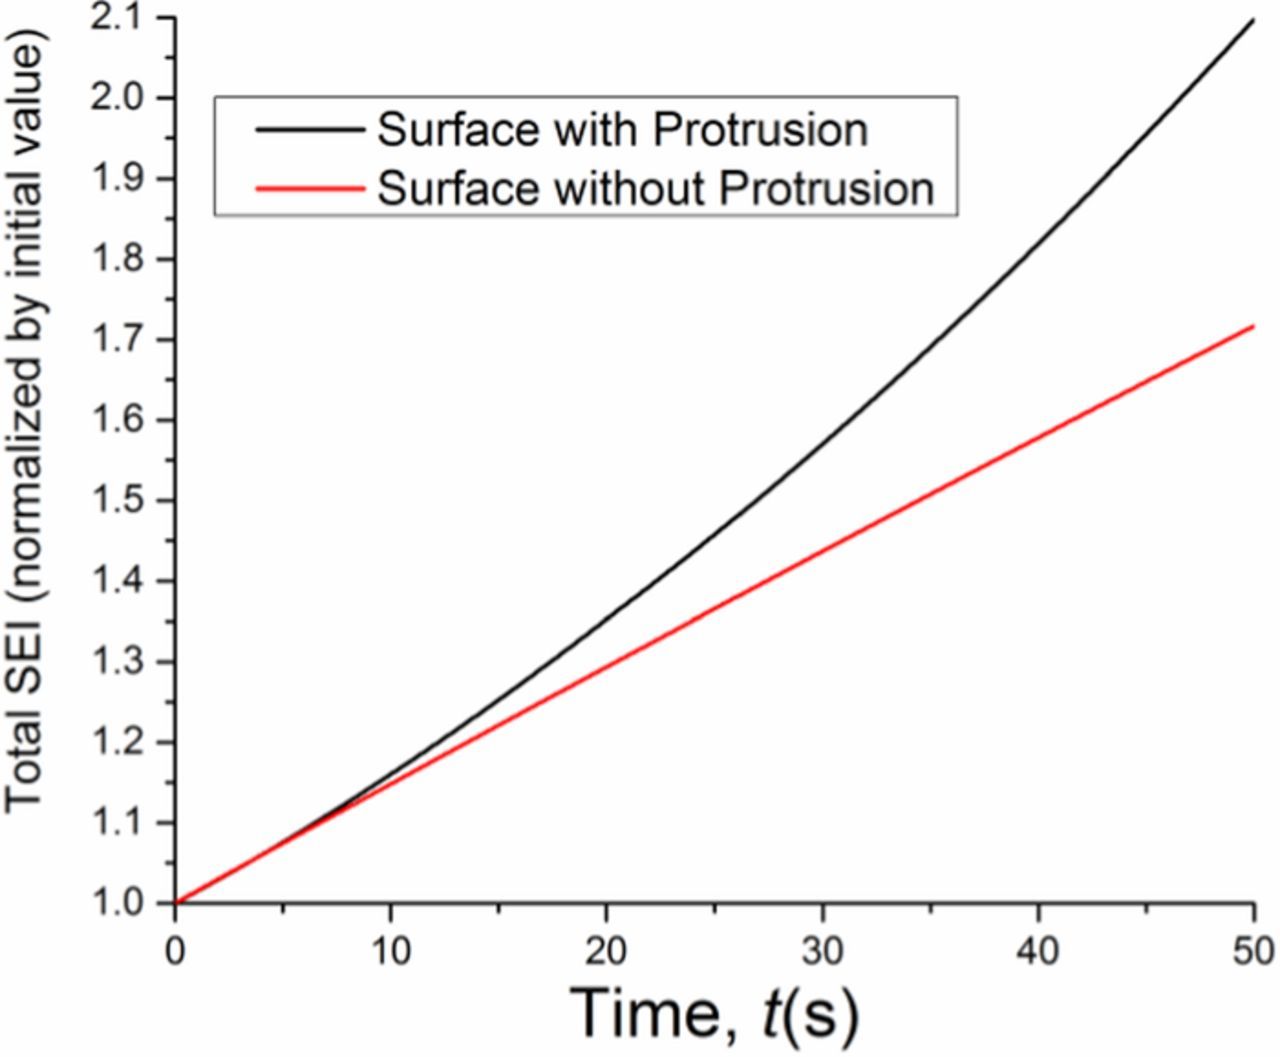
Figure 5. Comparison of normalized total SEI between the case with an initial surface protrusion and the case of a perfectly flat surface. The normalized total SEI is given by the ratio of the SEI volume at time t to the initial SEI volume.
Overall, our simulations show that even with low applied current density, a protrusion can grow into dendrite by penetration of the SEI layer and by the resulting difference in SEI resistance between the tip and flat areas. This explains the experimental observations of dendrite formation and growth even under low current density.14,15
We have applied our coupled model to investigate the impact of several parameters on dendrite growth. We start by investigating the effect of applied current density. Under low current density, the magnitude of applied current has little effect on dendrite shape, as shown in Fig. 6. Instead, increasing the applied current mainly scales up the dendrite growth rate, as shown in Fig. 7. We can observe that increasing current density causes the SEI to grow faster in the flat area, while at the same time causes the SEI thickness at the tip area to decrease faster. The equilibrium SEI coverage density or thickness at the tip is smaller with larger applied current density.
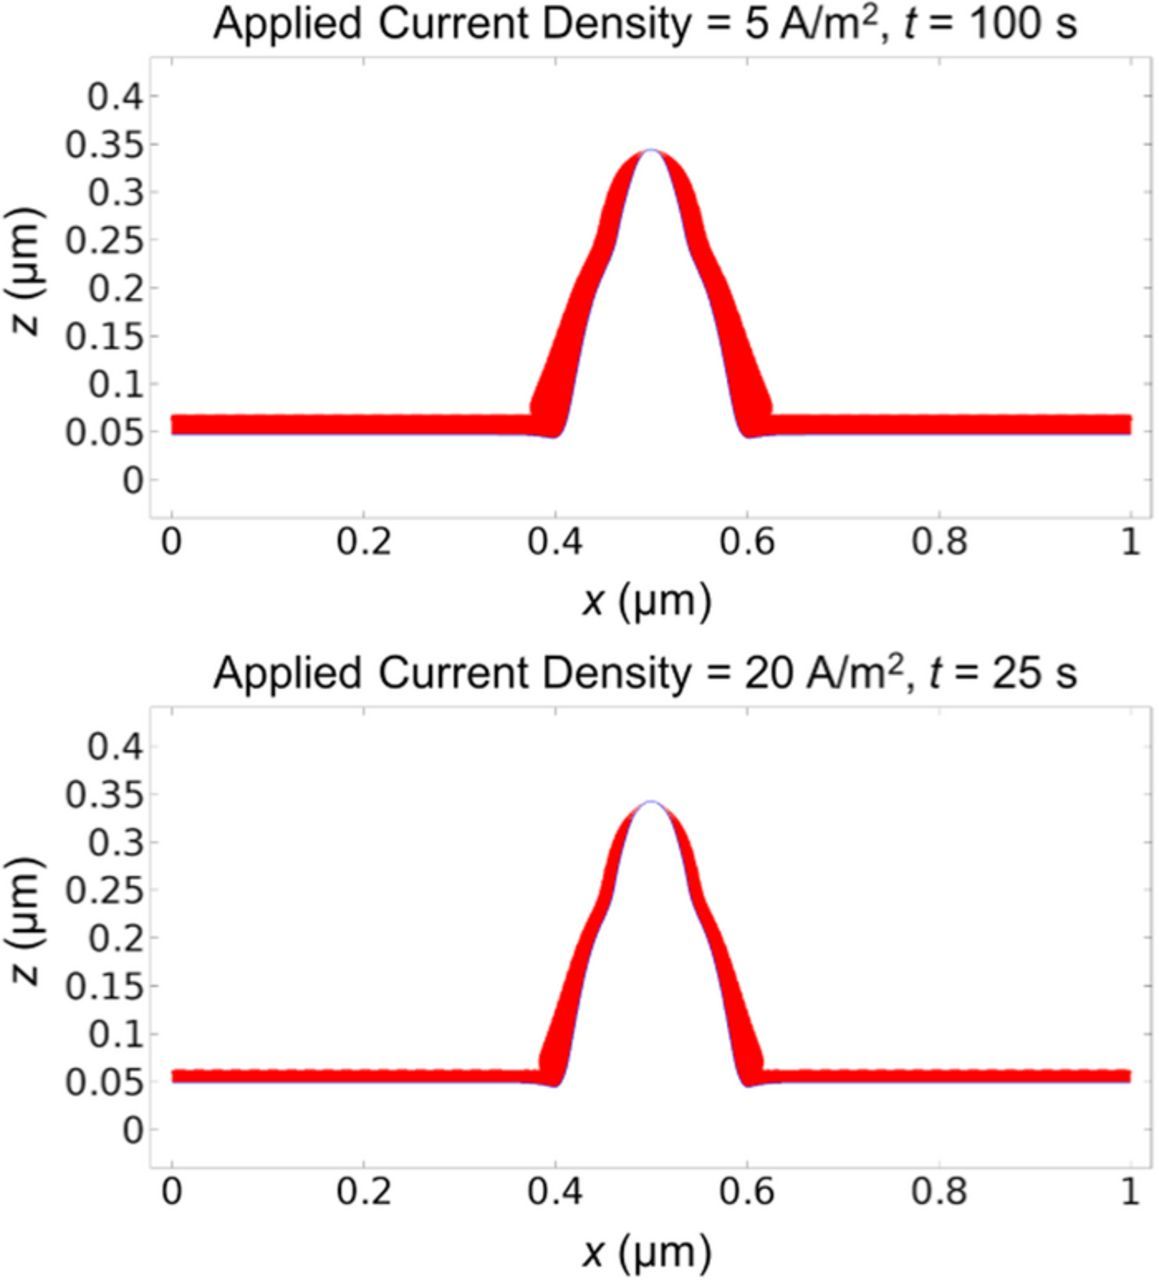
Figure 6. Lithium surface (blue line) and SEI thickness (red layer) under low current densities of 5 A/m2 at t = 100 s (upper plot) and 20 A/m2 at t = 25 s (lower plot). Comparing them with the snapshot at t = 50 s in Fig. 2a which is under the current density of 10 A/m2 shows that the dendrite shape is similar.
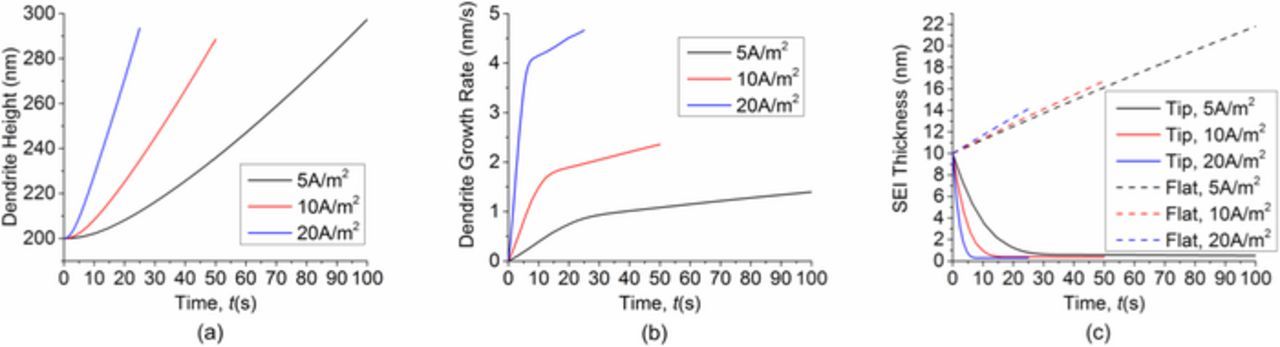
Figure 7. Effect of applied current density on dendrite and SEI growth under low current density conditions. (a) Dendrite height. (b) Dendrite growth rate. (c) SEI thickness in the flat area and in the dendrite tip area.
However, if we apply high current density, the protrusion will grow very quickly into a sharp needle shape, as shown in Fig. 8. Comparing the morphology at 0.1 s with current density of 1000 A/m2 in Fig. 8 and the morphology at 10 s with current density of 10 A/m2 in Fig. 2, we can observe the dramatic difference in dendrite shape, though the total amount of deposited lithium is the same. This is because with higher current density, the potential drop across the SEI layer due to its resistance is larger. In addition, the Butler-Volmer equation operates in the non-linear regime under high current density, so that even a small potential drop across the SEI layer can cause a significant effect. Therefore, SEI inhomogeneity plays a critical role. The small SEI resistance at the tip area promotes local dendrite growth strongly, leading to a sharp needle shape.
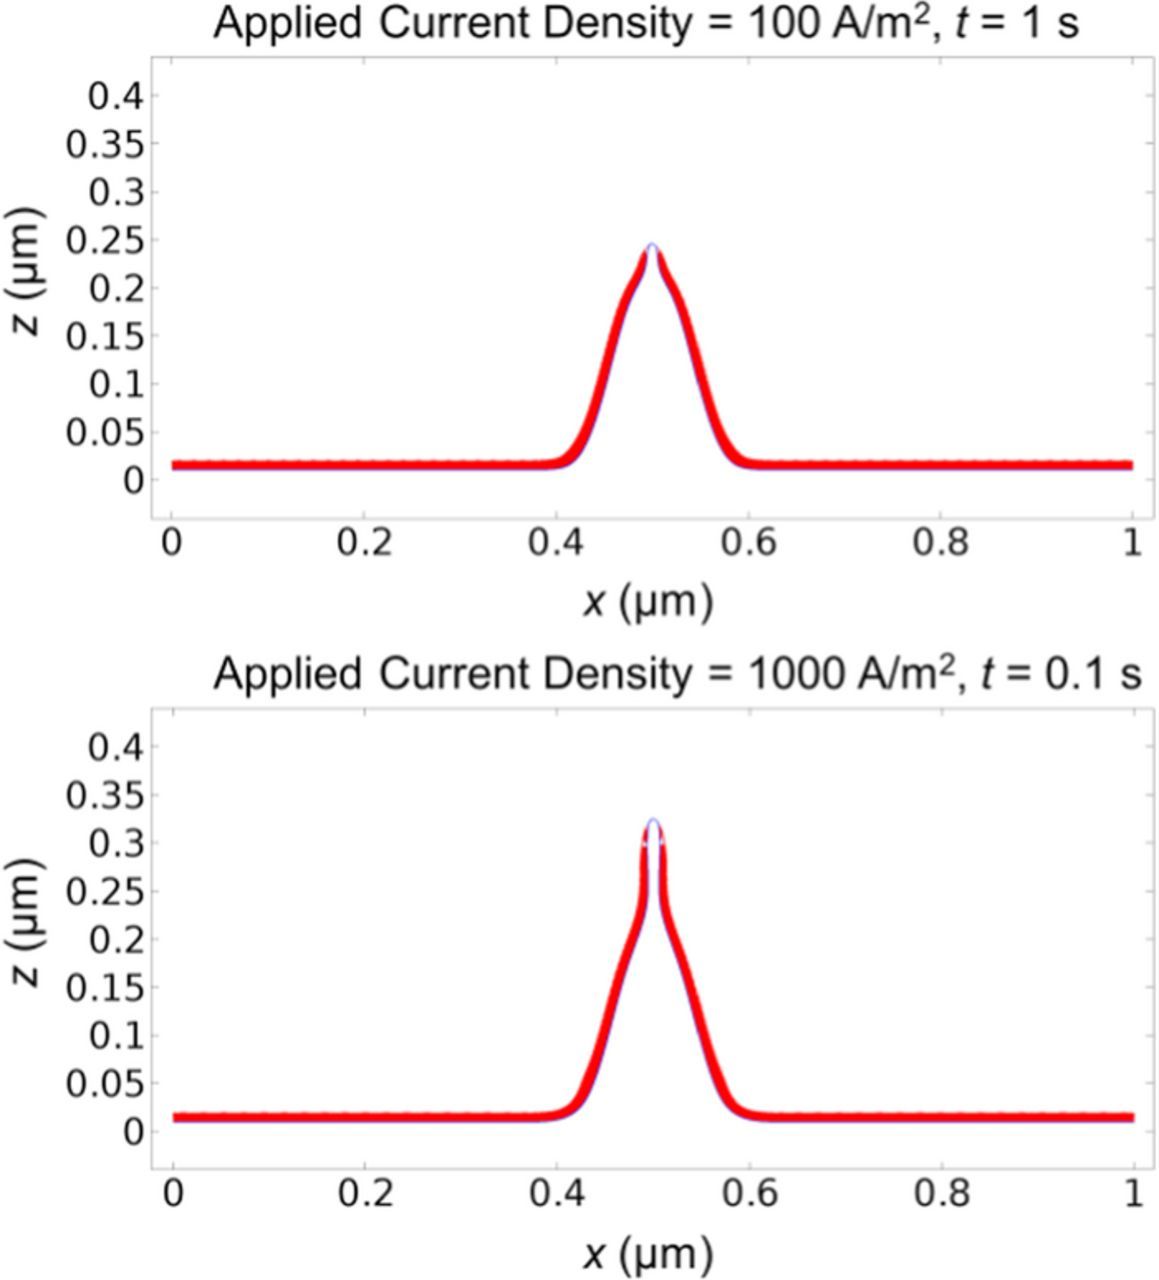
Figure 8. Lithium surface (blue line) and SEI thickness (red layer) under high current densities of 100 A/m2 at t = 1 s (upper plot) and 1000 A/m2 at t = 0.1 s (lower plot). Dendrite shape under high current density is much sharper.
To summarize, the impact of current density depends on its magnitude. Under low current density, increasing current density will scale up the dendrite growth rate without changing the dendrite shape much. Under high current density, the effect of SEI resistance becomes critical. Increasing current density will not only speed up the dendrite growth, but also result in sharp needle-shaped dendrites, which are dangerous to battery safety.
Next we examine the effect of SEI resistivity. We only change the SEI resistivity, and keep other parameters and the applied current density of 10 A/m2 the same. The SEI resistivity in Fig. 2 or Table I is taken as the reference and noted as rres1. The results in Fig. 9 show that SEI resistivity has a significant impact on dendrite shape. The dendrite grows faster and sharper after we double the SEI resistivity (rres = 2rres1), as can be observed by comparing Fig. 9 with Fig. 2. After we reduce the SEI resistivity to rres = 0.1rres1, the dendrite becomes rounder and less dangerous. Dendrite growth rate also increases with the SEI resistivity, as shown in Fig. 10. Increasing the SEI resistivity causes the SEI in the flat area to only grow slightly slower, but causes the SEI thickness at the dendrite tip area to decrease significantly faster.
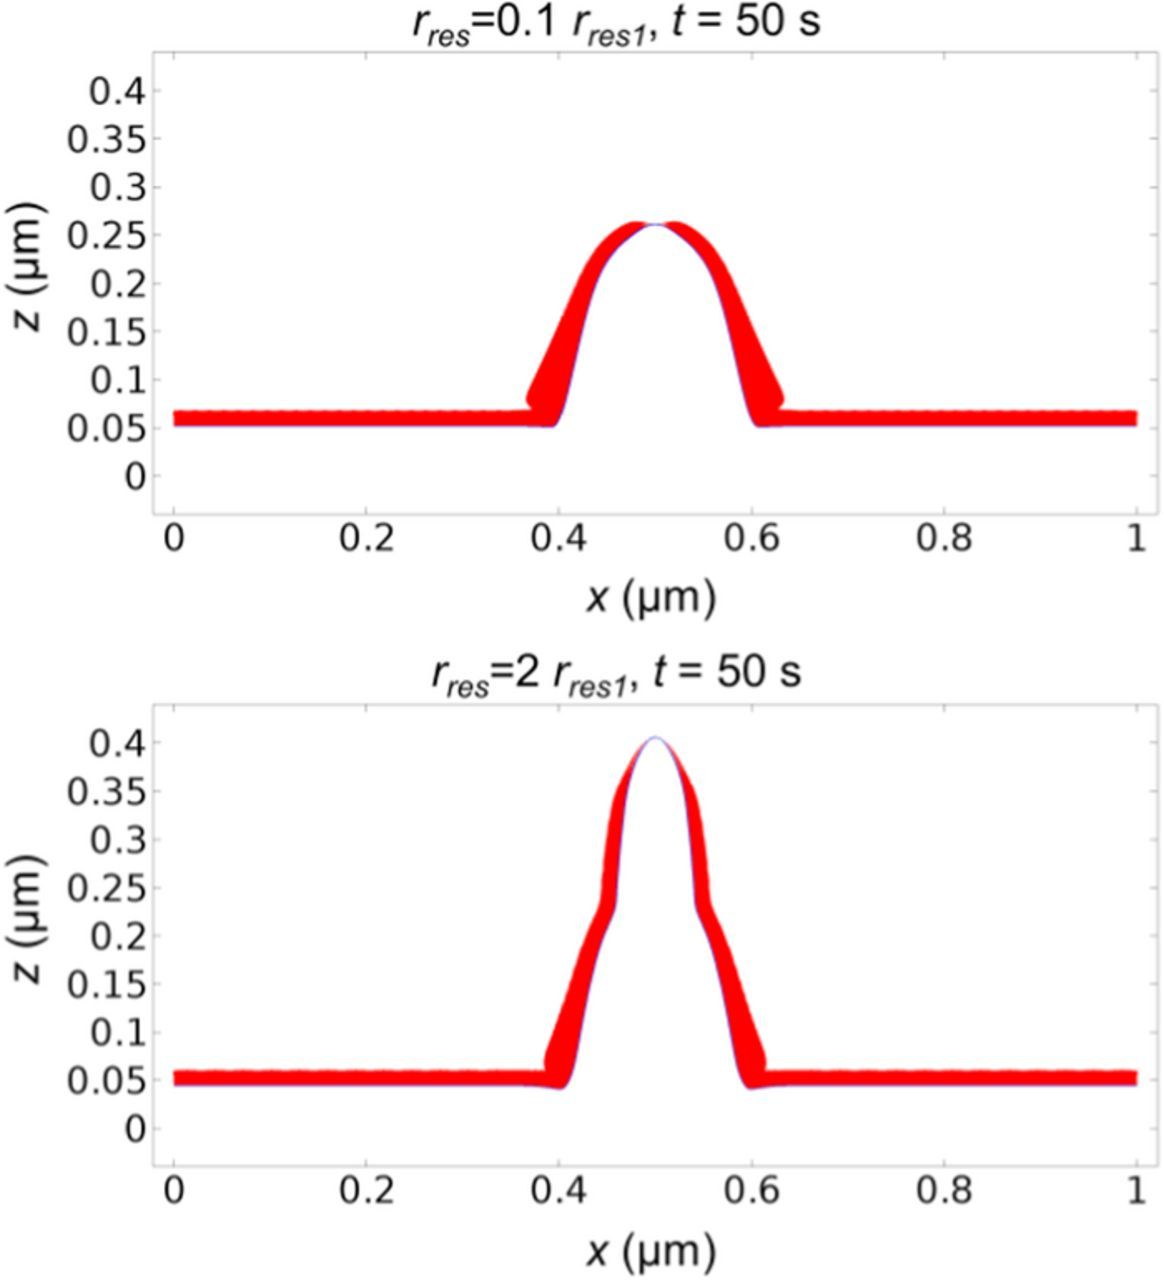
Figure 9. Lithium surface (blue line) and SEI thickness (red layer) with different SEI resistivity. The SEI resistivity in Fig. 2 or Table I is taken as the reference and noted as rres1. With low SEI resistivity (rres = 0.1rres1), the dendrite shape is rounder and less dangerous (upper plot). With high SEI resistivity (rres = 2rres1), the dendrite shape is sharper (lower plot).
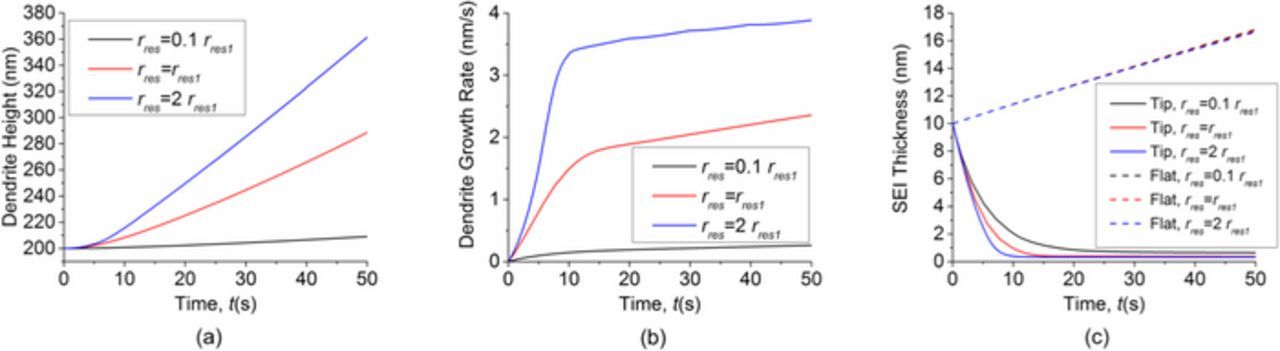
Figure 10. Effect of SEI resistivity on dendrite and SEI growth. (a) Dendrite height. (b) Dendrite growth rate. (c) SEI thickness in the flat area and in the dendrite tip area. Increasing the SEI resistivity causes the SEI in the flat area to grow only slightly slower, but causes the SEI thickness at the dendrite tip area to decrease significantly faster.
The predicted impact of SEI resistivity is consistent with experimental ovservations.22 High SEI resistance will not only cause the dendrite grow faster, but also lead to sharper dendrites. Furthermore, an increase of the total resistance of the SEI layer can eventually cause impedance failure of the battery if not designed properly. Hence low SEI resistance is an important consideration in electrolyte design.
In addition to considering dendrite growth from existing protrusions on the lithium surface, we also performed simulations to investigate the impact of local SEI defects or inhomogeneity on dendrite formation. We run a simulation with an initially flat lithium surface and a local SEI defect in the center, i.e. an area without SEI coverage. The applied current density is still set at 10 A/m2 and all parameters are kept the same as previous simulations. Fig. 11 shows the morphology evolution as a function of time. As the SEI coverage density is low in the defect area, the lithium deposition rate is locally high, resulting in the formation of a dendrite. Once again we can notice that the bottom of the dendrite appears pinching into the surface, as a result of the thick SEI at the corners due to the negative curvature. Fig. 12 gives the evolution of dendrite height, dendrite growth rate and SEI thickness. Fig. 12b shows that the dendrite growth rate first decreases a little and then increases gradually. This is because the SEI thickness in the defect is initially zero, so the SEI is firstly repaired to the equilibrium value. The process consumes lithium flux and reduces the lithium deposition rate for a short period of time. Our simulation shows that local SEI defects or inhomogeneity can induce dendrite formation.
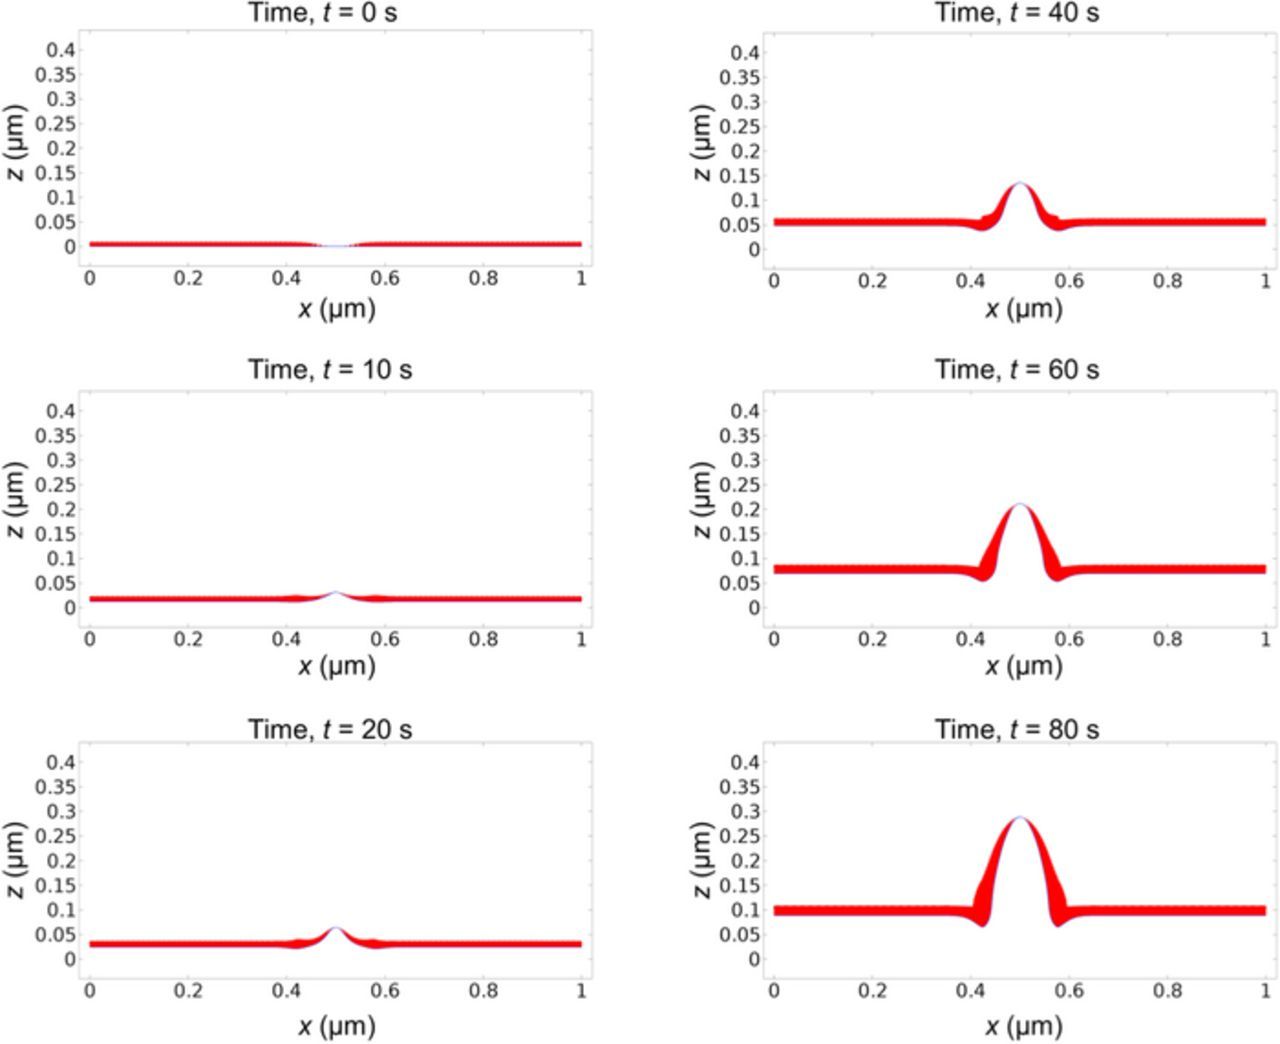
Figure 11. Concurrent evolution of lithium surface morphology (blue line) and SEI layer thickness (red layer) starting with a flat lithium surface and a local SEI defect in the center. The applied current density is 10 A/m2.
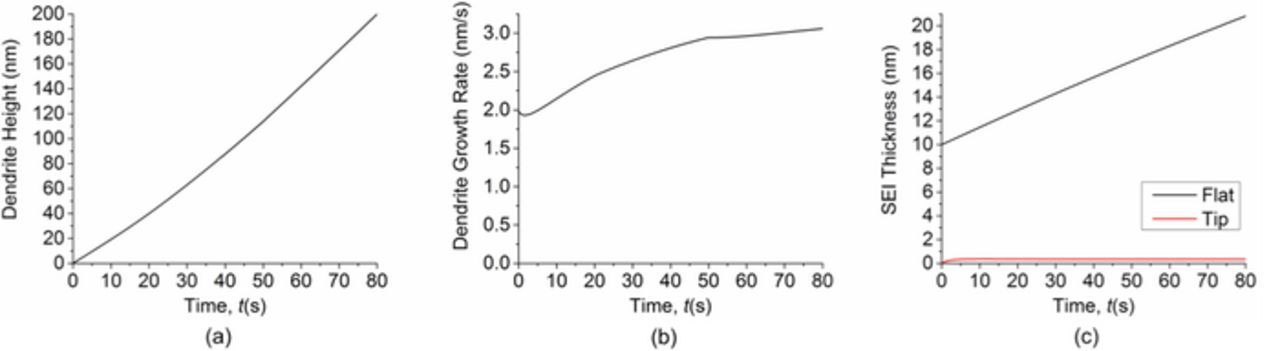
Figure 12. (a) Dendrite height as a function of time. (b) Dendrite growth rate as a function of time. (c) Comparison of SEI thickness in the flat area and in the dendrite tip area as a function of time. Simulation starts with a flat lithium surface and a local SEI defect in the center.
Conclusions
In this paper we have developed a coupled dendrite and SEI growth model. Dendrite growth stretches the SEI and changes the curvature of the SEI layer, affecting the SEI evolution. SEI growth changes the resistance and reaction current, affecting the dendrite growth. The model has been used to investigate the impact of applied current density, SEI resistivity and SEI defects/inhomogeneity on dendrite formation and growth.
With a uniform initial SEI thickness, existing protrusions on the lithium surface can grow into dendrites. The growth shows two stages: quick acceleration during the SEI penetration process, and stable growth after reaching an equilibrium SEI thickness at the dendrite tip. The penetration and re-formation of SEI caused by dendrite growth consumes more electrolyte, and therefore reduces the Coulombic efficiency. Under low current density, increasing the current density will speed up the dendrite growth without changing the dendrite shape much. Under high current density, increasing the current will not only speed up the dendrite growth but also result in sharper needle-like dendrites. SEI resistivity significantly affects the shape and the growth rate of dendrites. Dendrites will be rounder and less dangerous with low SEI resistivity. SEI defects/inhomogeneity can induce dendrite formation and growth even when the lithium surface is perfectly flat. Our results suggest that a flat initial lithium surface and a uniform SEI layer with low resistance are important to reduce dendrite formation and growth, and to avoid the decrease of Coulombic efficiency associated with SEI penetration and re-formation.
The model developed in this paper provides a framework that can be further expanded to investigate a broad range of phenomena related to the interaction and concurrent growth of SEI and dendrite. More physics, such as mechanical deformation and growth of dendrites when their growth is confined by another solid such as a separator or a film, heat generation and its effect on dendrite growth, or interaction between multiple dendrites, can be incorporated to study various processes. These studies will lead to more fundamental understanding of dendrite growth and better design of lithium metal batteries.
Acknowledgments
This work was supported by the National Science Foundation under grant No. CNS-1446117.