
Abstract
We have studied the factors affecting the performances of one-compartment hydrogen peroxide photofuel cell (H2O2-PFC) consisting of TiO2 photoanode, cathode, and an aqueous electrolyte solution. As the photoanode, a dense TiO2 film was formed on fluorine-doped tin oxide by a dip-coating method (d-TiO2/FTO) with the thickness controlled below ∼0.5 μm, and a mesoporous TiO2 nanocrystalline film with a thickness of 3.6 μm was coated on FTO (mp-TiO2/FTO) by a doctor blade method. The d-TiO2/FTO provides performances superior to mp-TiO2/FTO in spite that the decrease in the surface area. Building a compact TiO2 underlayer by a spray method (d-TiO2/s-TiO2/FTO) results in further improvement of the cell performances. On the other hand, the replacement of glassy carbon cathode by Prussian Blue-electrodeposited FTO drastically increases the cell performances due to its excellent electrocatalytic activity for the H2O2 reduction. A one-compartment H2O2-PFC with the structure of d-TiO2/s-TiO2/FTO (photoanode) | 0.1 M NaClO4 and 0.1 M H2O2 (pH 3, electrolyte solution) | PB/FTO (cathode) exhibits short-circuit current (Jsc) of 1.57 mA cm−2 and open-circuit voltage (Voc) of 787 mV.
Export citation and abstract BibTeX RIS
Hydrogen peroxide (H2O2) can be a promising fuel for fuel cell owing to its reduction and oxidation abilities.1 The H2O2-fuel cell possesses a thermodynamic electromotive force of 1.07 V (Eqs. 1 and 2) comparable with the value for the H2/O2-fuel cell (1.23 V). Recently, simple one-compartment H2O2-fuel cell has been devised,2 and further developed by several research groups.3,4 For the one-compartment H2O2-fuel cells, acid electrolyte is desirable because of the H2O2 stability. Also, the carbon-supported particulate electrocatalysts usually used as the anode in the H2O2-fuel cells undergo degradation under harsh oxidative conditions.5 On the other hand, photofuel cells (PFCs) using TiO2 as the photoanode have been devised.6–8. Photoelectrochemical devices for the solar-to-electricity and hydrogen conversion including PFC have recently been reviewed.9 However, the PFCs use biomass and bio-related compounds as the fuel, and the operation is accompanied by the emission of carbon dioxide. More recently, we have reported a stable one-compartment H2O2-PFC consisting of mesoporous TiO2 nanocrystalline film coated on fluorine-doped tin oxide electrode (mp-TiO2/FTO, photoanode), glassy carbon (GC, cathode), and an aqueous electrolyte solution containing 0.1 M NaClO4 and 0.1 M H2O2 (pH 3);10 however, the cell performances remain a low level.
![Equation ([1])](https://content.cld.iop.org/journals/1945-7111/165/5/F300/revision1/d0001.gif)
![Equation ([2])](https://content.cld.iop.org/journals/1945-7111/165/5/F300/revision1/d0002.gif)
Usually, since there is also a large overpotential for H2O2 reduction,11 much effort has been devoted to the development of the cathode materials including metal complexes12,13 and Co3O4.14 Prussian Blue (PB, FeIII4[FeII(CN)6]3) is known to have electrocatalytic activity for the reduction of O2 and H2O2.15 The PB-based electrodes have attracted much interest because of its applicability to the high-sensitivity sensors for H2O216 and glucose.17 The research group of Shaegh and Nguyen has recently reported a H2O2-FC using PB as the cathode material,4 and Gao and co-workers have used the copper analog as the cathode for aqueous Al-ion battery.18 While PB easily dissolves into alkaline solution, it is stable in acidic solution.
Here we show that the performances of one-compartment H2O2-PFC can be greatly improved by using a dense TiO2 as the photoanode and Prussian Blue (PB) as the cathode. A mixed aqueous solution containing 0.1 M NaClO4 and 0.1 M H2O2 (pH 3) was used as the electrolyte for all the cells in this study, and thus, the cell structure is designated as photoanode-cathode.
Experimental
A paste containing anatase TiO2 particles with mean size of 20 nm (PST-18NR, Nikki Syokubai Kasei) was coated on FTO electrode (sheet resistance = 10 Ω/square) by the doctor blade technique. The as-coated film was heated at 773 K for 1 h to form mesoporous TiO2 nanocrystalline film on FTO (mp-TiO2/FTO). The specific surface area and pore volume of mp-TiO2 were determined to be 17.28 m2 g−1 and 0.72 cm3 g−1, respectively, by nitrogen adsorption-desorption isotherms at 77 K with a micromeritics automatic surface area and porosimetry analyzer (TriStar 3000, Shimadzu). Pore size distribution analysis by the Barret-Joyner-Halenda method afforded a peak pore size of ∼20 nm.19
Sol-gel TiO2 films were formed on FTO by a dip-coating method (d-TiO2/FTO).20 A solution of Ti(OiPr)4 (5.350 g) and acethylacetone (3.775 g) was prepared. To the solution, a solution of ethanol (9.1725 g) and trifluoroacetic acid (0.4687 g) was added by stirring. After fluorine-doped tin oxide film-coated glass substrates were immersed into the mixed solution and pulled up with a speed of 2.0 mm s−1, and then, they were annealed at 773 K form 1 h. The film thickness (ld-TiO2) was changed by repeating the procedures.
Compact TiO2 films were formed on FTO by a spray method (s-TiO2/FTO).21 A coating solution was prepared by adding a solution of ethanol (9.1725 g) and trifluoroacetic acid (0.04687 g) to a solution of Ti(OiPr)4 (5.350 g) and acethylacetone (3.775 g) by stirring. Spraying the solution on FTO heated at 773 K yielded a compact TiO2 film.
PB films were electrodeposited on FTO from an aqueous solution of ferric-ferricyanide according to the method reported by Itaya and co-workers.22 A three-electrode photoelectrochemical cell with the structure of FTO working electrode | a mixed aqueous solution of 0.02 M FeCl3 and 0.02 M K3[Fe(CN)6] (200 mL) | Ag/AgCl reference electrode (TOA-DKK) | GC counter electrode was fabricated. PB films were electrodeposited on FTO under a constant current of −40 μA cm−2. The film thickness (lPB) was controlled by the electrodeposition time (ted).
Scanning electron microscopy (SEM) observation was carried out by Hitachi S-4800 Type II at an applied voltage of 20 kV. UV/Vis diffuse reflectance spectra were recorded on a Hitachi U-4000 spectrophotometer. The reflectance (R) spectra were converted to absorption spectra by using the Kubelka–Munk function (F(R∞) = (1 – R)2/2R). X-ray diffraction (XRD) measurements were performed by a Rigaku Mini Flex X-ray diffractometer operating at 40 kV and 100 mA. The data were collected in the range from 5° to 90° (2θ) by the use of Cu Kα radiation (λ = 1.545 Å).
A three-electrode photoelectrochemical cell with the structure of TiO2/FTO | 0.1 M NaClO4 without and with 0.1 M H2O2 (pH 3) | Ag/AgCl reference electrode (TOA-DKK) | GC was fabricated. Photocurrents were measured at the rest potential in the dark using a potentio/galvanostat (HZ-7000, Hokuto Denko) under illumination from the back side of the TiO2 film by a UV-LED (λ = 365 ± 25 nm, light intensity at 365 nm (I365) = 31.2 mW cm−2 nm−1, HLV-24UV365-4WNRBT, CCS) at 298 K.
For evaluation of the performances as the H2O2-PFC, two-electrode photoelectrochemical cells with the structures of TiO2/FTO photoanode (apparent area = 1.0 × 1.0 cm2) | 0.1 M NaClO4 and 0.1 M H2O2 (pH 3) | GC or PB/FTO cathode (apparent surface area = 2.0 × 2.0 cm2) were fabricated. The current (J)-cell voltage (Vcell) curves were measured under irradiation of UV-light from the back side of the TiO2 film by a UV-LED (λ = 365 ± 25 nm, I365 = 31.2 mW cm−2 nm−1).
Results and Discussion
TiO2 films were formed on FTO using dip-coating (d-TiO2/FTO) with the film thickness varied by the number of coating times (N). Figure 1A shows XRD patterns for the d-TiO2(N)/FTO samples. In every pattern, strong diffraction peaks are observed at 2θ = 26.48°, 33.69°, 37.75°, and 51.52°. These peaks are assignable to the diffraction from the (110), (101), (200) and (211) crystal planes of SnO2, respectively. As a result of d-TiO2-film coating, a new peak indexed as the diffraction from the (101) plane of the anatase TiO2 appears at 2θ = 25.3°. The intensity of the diffraction peak increases with an increase in N. The inset in Figure 1B shows SEM image for d-TiO2(N = 2)/FTO. A uniform d-TiO2 film with the thickness (ld-TiO2) of 0.87 ± 0.05 μm is formed on FTO. Figure 1B shows plots of the thickness of the d-TiO2/FTO bilayer (ld-TiO2/FTO) vs. N. The ld-TiO2/FTO value linearly increases with respect to N according to the equation of ld-TiO2/FTO (μm) = 0.136 N + 0.609. Accordingly, the lFTO is ∼0.61 μm, and the d-TiO2 thickness (ld-TiO2) can be expressed by the equation of ld-TiO2 (μm) = 0.136 N. The crystallite size (d) determined by the Scherrer equation increased with an increase in N: d = 20.3 nm at N = 2, d = 27.1 nm at N = 3, and d = 30.0 nm at N = 4. The film thickness and crystallite size for mp-TiO2 were 3.6 μm and 14.4 nm, respectively.
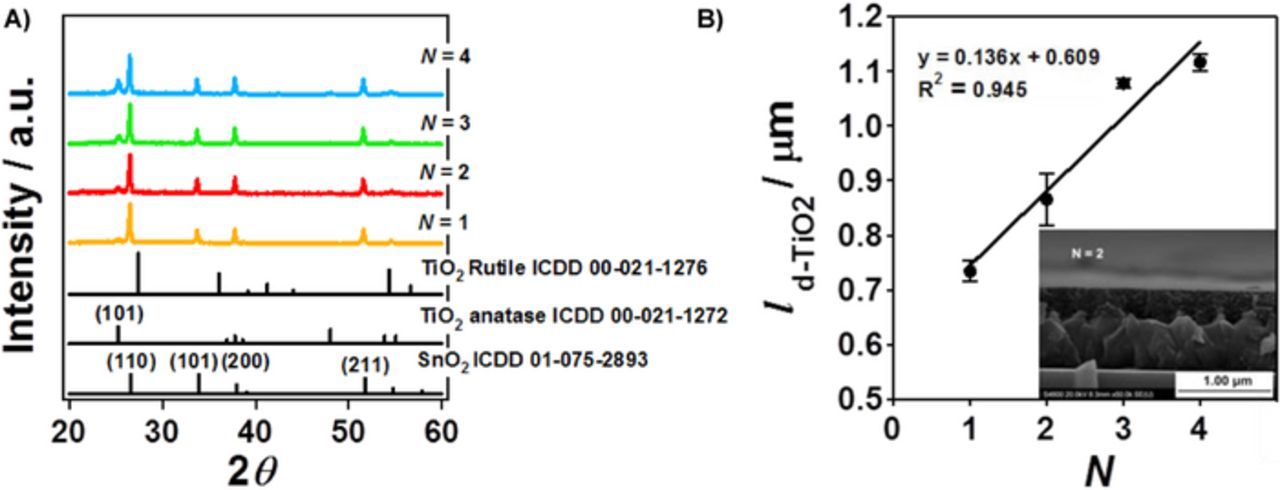
Figure 1. (A) XRD patterns for TiO2(N)/FTO. (B) Plots of the thickness of the d-TiO2/FTO bilayer (ld-TiO2 + F TO) vs. coating number (N). The inset shows the cross-sectional SEM image for TiO2(N = 2)/FTO.
PB films were electrodeposited on FTO (PB/FTO) with the film thickness varied by the electrodeposition time (ted). Figure 2A shows the XRD patterns for PB(ted)/FTO. The electrodeposition of PB induces a diffraction peak at 2θ = 17.58° assignable to the diffraction from its (200) plane. Figure 2B shows UV-visible absorption spectra for PB(ted)/FTO. While the absorption edge for pristine FTO is ∼330 nm, strong absorption due to the intervalency electron transfer appears at 500 nm < λ < 1300 nm with a peak around 600 nm.22 The absorption intensifies with an increase in ted. The lPB determined by SEM observation increased in proportion to ted according to the following equation of lPB(nm) = 89.5ted/min.
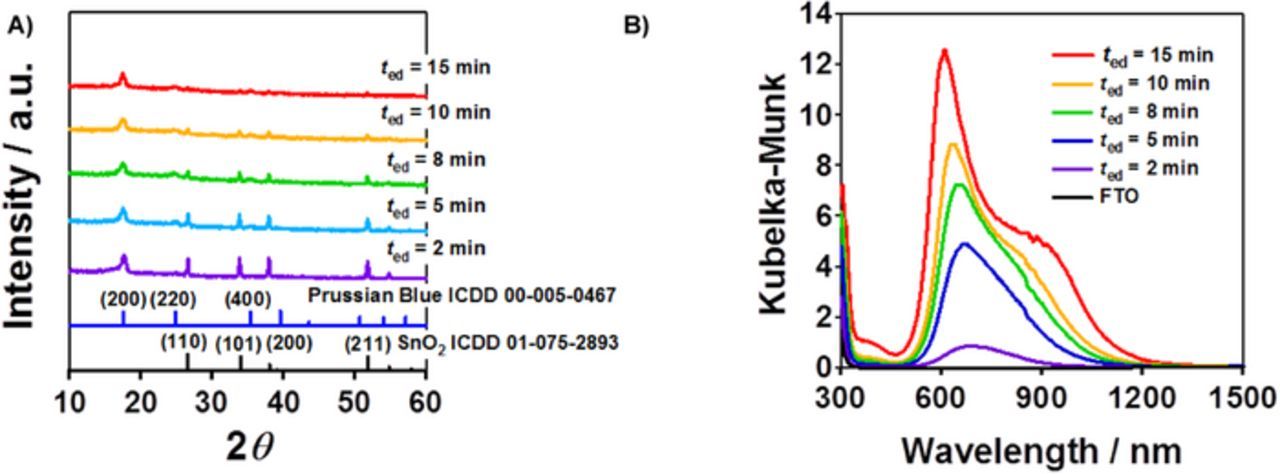
Figure 2. XRD patterns (A) and UV-visible absorption spectra (B) for PB/FTO prepared by varying the electrodeposition time (ted).
Figure 3A shows cyclic voltammetry (CV) curves for the d-TiO2(N)/FTO electrodes, and the pristine FTO and mp-TiO2/FTO for comparison, in an aqueous electrolyte solution containing [Fe(CN)6]3−/Fe(CN)64− redox pairs. In the CV curve for FTO, a pair of redox currents is observed with a formal potential (E') of 0.364 V vs. standard hydrogen electrode (SHE). The current hardly changes with the formation of mp-TiO2, which indicates that the electrolyte solution freely penetrates into the pores of mp-TiO2 to come in contact with FTO at the interface. In the CV curves for d-TiO2(N)/FTO, the current decreases with an increase in N. Further, a compact TiO2 underlayer was formed on FTO by a spray method (s-TiO2),21 and then, the d-TiO2 film was coated over it (d-TiO2/s-TiO2/FTO). Figure 3B shows a CV curve for the s-TiO2/FTO electrodes in an aqueous electrolyte solution containing [Fe(CN)6]3−/Fe(CN)64− redox pairs. In this system, the current due to the reversible redox reactions disappears. Thus, the s-TiO2 film inhibits the direct contact between FTO and the electrolyte solution.
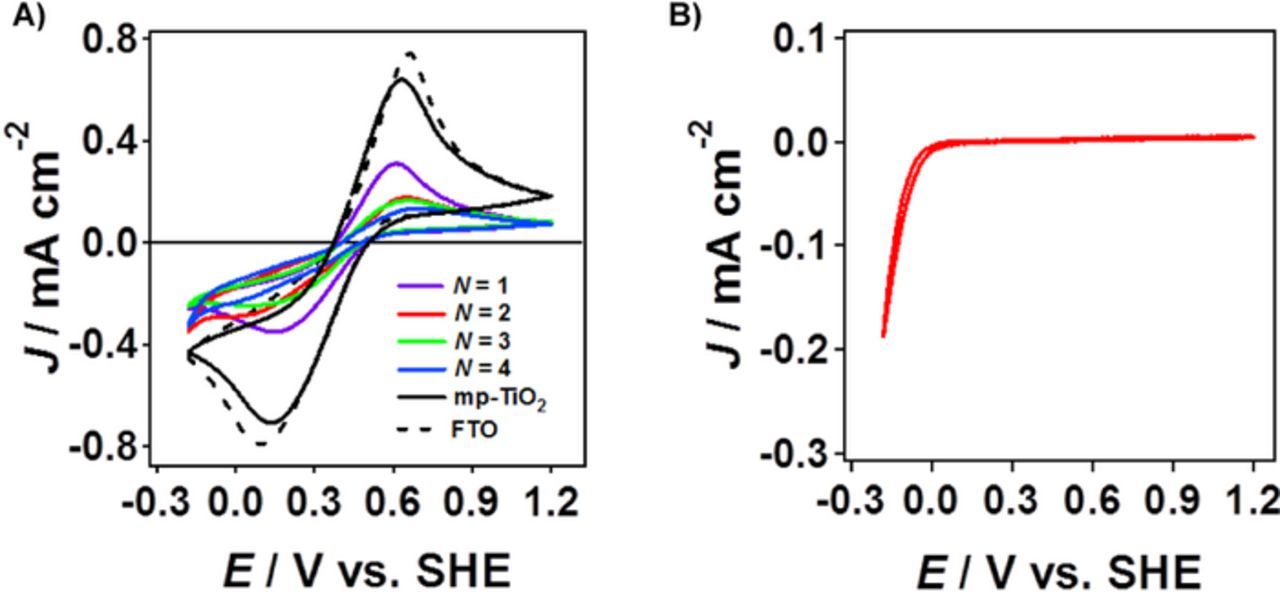
Figure 3. Cyclic voltammograms of d-TiO2(N)/FTO, and for comparison, FTO and mp-TiO2/FTO (A) and s-TiO2/FTO (B) in an aqueous electrolyte solution containing [Fe(CN)6]3−/Fe(CN)64− redox pairs.
First, the TiO2 photoanode effect on the cell performances of H2O2-PFCs with the structure of photoanode-GC cathode was studied. Table I summarizes short-circuit current (Jsc) and open-circuit voltage (Voc) for various cells. Figure 4A compares photocurrent (Jph)-cell voltage (Vcell) curves for the H2O2-PFCs using mp-TiO2/FTO and d-TiO2(N = 2)/s-TiO2/FTO as the photoanode under UV-light irradiation. In each case, no current flows in the dark. Under irradiation, the d-TiO2(N = 2)/s-TiO2/FTO photoanode cell affords much larger Jsc (1.15 mA cm−2) and Voc (684 mV) (cell 3) than the mp-TiO2/FTO photoanode cell (Jsc = 0.328 mA cm−2 and Voc = 464 mV (cell 1). Figure 4B shows plots of Jph and Vcell for the d-TiO2(N)/s-TiO2/FTO photoanode cell as a function of N. Both the Jsc and Voc drastically increases with increasing N (cell 2–5), going through maxima at N = 2 or ld-TiO2 = 0.27 μm. Figure 4C shows the photochronoamperometry curve for the d-TiO2(N = 2)/s-TiO2/FTO-GC cells (cell 3). The initial photocurrent reaches 1.37 mA cm−2, steeply decaying just after irradiation. A similar sharp current spike was also observed for the mp-TiO2/FTO-GC cell (cell 1). These results strongly suggest the presence of a large overpotential for the H2O2 reduction by the GC cathode.
Table I. Cell performances for the one-compartment H2O2 PFCs.
| Cell | Anode | electrolyte | Cathode | Jsc/mA cm−2 | Voc/mV |
|---|---|---|---|---|---|
| 1 | mp-TiO2/FTO (1.0 × 1.0 cm2) | 0.1 M NaClO4 0.1 M H2O2 (pH 3) | GC | 0.328 | 464 |
| 2 | d-TiO2(N = 1)/s-TiO2/FTO (1.0 × 1.0 cm2) | 0.1 M NaClO4 0.1 M H2O2 (pH 3) | GC | 0.668 | 522 |
| 3 | d-TiO2(N = 2)/s-TiO2/FTO (1.0 × 1.0 cm2) | 0.1 M NaClO4 0.1 M H2O2 (pH 3) | GC | 1.15 | 684 |
| 4 | d-TiO2(N = 3)/s-TiO2/FTO (1.0 × 1.0 cm2) | 0.1 M NaClO4 0.1 M H2O2 (pH 3) | GC | 0.546 | 556 |
| 5 | d-TiO2(N = 4)/s-TiO2/FTO (1.0 × 1.0 cm2) | 0.1 M NaClO4 0.1 M H2O2 (pH 3) | GC | 0.497 | 550 |
| 6 | mp-TiO2/FTO (1.0 × 1.0 cm2) | 0.1 M NaClO4 0.1 M H2O2 (pH 3) | PB(ted = 10 min) | 0.818 | 617 |
| 7 | d-TiO2(N = 2)/s-TiO2/FTO (1.0 × 1.0 cm2) | 0.1 M NaClO4 0.1 M H2O2 (pH 3) | FTO | 0.668 | 702 |
| 8 | d-TiO2(N = 2)/s-TiO2/FTO (1.0 × 1.0 cm2) | 0.1 M NaClO4 0.1 M H2O2 (pH 3) | PB(ted = 0.5 min) | 0.884 | 788 |
| 9 | d-TiO2(N = 2)/s-TiO2/FTO (1.0 × 1.0 cm2) | 0.1 M NaClO4 0.1 M H2O2 (pH 3) | PB(ted = 1 min) | 1.33 | 778 |
| 10 | d-TiO2(N = 2)/s-TiO2/FTO (1.0 × 1.0 cm2) | 0.1 M NaClO4 0.1 M H2O2 (pH 3) | PB(ted = 2 min) | 1.66 | 764 |
| 11 | d-TiO2(N = 2)/s-TiO2/FTO (1.0 × 1.0 cm2) | 0.1 M NaClO4 0.1 M H2O2 (pH 3) | PB(ted = 3 min) | 1.46 | 767 |
| 12 | d-TiO2(N = 2)/s-TiO2/FTO (1.0 × 1.0 cm2) | 0.1 M NaClO4 0.1 M H2O2 (pH 3) | PB(ted = 4 min) | 1.56 | 779 |
| 13 | d-TiO2(N = 2)/s-TiO2/FTO (1.0 × 1.0 cm2) | 0.1 M NaClO4 0.1 M H2O2 (pH 3) | PB(ted = 5 min) | 1.44 | 792 |
| 14 | d-TiO2(N = 2)/s-TiO2/FTO (1.0 × 1.0 cm2) | 0.1 M NaClO4 0.1 M H2O2 (pH 3) | PB(ted = 8 min) | 1.39 | 780 |
| 15 | d-TiO2(N = 2)/s-TiO2/FTO (1.0 × 1.0 cm2) | 0.1 M NaClO4 0.1 M H2O2 (pH 3) | PB(ted = 10 min) | 1.57 | 787 |
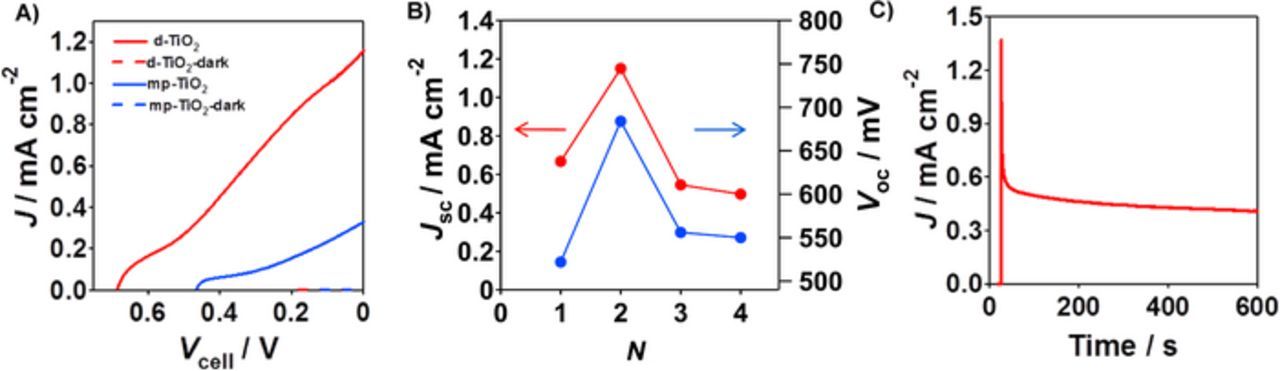
Figure 4. (A) Photocurrent (Jph)-cell voltage (Vcell) curves for two-electrode H2O2-PFC with the structure of photoanode (apparent area = 1 cm2) | deaerated aqueous electrolyte solution containing 0.1 M NaClO4 and 0.1 M H2O2 (pH 3) | GC using mp-TiO2/FTO (blue) and d-TiO2(N = 2)/s-TiO2/FTO (red) as the photoanode under UV-light irradiation (UV-LED, I365 = 31.2 mW cm−2 nm−1). (B) Plots of Jsc and Voc for the d-TiO2(N)/s-TiO2/FTO photoanode cells vs. N under UV-light irradiation (UV-LED, I365 = 31.2 mW cm−2 nm−1). (C) Photochronoamperometry curve for the d-TiO2(N = 2)/s-TiO2/FTO photoanode cell under UV-light irradiation (UV-LED, I365 = 31.2 mW cm−2 nm−1).
Next, the effect of the cathode on the cell performances was examined. As shown in Table I, the replacement of the GC cathode by PB/FTO greatly improves the short-circuit current (Jsc) and open-circuit voltage (Voc) for both the mp-TiO2/FTO and d-TiO2/s-TiO2/FTO photoanode cells.
Figure 5A compares the performances of mp-TiO2/FTO-PB(ted = 10 min)/FTO cell (cell 6) and d-TiO2(N = 2)/s-TiO2/FTO-PB(ted = 10 min)/FTO cell (cell 15). The cell performance for the latter is much superior to the former. Strikingly, the Jsc of 1.57 mA cm−2 and the Voc of 787 mV are achieved for the d-TiO2(N = 2)/s-TiO2/FTO-PB(ted = 10 min)/FTO cell, whereas the dark current is negligibly small in this potential range. Thus, the excellent cell performance is ascribable to the concerted effect of the dense TiO2 bilayer photoanode and the PB cathode. Figure 5B shows the photochronoamperometry curve for the d-TiO2(N = 2)/s-TiO2/FTO-PB(ted = 10 min)/FTO cell (cell 15). The sharp current spike observed for the mp-TiO2/FTO-GC and d-TiO2/s-TiO2/FTO-GC cells disappears although the photocurrent gradually decreases with irradiation. Evidently, the remarkable enhancement of the cell performances stems from the excellent electrocatalytic activity of PB. PB possesses a cubic unit cell dimension of 1.02 nm to form unique nanopores.23 Table I also shows that the Jsc drastically increases with increasing ted to reach an almost constant at ted ≈ 2 min or lPB ≈ 180 nm (cell 7–15). Importantly, this finding indicates that the PB-catalyzed H2O2 reduction occurs at not only the external surfaces but also the internal surfaces.
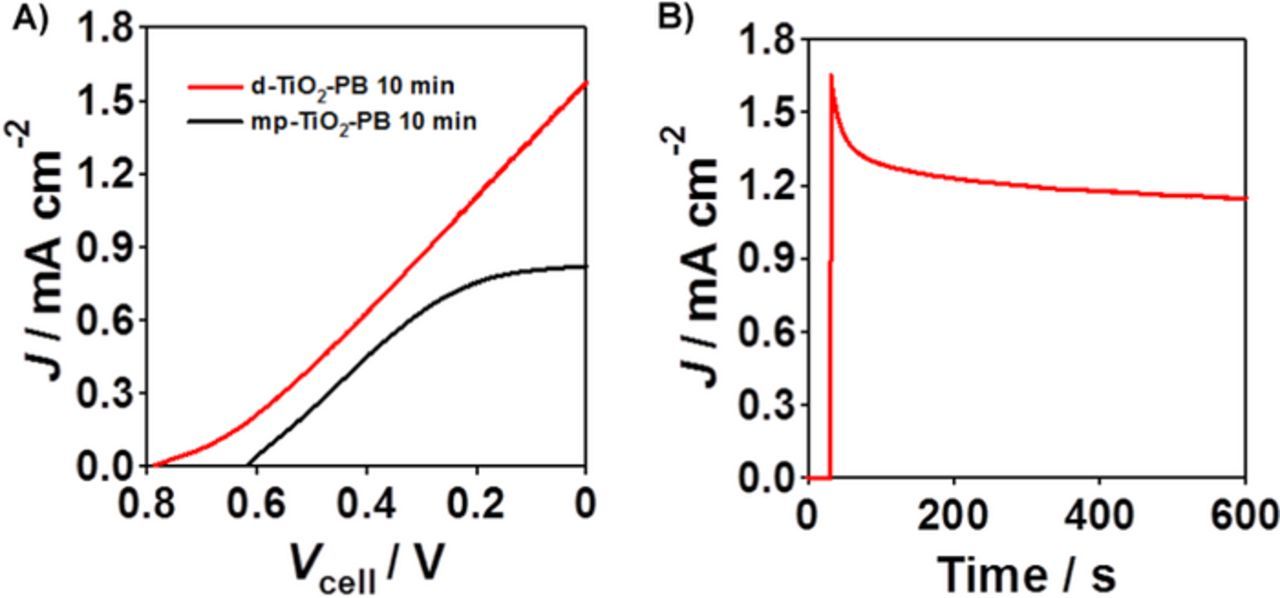
Figure 5. (A) Photocurrent (Jph)-cell voltage (Vcell) curves for two-electrode H2O2-PFC with the structure of mp-TiO2-PB (black) and d-TiO2(N = 2)/s-TiO2/FTO-PB (red) photoanode cells. (B) Photochronoamperometry curve for the d-TiO2(N = 2)/s-TiO2/FTO-PB/FTO cell.
The action mechanism of the present H2O2-PFC can be explained by Scheme 1. UV-light irradiation of the TiO2 anode promotes the electrons in the valence band (VB) to the conduction band (CB). The VB-holes with the potential (E) of +2.89 V (vs. SHE at pH 3) easily oxidize H2O2 to O2 (E = 0.518 V vs. SHE at pH 3), of which evolution was confirmed by gas chromatography.10 H2O2 is known to be adsorbed on TiO2 to form a surface Tis-OOH complex, where the subscript s denotes the surface atom.24 We verified the formation of the H2O2 complex on the mp-TiO2 surface by UV-visible absorption spectroscopy.10 During the transport of the CB-electrons to the electron-collecting FTO electrode, part of them can be lost by the reduction of H2O2 adsorbed on TiO2 (loss 1 expressed by Eq. 3). This loss would become larger as the surface area of the TiO2 electrode increases. In addition, in the mp-TiO2/FTO anodes, the electrons can also be consumed on FTO at the TiO2/FTO interface (loss 2 expressed by Eq. 4). The compact structure of the d-TiO2/s-TiO2 bilayer effectively suppresses the penetration of the electrolyte solution into the film to minimize the losses. The increase in ld-TiO2 increases the light absorption amount of TiO2, but the probability for the CB-electrons to reach FTO decreases due to the recombination and/or electron trapping. The balance between them would explain the presence of the optimum ld-TiO2. Further, the electrons move to the PB cathode through the external circuit to efficiently reduce H2O2 to H2O due to the excellent electrocatalytic activity.22
![Equation ([3])](https://content.cld.iop.org/journals/1945-7111/165/5/F300/revision1/d0003.gif)
![Equation ([4])](https://content.cld.iop.org/journals/1945-7111/165/5/F300/revision1/d0004.gif)
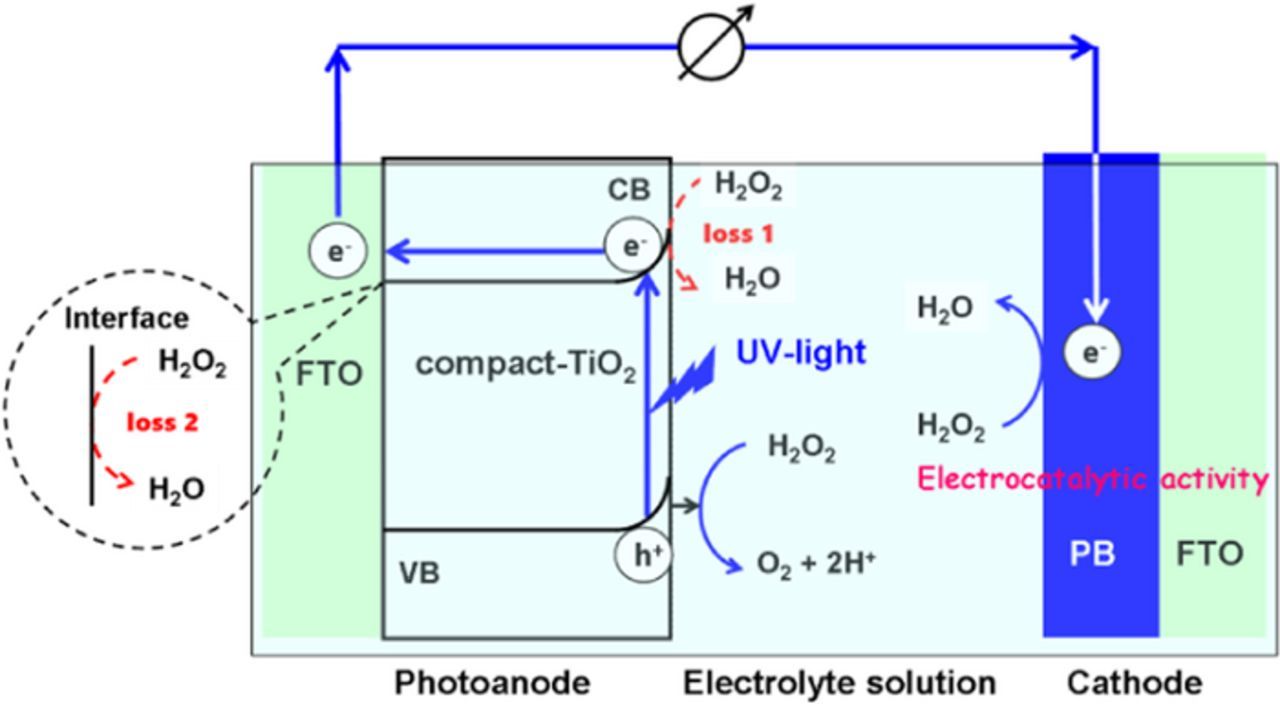
Scheme 1. The action mechanism of the H2O2-PFC using a compact TiO2/FTO as the photoanode and PB/FTO as the cathode.
Conclusions
A one-compartment PFC cell uing d-TiO2/s-TiO2/FTO and PB/FTO as the photoanode and cathode, respectively, was constructed. Under optimum conditions, this PFC provides Jsc = 1.57 mA cm−2 and Voc = 787 mV, which are much greater than the original mp-TiO2/FTO-GC cell (Jsc = 0.328 mA cm−2, Voc = 464 mV). The remarkable improvement in the cell performances can be attributed to the decrease in the losses at the compact TiO2 photoanode and the excellent electrocatalytic activity of the PB cathode for H2O2 reduction.
Acknowledgments
This work was supported by a Grant-in-Aid for Scientific Research (C) No. 15K05654, and MEXT-Supported Program for the Strategic Research Foundation at Private Universities.
ORCID
Hiroaki Tada 0000-0001-8638-0697