Abstract
State of charge (SOC) and state of health (SOH) are of critical importance to ensure safety, reliability, and prolong battery life. In this paper, a novel SOC & SOH estimation method considering side reactions over the lifespan of a Li-ion degraded battery is presented. To achieve this, an order-reduced electrochemical model considering side reactions is established first by simplification of the partial differential equations (PDEs) using the Laplace transform, inverse Laplace transform, Pade approximation, etc. The open-circuit-voltage (OCV) versus SOC correlation is utilized as the link between equivalent circuit model (ECM) and electrochemical model. Then the current induced accumulated aging effects of loss of ions and active materials on the electrode stoichiometry could be calculated to obtain a modified OCV- SOC curve. The updated OCV-SOC relationship is applied to an ECM based SOC estimator. The SOH monitoring is achieved by quantifying the capacity fade with the help of equilibrium potentials. Finally, the robustness and effectiveness of the SOC and SOH estimation scheme integrated with the presented OCV curve are validated by simulated and experimental results. The results show that the SOC estimation precision of the presented scheme regarding battery interior properties has been improved compared to the existing method. Future work is also highlighted.
Export citation and abstract BibTeX RIS

This is an open access article distributed under the terms of the Creative Commons Attribution 4.0 License (CC BY, http://creativecommons.org/licenses/by/4.0/), which permits unrestricted reuse of the work in any medium, provided the original work is properly cited.
Lithium-ion batteries have been widely applied to the electric vehicle and hybrid electric vehicle in terms of reducing the environmental pollution or overcoming the energy shortage.1 To ensure the performance, safety and longevity of an energy storage system in an embedded environment, the battery management system (BMS) is necessary.2 One important task for a BMS is to accurately estimate the state of charge (SOC) and state of health (SOH) of the battery pack.3 These two states indicate the level of charge and degradation of a battery, respectively.4 Variances in electrochemical characteristics among Li-ion battery caused by aging effects could result in erroneous SOC estimation and SOH prediction.5 However, many existing studies focusing on SOC monitoring often neglect these electrochemical aging effects.6 In addition, considerable researchers have been only focusing on the ECMs or electrochemical models respectively. Electrochemical models are suitable for understanding the distribute electrochemistry reactions in the electrodes. As for the ECMs, its advantages lies in the simple model formulation and fast computation speed.7 Therefore, it is important to strike a balance between model complexity and accuracy to estimate SOC accurately in real-time even when battery ages. But the combination of the ECM and electrochemical models is seldom seen.
Open circuit voltage (OCV) data is important for identifying SOC and SOH under different conditions. The OCV is a measure of the electromotive force of the battery, which is generally known for having a monotonic relationship with the SOC of the battery.8 Therefore, SOC estimation methods are commonly adopted to impose a characterization of the OCV curve (through a polynomial, a look-up table,...).9 For battery aging, the OCV curve changes as OCV reflects battery performance degradation.10 The impact of aging on a cell equilibrium voltage is presented in Ref. 11. This change distorts the estimator if no more work has been done to adjust the curve. Moreover, the relationship between SOC and OCV is often assumed to be constant over the lifespan of a lithium-ion battery which may result in inherent estimation error.12 Therefore, to keep the sufficient accuracy of SOC estimation, it is significant to take the aging corrections into consideration and update the OCV-SOC relation periodically. In light of this, we choose the OCV-SOC curve as the bond connecting the electrochemical model and ECM.
To the best of our knowledge, the existing OCV modelling method can be broadly classified into current-voltage based13 and electrochemical model-based approaches.14
The current-voltage based OCV-SOC correlation can be developed by a direct OCV curve inversion methods if cells' steady state voltage measurement is permitted. This method is realized by collecting pairs of (OCV, SOC) values over the entire range of SOC then using the data to estimate the parameters of the function OCV = f(SOC) for a hypothesized function f.15 However, it requires a long rest time to reach a steady state for online application and does not take into account the underlying electrochemical phenomenon of the battery.16
The electrochemical model-based approach characterizes the OCV of each electrode as a function of utilization of the electrode (the lithium concentration in the electrode normalized by the maximum possible concentration) or the SOC of each electrode. Subsequently, the difference between the OCV of the anode and cathode gives the OCV of the complete cell.17 Side reactions are considered as the major factor for lithium-ion battery degradation in recent literatures.18 The side reactions mainly occur at the electrode/electrolyte surface. At anode, the side reactions consume Li+ and the solvent of the electrolyte. The side reactions products continue to accumulate as battery ages, leading to the overgrowth of the solid electrolyte interphase (SEI).19 At cathode, the side reaction could be caused by electrolyte oxidation, transition metal dissolution and electrode damage depending on the chosen electrode material.20 The products of these side reactions are always electronic isolators that can electrically isolate some particles causing loss of active materials. In addition, some Li+ might be trapped by positive electrode structure distortion.21 The loss of ions and active materials at two electrodes contribute to the deterioration of the OCV-SOC curve of a cell. By establishing an electrochemical aging model considering side reactions, the variation of aging effects on electrode stoichiometry could be calculated to form a modified OCV-SOC correlation.
Battery model parameters such as internal resistance, slowly vary over the course of degradation. As a result, estimator design often combines a state observer and a parameter identifier.22 Many literatures choose ECM to calculate battery voltage under the predetermined SOC because of its light computation load.23 Also, the Extended kalman filter (EKF) has been widely used in the SOC estimation field owing to its small computational complexity and relatively reliable result.24 Given that the commonly-used ECM might be imprecise enough for aged cell with SOC estimation.25 Therefore, it is necessary to integrate the ECM with proper electrochemical aging factors to maintain the real-time estimation precision within an acceptable range without sacrificing the computational efficiency.
In this paper, the aged cells are opened up for observation and component analysis to find out the major aging mechanism in the beginning. Then an electrochemical aging model considering side reactions is put forward via simplification of the partial differential equations (PDEs) using the Laplace transform, inverse Laplace transform and Pade approximation. Based on the proposed model, current induced aging effects on OCV-SOC correlation are characterized. Then the modified OCV-SOC relationship is applied to an ECM based SOC estimator periodically. The capacity fade is also analyzed by the updated OCV-SOC function, which represents SOH decay. A detailed scheme for SOC and SOH determination is illustrated in Fig. 1. Cycling tests over the lifespan of Li-ion battery are carried out to validate the estimator. The simulated results and experimental results verify the robustness and validity of the proposed method. The results show that the presented SOC estimation scheme is able to track the real state with a satisfactory error range over the lifespan of a battery.
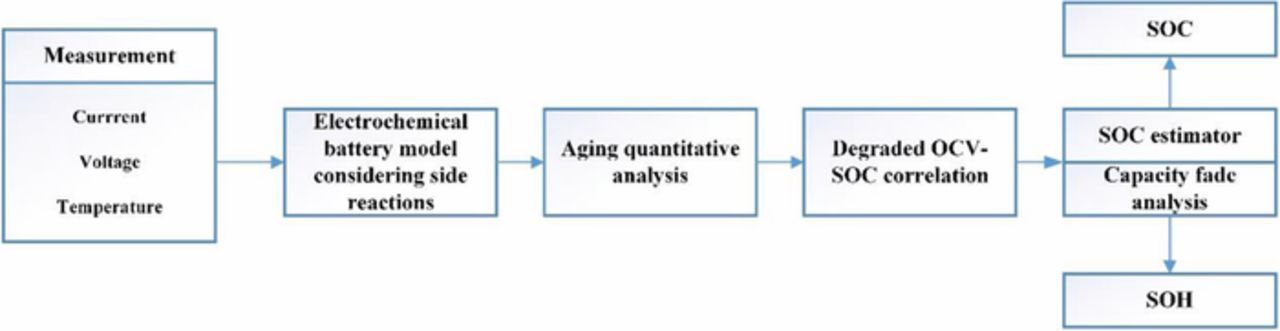
Figure 1. Scheme of SOC and SOH estimation based on modified OCV-SOC correlation considering side reactions.
The remainder of this paper is organized as follows. In OCV Curve Aging Analysis section, the aging effects on OCV is investigated. In Estimation of SOC and SOH considering side reactions section, the SOC and SOH estimation method integrated with degradation mechanism are presented. The experimental setting and results are introduced in Experimental setup section. In Comparison and discussion section, simulation and experimental results are compared to validate the estimator. The conclusion is drawn in Conclusions section.
OCV Curve Aging Analysis
Assumption on aging mechanism in this paper
This paper focus on the battery aging effects at current load (≤3C) and temperature range (25°C-45°C). For these conditions it has been shown that the SEI formation is the main cause of battery degradation.26 To further confirm the aging mechanisms on anode and cathode after cycling tests, we opened the cell in the glove box filled with argon and took some samples from both anode and cathode surface for further analysis. Fig. 2 shows photographs of the negative and the positive electrode of aged cell at 3C, 25°C after 180 cycles. The surface of the positive electrode appears to be very smooth. In contrast, the negative shows clear signs of delamination near the edge. The Scanning electron microscope (SEM) analysis was carried out to investigate the surface morphologies. Fig. 3 compares the SEM images of the positive and negative electrode from a fresh cell and a cell cycled at 3C after 180 cycles. The results show that there is no apparent products deposited on the cathode and evident crack formation compared to the anode. Then the fresh and aged cathode samples were sent to X-ray diffraction (XRD) tests. The XRD results in Fig. 4 show that there is no phase change or new phase formation in the cathode active materials of the battery investigated in this paper. That proves that the cathode aging problem is not obvious in this work. These findings could also be seen in Ref. 27. The reason for the phenomenon could be that the reaction of formation of the positive electrode/electrolyte interphase caused by electrolyte oxidation is very slow and the carbon coating of the cathode plays a strong protective role toward formation of surface species on the material.28 To investigate if transition mental dissolved on the negative electrode surface, we conducted EDS (Energy Dispersive Spectrometer) test for the anode samples. The result is depicted in Fig. 5. The elements detected were C, O, Si, F, and P. No transition mental element was detected on the anode surface. We could conclude that metal dissolution is not likely a concern for these cells. This could due to the maximum cycle number and temperature in this paper is not over enough to cause transition metal dissolution.29
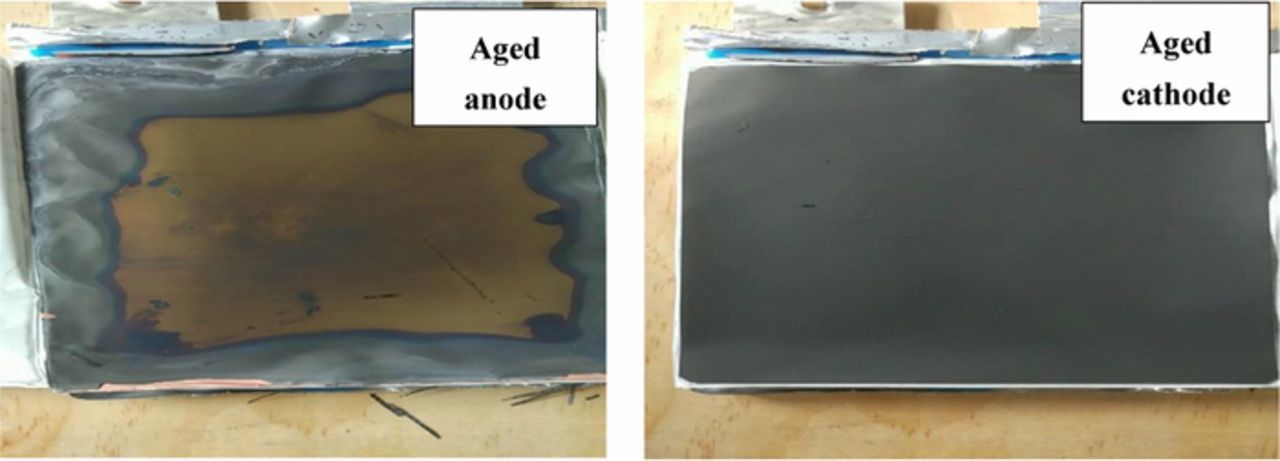
Figure 2. Images of aged negative (left) and positive (right) electrodes.
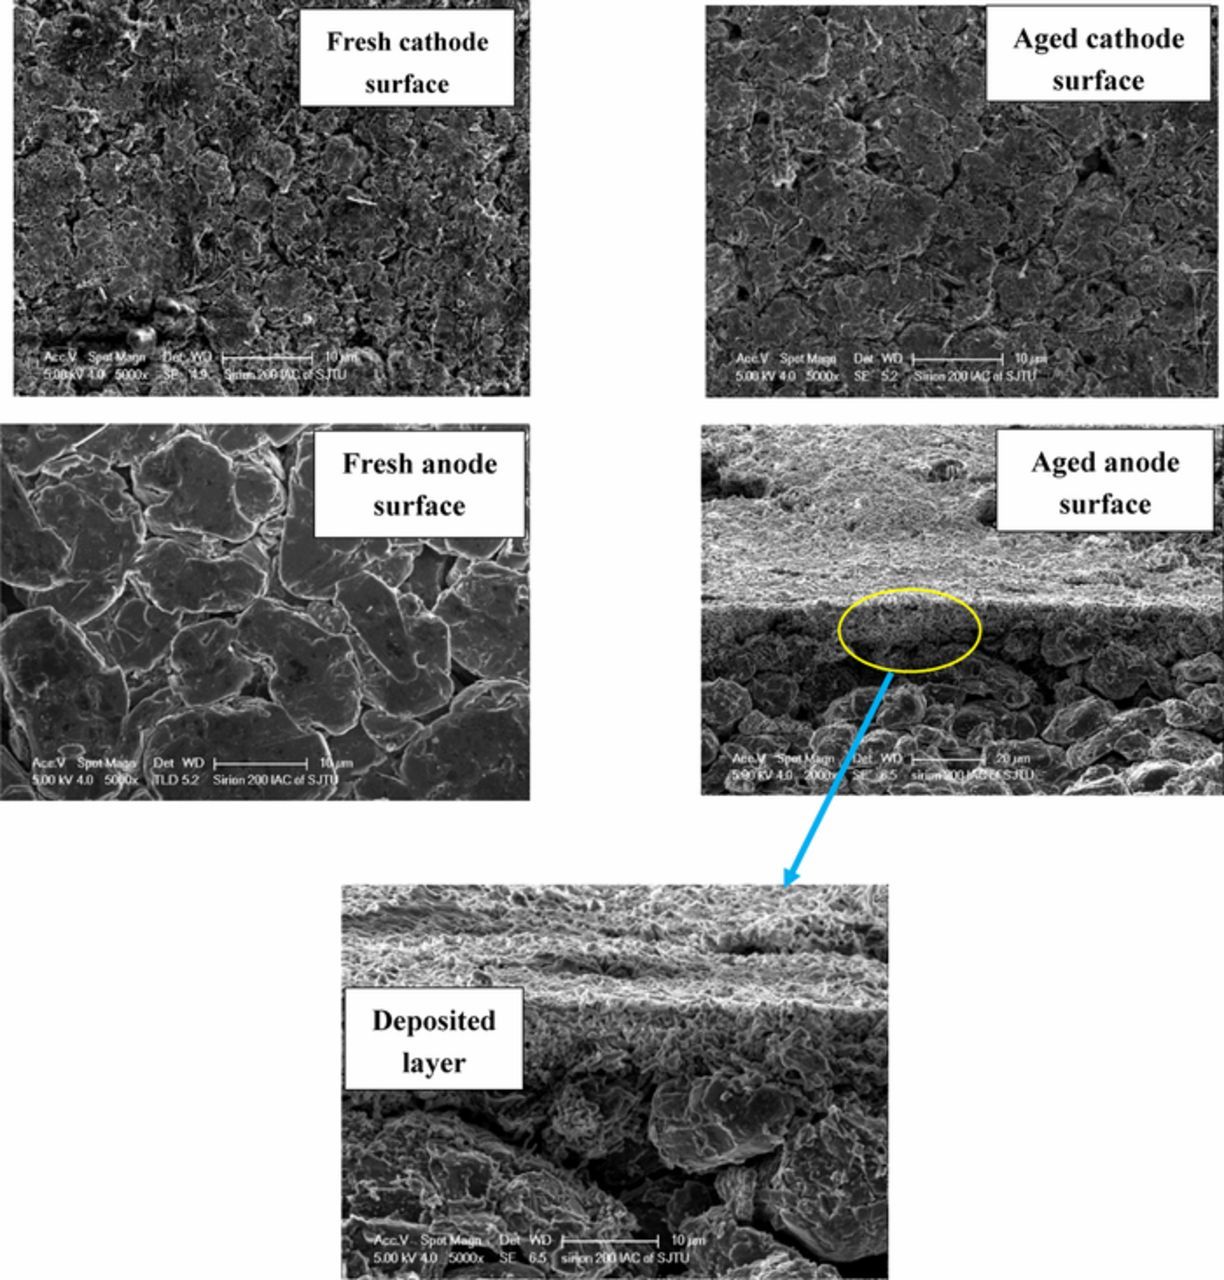
Figure 3. SEM images of the positive and negative electrodes (fresh and aged).
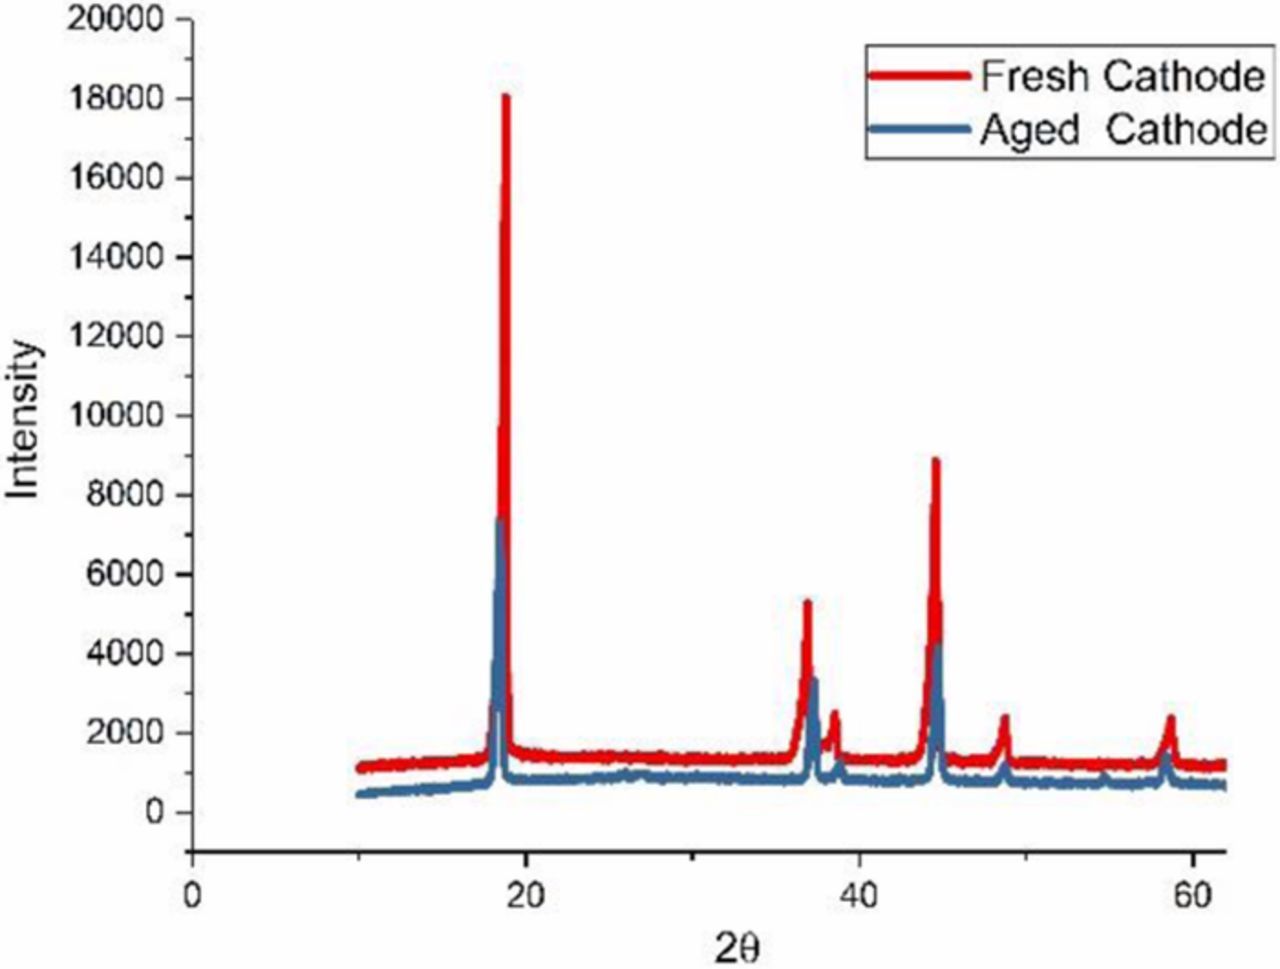
Figure 4. XRD result for fresh and aged cathode.
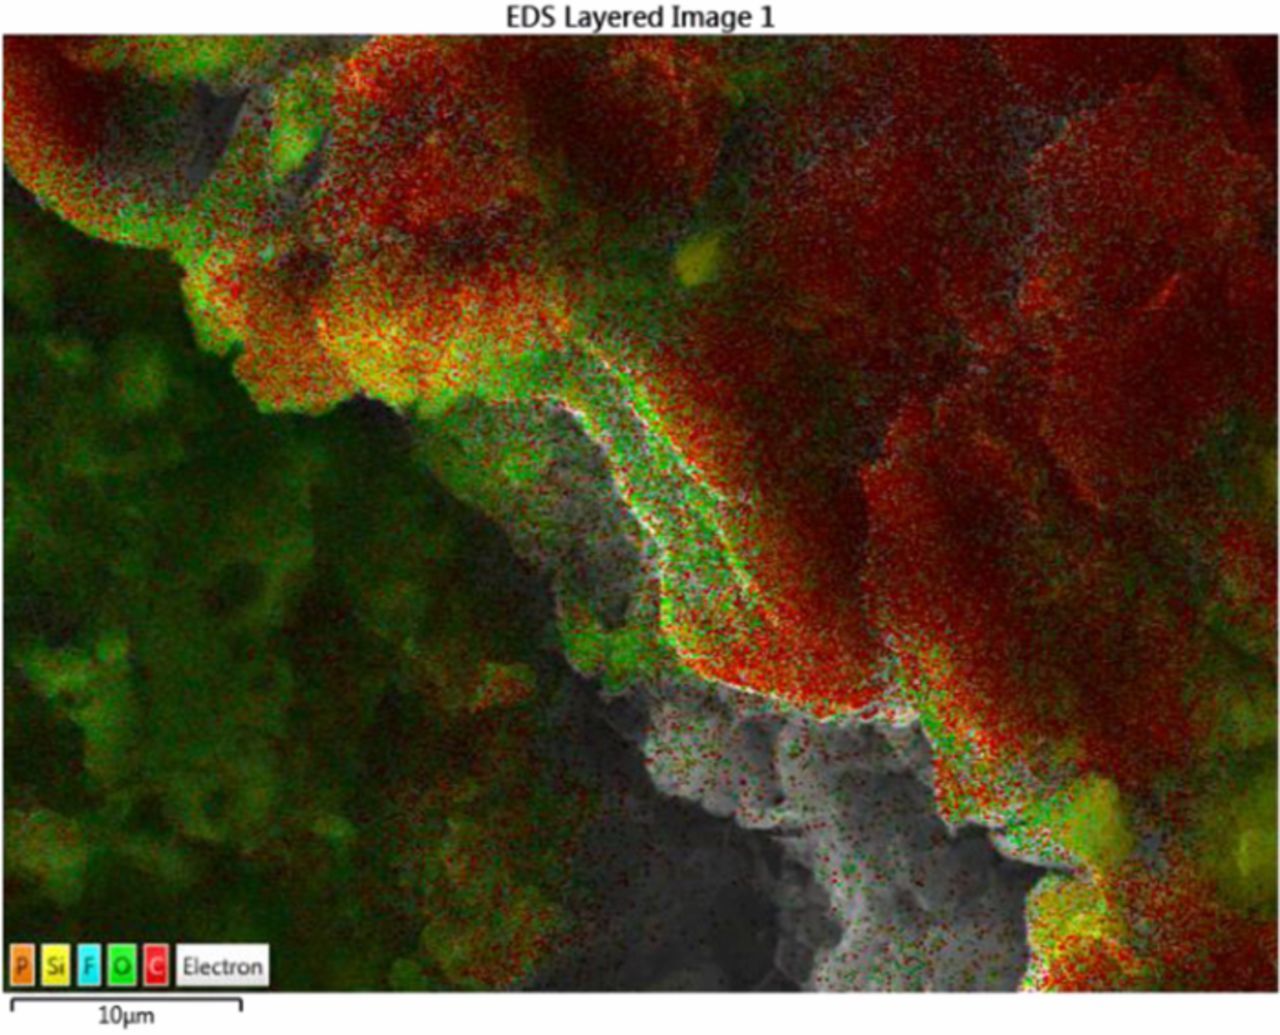
Figure 5. EDS result for aged anode.
Generally, It is much more difficult to solve for and detect the side reaction effects on the positive electrode than that on the negative electrode.21,30 Therefore, many papers related to battery aging model descriptions focused on the anode aging phenomena.19,31
Based on the experiments and aforementioned researches, the following assumption are proposed: the side reactions at cathode would not have a significant impact on the presented aging model for the battery tested in this paper. The side reactions at anode should be regarded as the major cause for battery aging in this paper.
Electrochemical aging model considering side reactions
Based on the proposed assumption in Assumption on aging mechanism in this paper section, The model presented here is based on the authors' simplified electrochemical pseudo two-dimensional (P2D) model25 and aging descriptions with modification to side reactions at anode in Ref. 19. The aging model is described briefly as below:
The SEI growth is considered as side reactions at anode. Therefore, a total of two electrochemical reactions occur at the anode, as illustrated in Fig. 6.
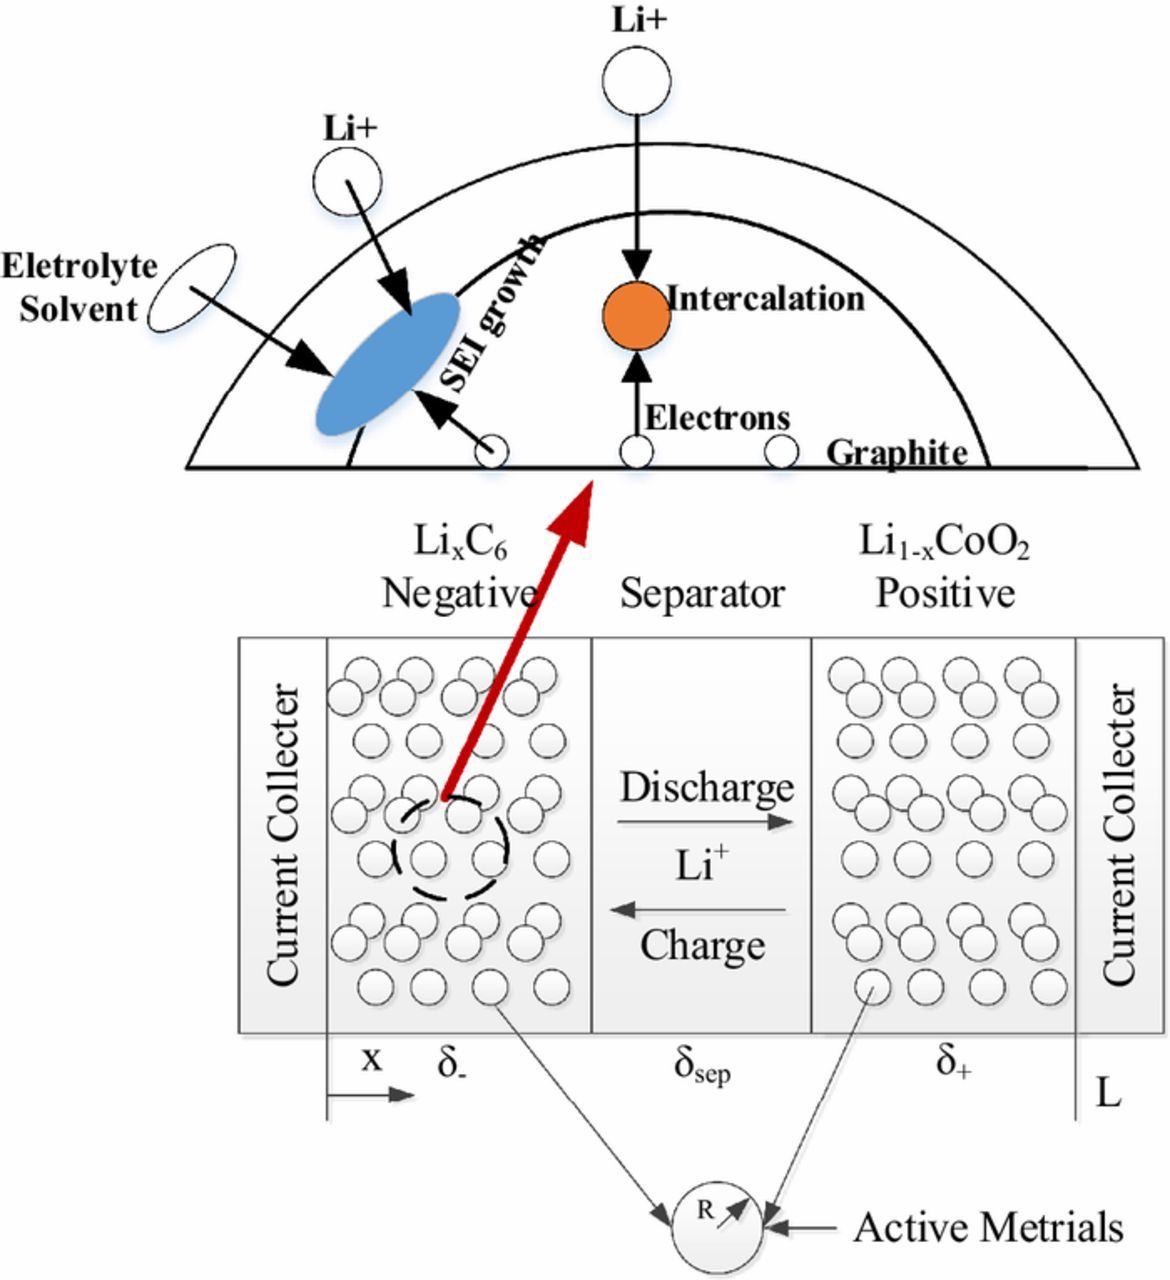
Figure 6. Schematic illustration of the electrochemical reactions occurring at anode during charging.
The intercalation current density is  , denoted by Eq. 1a. When side reactions occur at the interface between the electrode particles and the electrolyte, the current density of SEI growth is induced as jside by Eq. 1b.
![Equation ([1a])](https://content.cld.iop.org/journals/1945-7111/165/16/A4018/revision1/d0001.gif)
![Equation ([1b])](https://content.cld.iop.org/journals/1945-7111/165/16/A4018/revision1/d0002.gif)
The total volumetric current density jtotal is the sum of the current of the above two reactions:
![Equation ([2])](https://content.cld.iop.org/journals/1945-7111/165/16/A4018/revision1/d0003.gif)
The activation overpotential of the side reactions ηside, is represented as:
![Equation ([3])](https://content.cld.iop.org/journals/1945-7111/165/16/A4018/revision1/d0004.gif)
where ϕs and ϕe are electrical potentials of the solid electrode particle and electrolyte, respectively. RSEI is the resistance of SEI that is presented only on the anode side. Uθeq, side is the equilibrium potential of side reactions and assumed to be 0.21V in this paper.
The local current density of side reactions is calculated by the Tafel expression as follows:
![Equation ([4])](https://content.cld.iop.org/journals/1945-7111/165/16/A4018/revision1/d0005.gif)
where i0, side is the exchange current density of side reactions. nside is the number of ions involved in the side reactions which is equal to 2 in this study.
The amount of ion loss, Cionloss can be obtained by integrating the side reaction rate,jside over the volume of composite anode and operation time:
![Equation ([5])](https://content.cld.iop.org/journals/1945-7111/165/16/A4018/revision1/d0006.gif)
where δ− denotes the thickness of composite anode (m),τ is the total operating time (s), A is the electrode plate area and as is the active surface area per electrode unit volume.
The volume fraction of SEI, εSEI is defined as:
![Equation ([6])](https://content.cld.iop.org/journals/1945-7111/165/16/A4018/revision1/d0007.gif)
Loss of active materials is simply described as follows:
![Equation ([7])](https://content.cld.iop.org/journals/1945-7111/165/16/A4018/revision1/d0008.gif)
where εs is the volume fraction of solid active material that is dependent on thickness x and kiso is a dimensionless coefficient which describes how fast the active materials are isolated from chemical reactions.
Energy conservation of the whole cell (lumped thermal model) is expressed below:
![Equation ([8])](https://content.cld.iop.org/journals/1945-7111/165/16/A4018/revision1/d0009.gif)
Detailed descriptions of these governing equations can be found in the literature.32
Effect of side reactions on OCV
OCVfresh is defined as the difference between the cathode equilibrium potential and the anode potential, expressed as:
![Equation ([9])](https://content.cld.iop.org/journals/1945-7111/165/16/A4018/revision1/d0010.gif)
End of charge (EOC) and end of discharge (EOD) correspond to OCVmax and OCVmin, respectively. Capacity is calculated based on the amount of charges transferred from EOC to EOD as follows:18
![Equation ([10])](https://content.cld.iop.org/journals/1945-7111/165/16/A4018/revision1/d0011.gif)
It is supposed that p and n are used to denote the electrodes stoichiometry of positive and negative electrodes, respectively. εs is the volume fraction of the active material. δ denotes the thickness of composite anode (m). A is the electrode plate area. F is the Faraday constant. Electrodes stoichiometry i ∈ {p, n} are defined as the ratio of the surface Li-ion concentration Cs, surface, over the maximal Li-ion concentration Cs, max.
![Equation ([11])](https://content.cld.iop.org/journals/1945-7111/165/16/A4018/revision1/d0012.gif)
For a fresh cell, nEOC,nEOD pEOC and pEOD equal to nmax,nmin pmin, and pmax, respectively, so the capacity of a fresh cell is
![Equation ([12])](https://content.cld.iop.org/journals/1945-7111/165/16/A4018/revision1/d0013.gif)
A relationship between p and n for a fresh cell can be then deduced:
![Equation ([13])](https://content.cld.iop.org/journals/1945-7111/165/16/A4018/revision1/d0014.gif)
The values of nmax,pmin nmin and pmax are provided by the manufacturer in the beginning. A linear dependence of one of the OCV-SOC model parameters on temperature is expressed as below:
![Equation ([14])](https://content.cld.iop.org/journals/1945-7111/165/16/A4018/revision1/d0015.gif)
where T is a reference temperature (e.g., 25°C), and φ(Tref) is the value of the OCV-SOC model parameters at Tref. Δφ is the sensitivity to temperature determined for each parameter φ(T).33 The OCV-SOC characterization curve almost remains the same regardless of the temperature of the battery.34 Thus, the OCV curve of a fresh cell under room temperature, 25°C is chosen as the reference. The OCV curve of a fresh cell are plotted versus stoichiometric number in Fig. 7a.The actual stoichiometric number on the anode side, n, and volume fraction of the active material, εs −, could decrease due to loss of ions and active material, respectively. Thus, the variation of anode stoichiometric number, nshift and the decrement of volume fraction of active material, Δεs − are included in the ultimate correlation as below:
![Equation ([15])](https://content.cld.iop.org/journals/1945-7111/165/16/A4018/revision1/d0016.gif)
Δεs − is expressed in Eq. 7 and nshift is graphically shown in Fig. 7 as the amount of shift in n axis, which is illustrated by the amount of ion loss:
![Equation ([16a])](https://content.cld.iop.org/journals/1945-7111/165/16/A4018/revision1/d0017.gif)
where Cionloss is calculated based on Eq. 5. Δεs − is obtained from Eq. 7, which is negative.
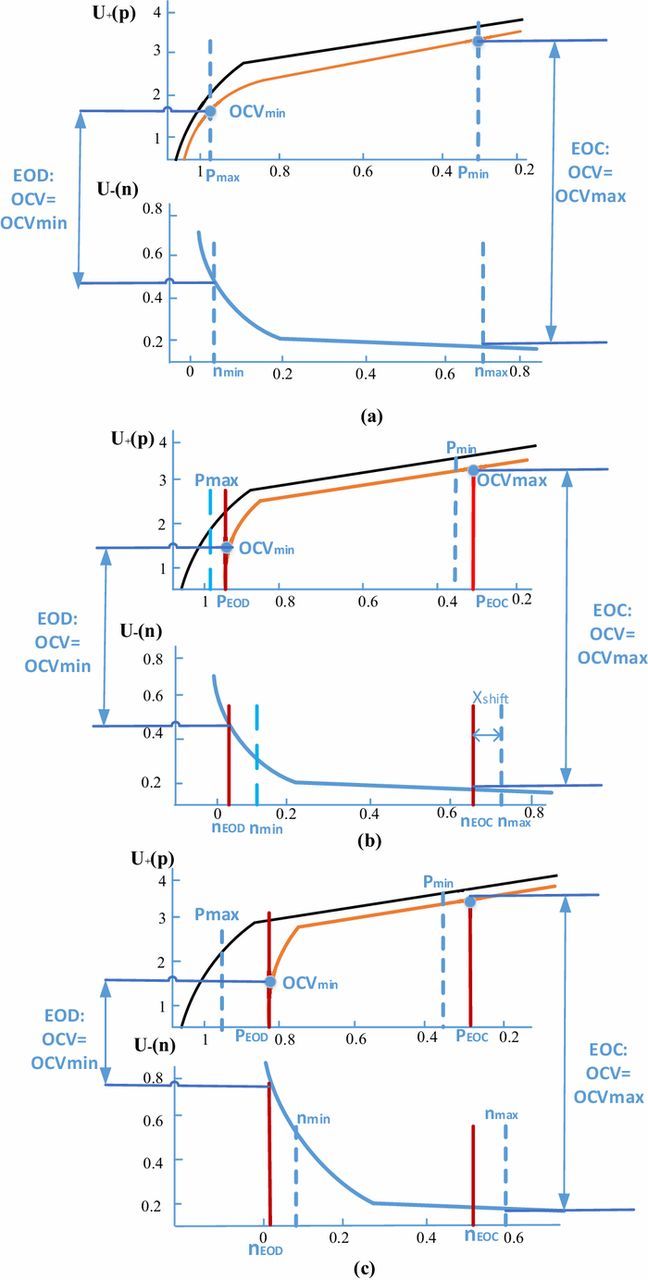
Figure 7. (a) Equilibrium potentials for fresh cells. (b) Equilibrium potentials for aged cells considering loss of ions. (c) Equilibrium potentials for aged cells considering loss of ions and active materials.
Based on Eq. 13, 15, 16, the relationship between the aged anode stoichiometric number nagedand the fresh anode stoichiometric number n can be deduced as:
![Equation ([16b])](https://content.cld.iop.org/journals/1945-7111/165/16/A4018/revision1/d0018.gif)
Finally, the aged cell OCV is given as:
![Equation ([16c])](https://content.cld.iop.org/journals/1945-7111/165/16/A4018/revision1/d0019.gif)
The mathematical relationship for U+(p) and U−(n) of fresh cells is listed in Table I. The values are from the battery manufacturer.
Table I. The electrode OCV-SOC correlation for fresh cell.
| U+(p)/V | U-(n)/V | |
|---|---|---|
| Fresh | 0.85628*exp((1.7138*p^1.9087)+ | 0.1493+0.8493*exp(−61.79*n)+0.3824* |
| (3.3206*exp(−7.5939e− 09*p^(−6.2107)) | exp(−665.8*n)−exp(39.42*n−41.92)−0.03131* | |
| −2*exp(−2/p^6) −0.54381 | atan(25.59* n−4.099)−0.009434*atan(32.49*n−15.74) |
Capacity fade analysis
When an aged cell is charged to EOC, the OCVmax is determined by two equilibrium potentials.
![Equation ([17a])](https://content.cld.iop.org/journals/1945-7111/165/16/A4018/revision1/d0020.gif)
The two variables, pEOC and nEOC are solved using Eq. 15 and Eq. 16c. Similarly, when an aged cell is discharged to EOD, the OCVmin is denoted as:
![Equation ([17b])](https://content.cld.iop.org/journals/1945-7111/165/16/A4018/revision1/d0021.gif)
pEOD and nEODbecome less than pmin and nmax , respectively. It means that the cathode electrode is unable to be fully charged and the anode electrode can be over-discharged at the same OCVmin, as depicted in Fig. 7b.
When a certain amount of the active material is lost (Δεs −), n changes faster with respect to p, according to Eq. 15. This can be analyzed by shrinking the n axis, as shown in Fig. 7c. By updating n in Eq. 16c, the anode OCV curve is obtained considering both loss of ions and loss of active materials. From Fig. 7, we can see that when side reactions are considered, the following relationship for aged cells can be deduced:
![Equation ([18])](https://content.cld.iop.org/journals/1945-7111/165/16/A4018/revision1/d0022.gif)
where nEOC, pEOC, nEOD and pEOD are numerically solved using Eqs. 16–17 and plotted in Fig. 7. OCVmax and OCVmin are determined by the cell's cutoff voltage which remains constant during cycling. Furthermore, the capacity is calculated by the following equation:
![Equation ([19])](https://content.cld.iop.org/journals/1945-7111/165/16/A4018/revision1/d0023.gif)
SOH defined by Eq. 20 is also obtained.
![Equation ([20])](https://content.cld.iop.org/journals/1945-7111/165/16/A4018/revision1/d0024.gif)
Estimation of SOC and SOH Considering Side Reactions
SOC estimation with adjusted OCV
The 2nd order RC ECM is selected because the 2nd order ECM is an optimum choice for implementation of most battery energy management strategies.35 As depicted in Fig. 8, R1 and C1 is the polarization resistance and capacitance, respectively. R2 and C2 represents the diffusion resistance and capacitance, respectively. VOCV denotes the open circuit voltage which is mapped to SOC based on the proposed OCV-SOC relationship. V is the terminal voltage.
![Equation ([21])](https://content.cld.iop.org/journals/1945-7111/165/16/A4018/revision1/d0025.gif)
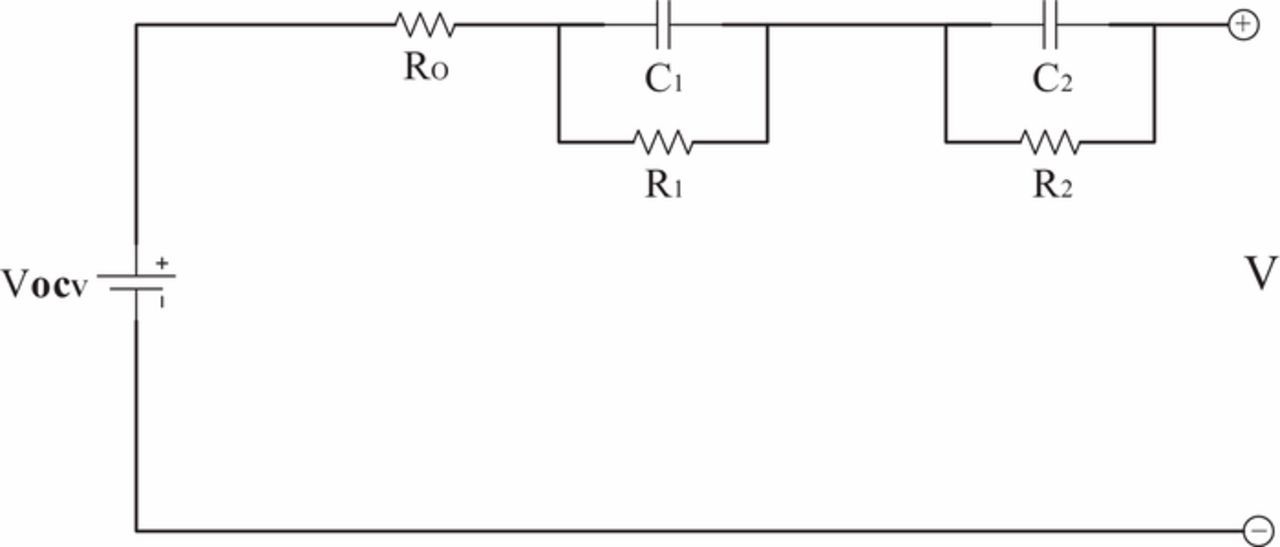
Figure 8. Second-order RC equivalent circuit.
The initial values of the parameter estimate θ(0) and its error covariance matrix P(0) need to be firstly prescribed. The constant λ is the forgetting factor and is very important to obtain an accurate estimated parameter set with small error, typically 0.95 < λ < 1.
![Equation ([22])](https://content.cld.iop.org/journals/1945-7111/165/16/A4018/revision1/d0026.gif)
- (2) After τ1, τ2, R1, R2 are identified in step (1). The third-order Extended Kalman Filter (EKF) is taken to estimate SOC. The state vector is X = [SOC, U1, U2]T. The state space function is indicated as below:
![Equation ([23])](data:image/png;base64,iVBORw0KGgoAAAANSUhEUgAAAAEAAAABCAQAAAC1HAwCAAAAC0lEQVR42mNkYAAAAAYAAjCB0C8AAAAASUVORK5CYII=)
![Equation ([23])](https://content.cld.iop.org/journals/1945-7111/165/16/A4018/revision1/d0027.gif)
where T is the sample time, 1s. Q is the capacity. Considering different timescales of SOC and SOH, the OCV-SOC correlation is updated every 20 cycles based on Eq. 16c and then is utilized in C(k). The entire SOC estimation process is shown in Fig. 9.
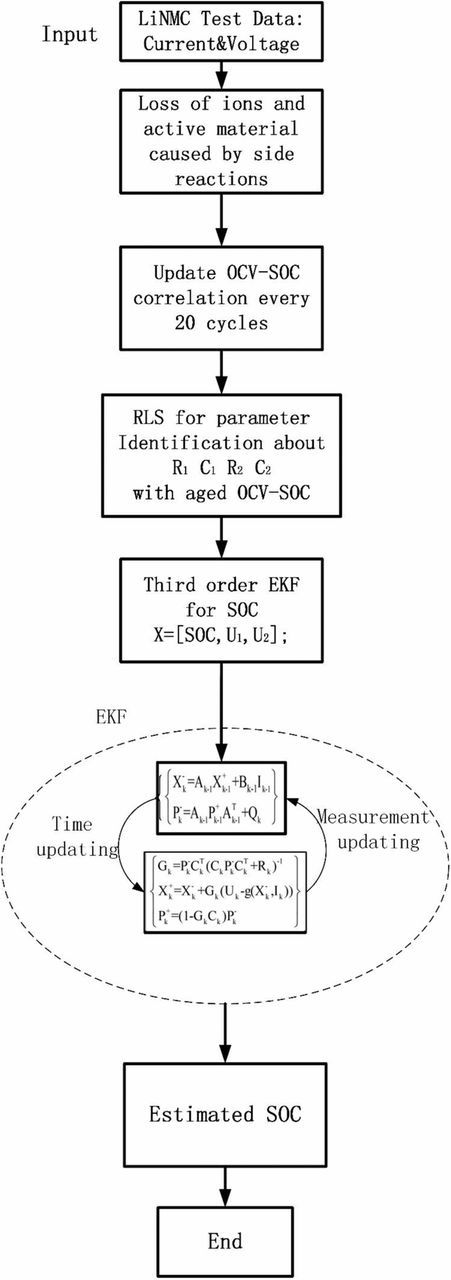
Figure 9. Schematic of SOC estimation.
Experimental
The NMC lithium-ion cells used in this study are the commercial 26Ah prismatic pouch cell. The cells are placed in a temperature-controlled chamber at constant ambient temperature, 25°C. A multi-channel cell tester is chosen to perform cycling instructions. To study the influence of the operational conditions on battery degradation, three different charge C-rates (1C,2C, and 3C) are applied to three NMC batteries, respectively. To accelerate aging rate, 3C discharge rate is utilized for all three batteries. During each cycle, the cell is charged by means of the constant-current-constant-voltage (CCCV) method. The cutoff voltage for constant current (CC) charge process is 4.2V and the charge is terminated when the current drops below 1.4A. After a relaxation of 10 min, the battery is discharged at 3C-rate until a voltage of 2.5V is reached. The discharge step is followed by another 10 min rest before moving to the next cycle. Each 20 cycles, a complete 1C (dis)charge is performed to evaluate the capacity of aged batteries. During the capacity test, the cell is charged using constant current-constant voltage (CCCV) protocol (CC @1C to 4.2V, followed by CV @4.2V to 1.4A) followed by a 30min rest, and then discharged at a constant rate of 1C to a cutoff voltage of 2.5V. The integration of the current flowing out of the battery during 1C discharge is considered as the capacity of the cell. The cycling tests stop when SOH reaches 60%. Therefore, the final cycle number of 1C, 2C and 3C is 460, 400 and 180, respectively.
Comparison and Discussion
Robustness and effectiveness against different C-rates and cell aging.
Before testing the SOC estimator with our proposed OCV-SOC relationship, it is necessary to validate the effectiveness of the simplified battery model integrated with the updated OCV-SOC correlation after different cycles. The discharge curves under 1C, 2C and 3C for simulation and experiment after different cycles are listed in Fig. 10. As it can be seen in Fig. 10, the simulated voltage almost superposes the experimental value regardless of the different C-rates. Hence, the battery aging model is proved to be effective.
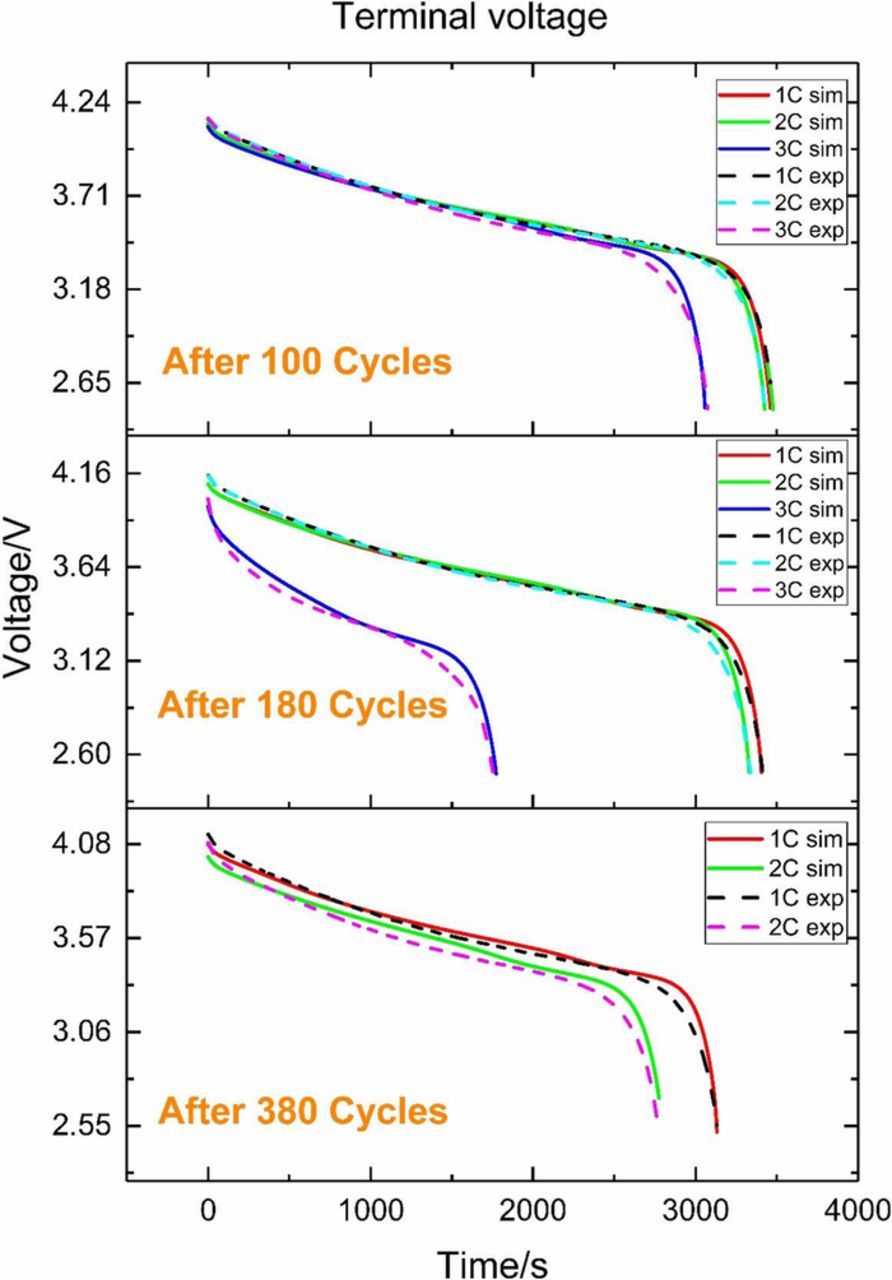
Figure 10. Simulated and experimental discharging curve after different cycles.
To better evaluate the robustness of the SOC estimator in an environment close to a realistic one, artificial Gaussian noise is added to the current collected by the tester. The mean and standard deviation of the noise are −1A and 1.6A (around 2% of the full range), respectively.
In addition, we assume that the absolute measurement error of the cell OCV is 8 mV.36 The 1C, 2C and 3C cycling datasets for different cycles are used in this subsection. The initial error of the EKF is assumed to be 10%. The initial values of the EKF prediction and correction gain matrices are fixed for all cases. For fresh cells, the SOC estimator is tested under 1C, 2C and 3C charging current, respectively. Fig. 11a shows the SOC estimation results for fresh cells. It can be seen that the presented estimator efficiently compensates for the initial error and has a satisfactory accuracy of 5%, indicating a good robustness.
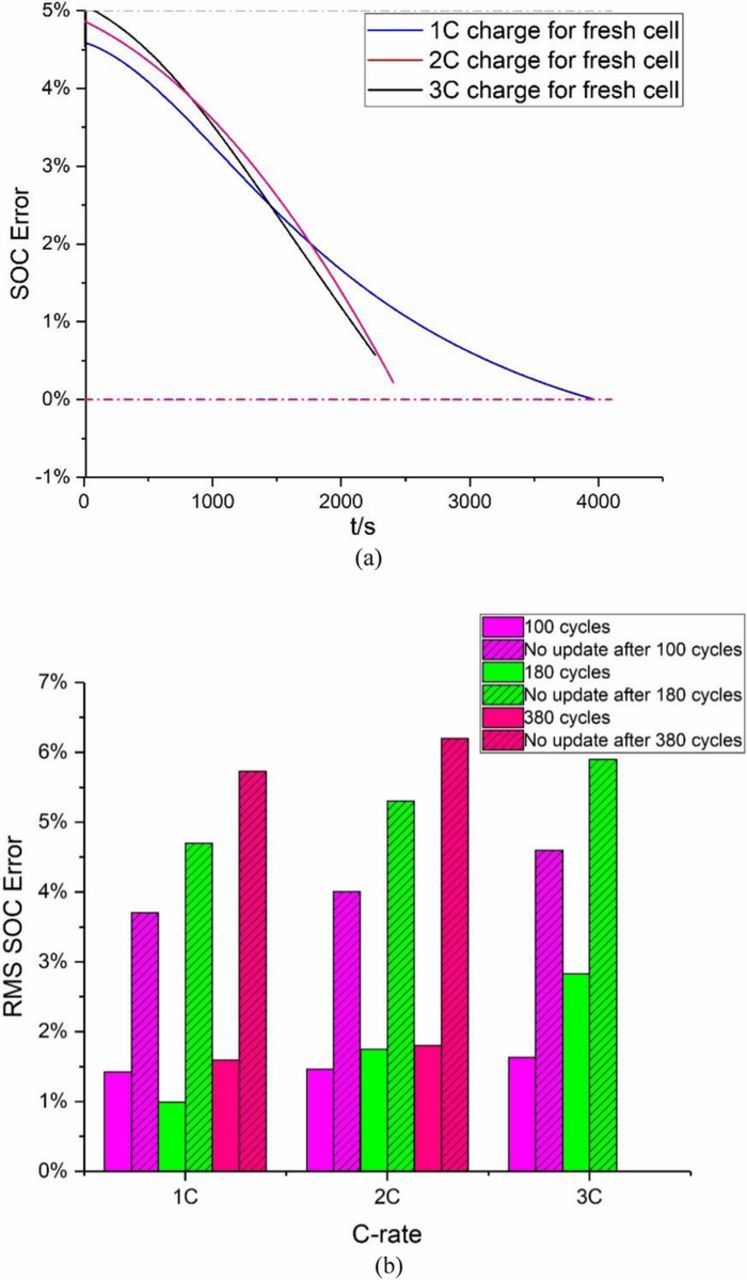
Figure 11. (a) SOC estimation errors for fresh cells. (b) Comparison results of RMS SOC estimation results after aging.
For aged cells, the OCV-SOC curve is updated based on the proposed model and then applied to the SOC and SOH estimator. In addition, to investigate the effectiveness of the updated OCV-SOC curve, the OCV-SOC relationship for fresh cells is considered as constant for all cases and applied to the SOC estimator under different aging states for comparison. The RMS errors of the SOC estimation for aged cells under different cycling conditions after varying cycles are shown in Fig. 11b. It can be seen that if the OCV-SOC correlations are not updated, the estimator performance deteriorates significantly. The RMS Error at 3C is slightly larger than that at 1C and 2C. One reason for this phenomenon may be that high C-rate significantly and instantaneously accelerates the side reaction rate and leads to some unknown reactions such as lithium plating or changes in porosity.37 Obviously, the RMS errors of the SOC estimator without OCV-SOC parameter updated are clearly larger than those updated. Updating the OCV-SOC relationship can improve the SOC estimation in most cases. Moreover, the RMS estimation errors in the validation datasets under three loading current profiles are around 2%, verifying a satisfactory robustness and effectiveness against different charging C-rates.
SOH estimation for aged cells
Fig. 12 highlights that the SOH estimation method introduced in Eq. 19–20 shows good convergence toward experimental values and is capable of monitoring capacity fade over the battery lifespan. The SOH estimator is intentionally operated offline. For cycles at 1C, 2C and 3C, the maximum error is mostly below 2%. At the final stage of cycling, the noticeable fluctuations in error(some>0.05) around 180 cycles for 3C or 360 cycles for 2C are likely caused not only by degradation effects on model accuracy but also by excessive noise from experimental data.
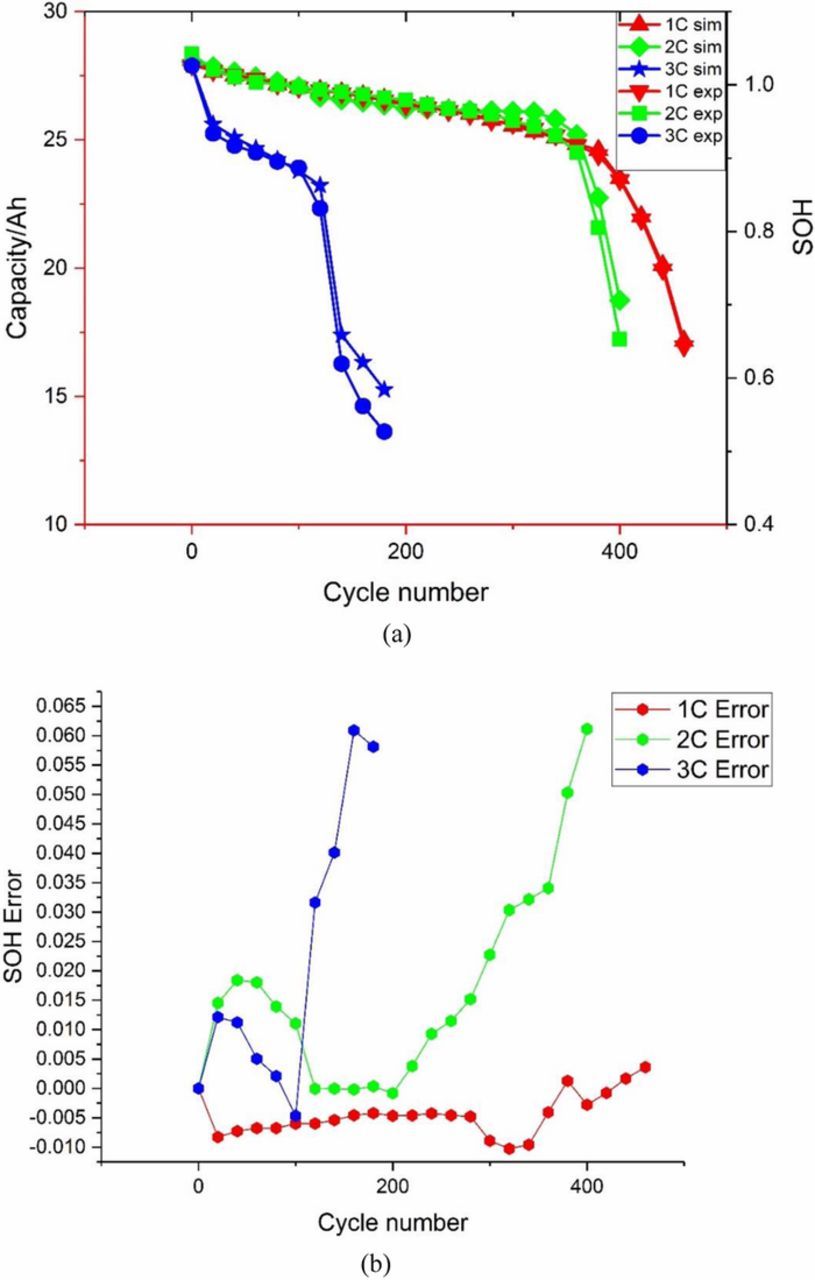
Figure 12. (a) SOH estimation result. (b) SOH estimation error.
Conclusions
In this paper, we propose a novel SOC estimation and SOH prediction method for a Li-ion degraded battery considering side reactions. The SOC estimation scheme is presented by incorporating the ECM with electrochemical properties. For the electrochemical aging model, the special characterization assumes the side reactions at anode as the primary aging factor during the lithium intercalation process for lithium-ion batteries. The OCV-SOC correlation is chosen as the bond connecting the ECM and electrochemical model. The loss of ions and active materials caused by the side reactions at the anode are precisely calculated based on a simplified P2D electrochemical model. Then these current induced aging effects are taken into account to form an updated OCV-SOC relation. The accuracy and robustness of ECM based SOC estimator integrated with the modified OCV-SOC relationship for a Li-ion degraded battery are validated by cycling tests and simulation results. The estimation result of the state estimator satisfies the specification within an acceptable range and has been improved compared to the no aging factor incorporated method. Thus, we can conclude that the presented SOC and SOH estimator combined with adjusted OCV-SOC considering side reactions is suitable for accurately evaluating battery states. In the future, our work will focus on the two aspects:
- Design more comprehensive battery tests(under different temperatures and driving profiles) with sophisticated instruments(High Precision Charger, Li MAS NMR, FIB and FTIR) to study and model the battery overall aging process in detail. Given that the most existing estimation model is based on ECM, we plan to
- Develop a novel nonlinear robust observers for SOC estimation of Li-ion battery based on the electrochemical aging model.
List of Symbols
| as, i | specific surface area of electrode (m−1) |
| A | sandwich area of the cell (m2) |
| cs | lithium concentration in the solid phase (mol m−3) |
| Cionloss | ion loss (Ah) |
| Cp | specific heat (Jkg−1K−1) |
| F | farady constant (96487c mol−1) |
| h | convective heat transfer coefficient (Wm−2K−1) |
| i0 | exchange current density (Am−2) |
 |
current density of intercalation reactions |
| jside | current density of side reactions |
| L | length between Cu collector and Al collector(m) |
| m | mass of a cell (kg) |
| Q | capacity (Ah) |
| Qhaet | heat source (W) |
| R | universal gas constant (8.3143j mol−1k−1) or resistance |
| Rs | paticle radius of active material (m) |
| RSEI | resistance of SEI |
| T | cell temperature (K) |
| T∞ | ambient temperature(K) |
 |
molar volume of SEI |
Greek
| δ- | Thickness of negative electrode (m) |
| εs | volume fraction of solid phase |
| εe | volume fraction of liquid phase |
| αc | transfer coefficient for cathode reaction |
| η | overpotential on the electrode |
| δ+ | Thickness of positive electrode (m) |
| αa | transfer coefficient for anode reaction |
| ф | potential in the electrolyte |
| δSEI | thickness of SEI (m) |
| εSEI | Volume fraction of SEI |
Subscripts
| a | anode |
| c | cathode |
| e | electrolyte phase |
| eq | equilibrium |
| int | intercalation |
| max | maximum |
| min | minimum |
| s | solid phase |
| side | side reactions |
| + | positive electrode |
| − | negative electrode |
Acknowledgment
This research is supported by the National Natural Science Foundation of China (NSFC) under the grant number of 51677118 and National Key R&D Plan Key Special Project (2017YFE0102000).
ORCID
Yizhao Gao 0000-0002-9140-702X