Abstract
As a derivative of LiNiO2, NCA (LiNi1-x-yCoxAlyO2) is widely used in the electric vehicle industry because of its high energy density. It is thought that Co and Al both play important roles in enhancing NCA material properties. However, there is no solid evidence in the literature that clearly shows that Co is required in NCA with high nickel (e.g. when 1-x-y > 0.9) content. Therefore, a systematic study on the roles of different cation substituents in a series of LiNi1-nMnO2 (M = Al, Mn, Mg, or Co) materials was made. In-situ X-ray diffraction (XRD) and differential capacity versus voltage (dQ/dV vs. V) studies showed that the multiple phase transitions in LixNiO2 during charge and discharge, thought to cause poor charge-discharge capacity retention, were suppressed in LixNi0.95M0.05O2 (M = Al, Mn, or Mg), while 5% Co failed to suppress the phase transitions. First principles calculations were made to understand the function of each substituent. Accelerating rate calorimetry shows that unlike Al, Mn, or Mg, Co has no contribution to safety improvement. Therefore, we believe that Co brings little or no value at all to NCA-type materials with high Ni content (> 90% Ni in the transition metal layer) and we hope this paper will spur more interest in Co-free materials.
Export citation and abstract BibTeX RIS

This is an open access article distributed under the terms of the Creative Commons Attribution 4.0 License (CC BY, http://creativecommons.org/licenses/by/4.0/), which permits unrestricted reuse of the work in any medium, provided the original work is properly cited.
Lithium ion batteries with high energy density, low cost, and long lifetime are desired for electric vehicle and energy storage applications. In the family of layered transition metal oxide materials, LiNi1-x-yCoxAlyO2 (NCA) has been of great interest in both industry and academia because of high energy density,1–3 and it has been successfully commercialized and used in electric vehicles by Panasonic and Tesla, respectively. Because Co has a relatively high price of $29.98 USD/lb as of Aug. 3, 2018, while the prices of Ni and Al are only $6.00 and $0.92 USD/lb, respectively, as reported on InfoMine (http://www.infomine.com/investment/metal-prices), reducing the Co content in NCA materials has become a priority.4
NCA was developed from LiNiO2 by partially substituting Ni with Co and Al. Substitution of Al for Ni was shown to improve the thermal stability and safety.5,6 Partial replacement of Ni with Co was thought to be effective to the structure stabilization by hindering the cation mixing between Ni2+ and Li+,7,8 and suppressing the multiple phase transitions during charge and discharge.9 However, the role of Co mentioned above is in doubt. With modern synthesis methods, LiNiO2 with little Ni / Li cation mixing can be made without any Co substitutions.10 The phase transition suppression mentioned in Reference 9 was observed in LiNi0.5Co0.5O2, whose Co composition is very different from modern NCA materials. In order to reduce the use of Co in Ni-rich materials and eventually replace Co with other alternative elements, the role of Co, as well as other cation substituents needs to be studied carefully and understood thoroughly.
Partially substituting Ni with other metals has been considered to be an effective approach for improving Ni-rich positive electrode materials. NCA was developed by doping Co and Al into LiNiO2 and it is a successful commercial product. E. Rossen et al.11 reported that solid solutions of LixMnyNi1-yO2 can be synthesized for x near 1 and 0 ≤ y ≤ 0.6, and it was found that the reversible capacity decreased as y increased. H. Arai et al.12 reported that Mn substitution could enhance the thermal stability of the material in the delithiated state. Mg substitution has been studied by C.C.Chang et al.,13 and this work showed that the introduction of Mg suppressed the multiple phase transitions observed in LiNiO2 during charge and discharge, and also improved the cycling performance as well as the thermal stability. Work by the group of Y. Ukyo et al. on Mg substituted into NCA14–16 showed that Mg substitutions helped to eliminate particle cracking and hence improved charge-discharge capacity retention. Many other substituents, such as Ti and Fe, were also studied by researchers over years.17–19 Although there have been many studies on substituting Ni in LiNiO2 with different cations, it is hard to make a head to head comparison among the different substituents because of different synthesis conditions and analysis procedures chosen by different researchers. With the increasing demand to reduce Co content and increase Ni content, it becomes important for researchers to go "back to basics" and systematically study the impact of different cation substitutions.
Early on in this work, it was found that the electrochemical properties of NCA with a composition of LiNi0.90Co0.05Al0.05O2, which were studied and reported in detail in a recent paper by J. Li et al.,20 were very close to those of LiNi0.95Al0.05O2 and LiNi0.95Mn0.05O2. Figure 1 shows the differential capacity versus voltage for Li/LiNi0.90Co0.05Al0.05O2, Li/LiNi0.95Al0.05O2 and Li/LiNi0.95Mn0.05O2 cells. Figure 1 suggests that at least the electrochemical properties of NCA (LiNi0.90Co0.05Al0.05O2) can be matched by materials without Co. If so, then why include Co? Figure 1 provided much of the motivation for this work and will hopefully serve to motivate readers to study this paper with care.
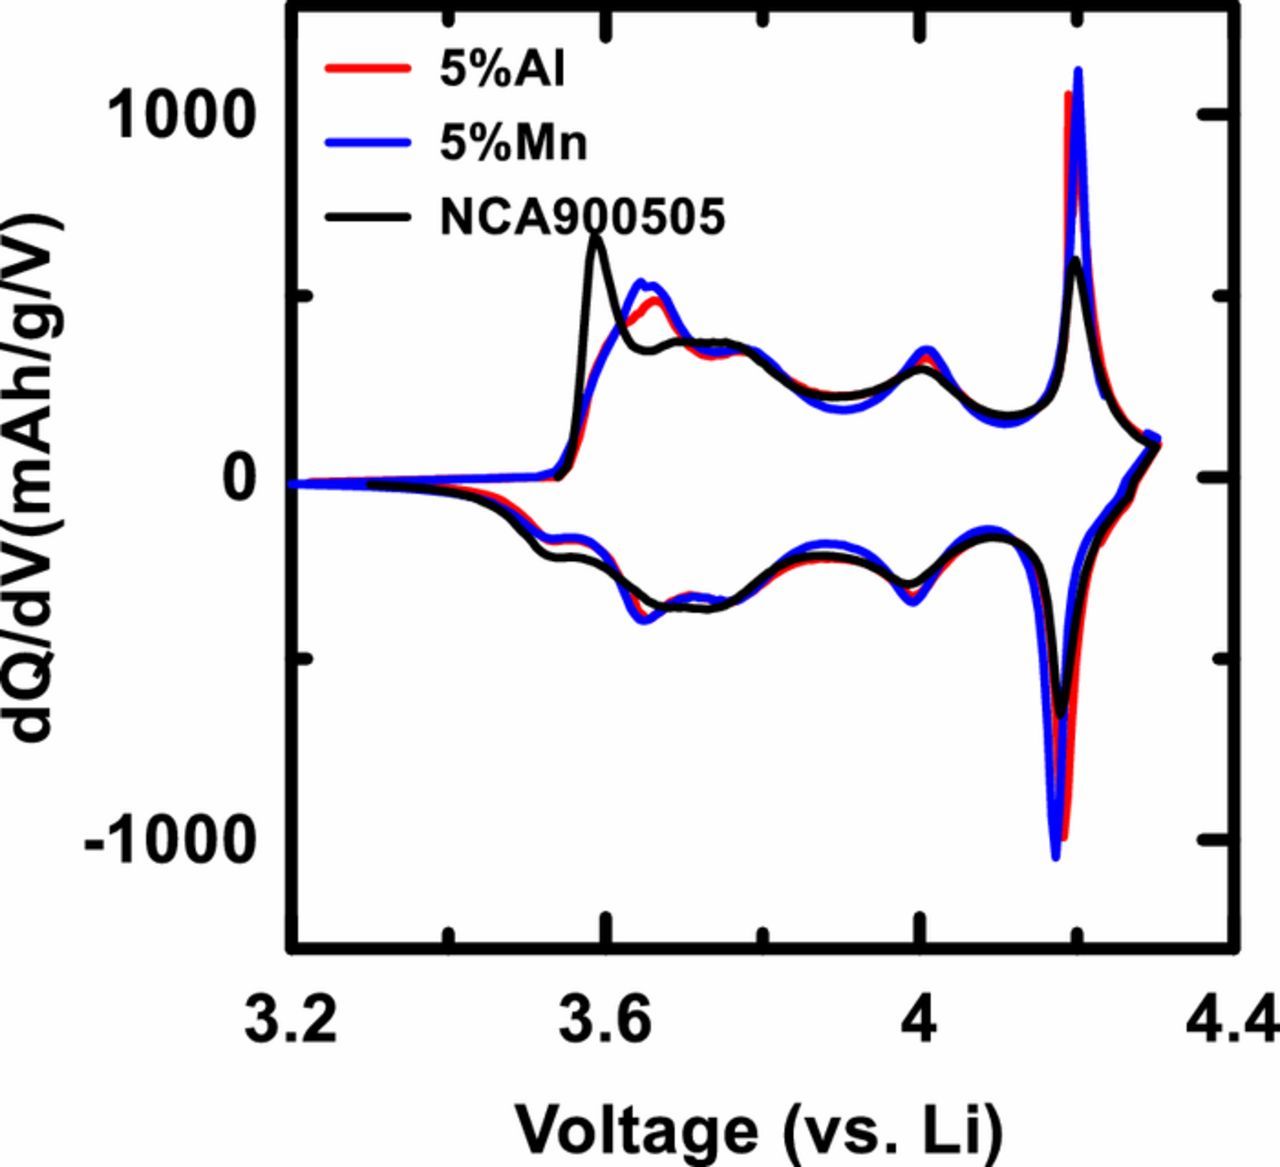
Figure 1. Differential capacity as a function of cell voltage (dQ/dV vs. V) for Li/LiNi0.90Co0.05Al0.05O2, Li/LiNi0.95Al0.05O2 and Li/LiNi0.95Mn0.05O2 cells. The cells were tested at C/20 and at 30°C.
In this paper, metals including Al, Co, Mn, and Mg, which are of great interest, were selected for investigations. Samples of LiNi1-nMnO2 (M = Al, Co, Mn or Mg, n = 0.05 or 0.1), as well as LiNi0.90Co0.05Al0.05O2, were synthesized and studied with differential capacity versus voltage (dQ/dV vs. V) methods. In-situ X-ray diffraction measurements were carried out on selected samples and the unit cell parameters and unit cell volume were carefully measured versus x in LixNi1-nMnO2. Using first-principles computations, the impacts of selected substituents were studied and a mechanism describing their function was proposed. Accelerating rate calorimetry testing was performed to evaluate the impact of different substituents on the thermal stability of charged positive electrode materials in electrolyte.
Experimental
Reagents used for the synthesis of LiNi1-nMnO2 included nickel (II) sulfate hexahydrate (NiSO4 • 6H2O, 98%, Alfa Aesar), manganese sulfate monohydrate (MnSO4 • H2O, 98%, Alfa Aesar), cobalt sulfate heptahydrate (CoSO4 • 7H2O, 98%, Alfa Aesar), Aluminum sulfate (Al2(SO4)3, 99.99%, Sigma-Aldrich), Magnesium sulfate (MgSO4, 99.5%, Sigma-Aldrich), sodium hydroxide (NaOH, 98%, Alfa Aesar), ammonium hydroxide (NH4OH, 28.0–30.0%, Sigma-Aldrich), LiOH • H2O (purity > 99.8%, FMC Corporation), and nickel aluminum hydroxide (Ni0.95Al0.05(OH)2) precursor provided by Guizhou Zoomwe Zhengyuan Advanced Material Co., Ltd. All aqueous solutions used in the precursor synthesis were prepared with deionized (DI) water which was de-aerated by boiling for 10 minutes. Reagents used for coin cells included 1:2 v/v ethylene carbonate: diethyl carbonate (EC:DEC, BASF, purity 99.99%), fluoroethylene carbonate (FEC. BASF, purity 99.94%), dimethyl carbonate (DMC, Shenzhen Capchem Technology Co., Ltd.), and lithium hexafluorophosphate (LiPF6, BASF, purity 99.9%, water content 14 ppm). For some comparative experiments, LiNi0.8Co0.15Al0.05O2 from EcoPro (Korea) was used.
Synthesis of LiNi1-nMnO2 (M = Al, Mn, or Mg, n = 0.05 or 0.1), LiNi0.95Co0.05O2 and LiNi0.9Co0.05Al0.05O2
Ni1-nMn(OH)2 (M = Co, Mn, or Mg, n = 0.05 or 0.1) precursors were made using co-precipitation in a continuously stirred tank reactor (CSTR) (Brunswick Scientific/Eppendorf BioFlo 310). More details of precursor synthesis have been reported by J. Li et al.21 Ni0.9Al0.1(OH)2 precursor was made using a modified co-precipitation method in CSTR, and more experimental details have been reported by A. Liu et al.22 Ni0.95Al0.05(OH)2 and Ni0.9Co0.05Al0.05(OH)2 precursors were provided by Zoomwe Zhengyuan Advanced Material Co., Ltd.
The Ni1-nMn(OH)2 and Ni0.9Co0.05Al0.05(OH)2 precursors were mixed thoroughly with a stoichiometric equivalent of LiOH•H2O by hand milling using a mortar and a pestle. Samples with a lithium/transition metal molar ratio (Li/TM ratio) of 1.02 were prepared. The mixed powders were preheated in oxygen in a tube furnace at 485°C for 3 hours. A heating rate of 10°C/min was used to increase the temperature to the set point. The preheated powders were taken out of the furnace and ground again by hand milling to minimize areas of local LiOH excess. The ground powders were then heated in the tube furnace (ø 5cm) under an oxygen flow of 60 sccm at 485°C for 2 hours, and then at 700°C for 20 hours for LiNi0.95M0.05O2 samples, and at 735°C for 20 hours for LiNi0.9M0.1O2 and LiNi0.9Co0.05Al0.05O2 samples. Our experience over many years suggests temperatures near 700°C are appropriate for materials with 95% Ni and temperatures near 735°C are appropriate for materials with 90% Ni. A heating rate of 10°C/min was used to change temperatures. The mass of materials synthesized in each batch was 5 g - 7.5 g.
Scanning electron microscopy imaging (SEM)
SEM imaging was conducted using a Nanosciences Phenom Pro G2 Desktop Scanning Electron Microscope with a backscattered electron detector. Samples were prepared by mounting the powders onto adhesive carbon tape. The images of samples were taken with an accelerating voltage of 5 kV and a current of 0.6 nA.
Powder X-ray diffraction (XRD) and In-situ XRD
Powder X-ray diffraction (XRD) was conducted to study the structure of the materials using a Siemens D5000 diffractometer equipped with a Cu target X-ray tube and a diffracted beam monochromator. Diffraction patterns were collected in the scattering angle (2θ) range of 15–70° at 0.02° intervals with a dwell time of 3 s. A 1° divergence slit, 1° anti-scattering slit and 0.2 mm receiving slit were used for the measurements. The collected XRD patterns were refined (Rietveld method) using "Rietica".23
The In-situ X-ray diffraction experiment was carried out with a Bruker D8 diffractometer equipped with a Cu target X-ray source and a diffracted beam monochromator. Measurements were conducted with a step size of 0.05° and a 10 second dwell time per step. The scattering angle (2θ) range was 17.5 - 68°. A 1 mm divergence slit, 1 mm anti-scattering slit and 0.2 mm receiving slit were used for the measurements. Diffraction patterns were refined (Rietveld method) using "GSAS".
Coin cells and in-situ coin cells
Synthesized LiNi1-nMnO2 positive electrode materials and the commercial LiNi0.8Co0.15Al0.05O2 material were mixed with polyvinylidene difluoride (PVDF) and Super-S carbon black having a mass ratio of 92:4:4 in N-methyl-2-pyrrolidone (NMP) to make slurry. Single side coated electrodes were made by casting the slurry onto aluminum foil with a 150 μm notch bar spreader. The electrodes were dried in oven at 120°C for 3 hours. Dried electrodes were then calendared at a pressure of 2000 atm. Coin cell electrodes were punched (1.2 cm in diameter) and further dried under vacuum at 120°C for 14 hours before coin cell fabrication. The loading of electrode material was 10–12 mg/cm2. The electrode fabrication procedure closely followed that described by Marks et al.24
Electrolyte with 1.0 M LiPF6 in EC:DEC (1:2 v/v) was used for collecting coin cell voltage vs. specific capacity profiles, dQ/dV vs. V measurements and in-situ X-ray diffraction experiment. Electrolyte with 1.0 M LiPF6 in FEC:DMC (1:4 v/v) was used for the half coin cell cycling tests as this electrolyte gives better long-term lithium metal cycling. Standard 2325 coin cells were assembled in an argon-filled glove box. Each coin cell had a positive electrode and a Li foil negative electrode with two layers of separators (Celgard #2300) in between. Galvanostatic charge/discharge cycling was conducted with E-one Moli Energy Canada battery testing systems.
The coin cell used for in-situ XRD used a beryllium X-ray window as the positive electrode current collector. The LiNi0.95M0.05O2 slurry was made as described above but less NMP was used to increase the slurry viscosity. The slurry was coated onto a 2 cm diameter beryllium disc with a 660 μm notch bar spreader and dried at 120°C for 2 hours. The coated beryllium disc was pressed at a pressure of 2000 kPa, and further dried under vacuum at 120°C for 14 hours before coin cell fabrication. The loading of electrode material was 20 - 25 mg/cm2. The coated beryllium disc was attached using Roscobond pressure sensitive adhesive to the positive electrode side of the cell case that had a pre-cut 1.5 cm diameter hole. After this, the remaining steps of in-situ coin cell fabrication were the same as described above for regular coin cells. The cell was cycled at a rate of ∼C/100 between 3.0–4.3 V for one cycle and 3.0 – 4.6 V for the second charge using an E-one Moli charger system, while diffraction patterns were collected.
Accelerating rate calorimetry (ARC)
Coin cells with pellet-type positive electrodes were made using the same method described in reference,25 using the same slurry composition as described for coin cells above. 1.2 M LiPF6 in EC:EMC (v/v 3:7) electrolyte was used for consistency to better compare with past results. Cells were charged to the same specific charge capacity of 230 mAh/g. After charging, the pellet cells were transferred to and opened in an Ar filled glove box carefully without shorting. The delithiated positive electrode powder was ground and then rinsed with DMC 4 times to remove the residual electrolyte. The rinsing process does not change the bulk structure or the reactivity of the delithiated electrode as reported by D.D. MacNeil et al.26 The powder was dried in vacuum for 24 h before being put into a stainless steel ARC tube along with fresh electrolyte (1.2 M LiPF6 in EC:EMC 3:7). For better comparison, the capacity of the charged positive electrode material in each ARC tube was fixed at 10 mAh and the amount of electrolyte included was around 28 mg. The starting temperature of the ARC experiment was set to 120°C and all the samples were tested under adiabatic conditions. Experiments ceased when the self-heating rate (SHR) exceeded 20°C/min or the temperature reached 250°C. Duplicate experiments were made to confirm the repeatability of the data.
Computational Framework
Computations were performed within the formalism of density functional theory (DFT) as implemented in the Vienna Ab-Initio Simulation package (VASP).27,28 The electron exchange and correlation (XC) was modeled with the Strongly Constrained and Appropriately Normed (SCAN) meta-generalized gradient approximation (meta-GGA) with dispersion correction (SCAN+rVV10)29 to account for the unscreened interaction between NiO2 layers in nearly fully delithiated material,30 which has been shown to be applicable for diversely bonded materials,31 and particularly for the purposes herein, applicable for ionic bonding. To perform computation on materials with low (∼11%) lithium content, 3 × 3 × 1 supercells were built starting from the hexagonal R-3m structure of LiNiO2 using lattice constants obtained from in-situ XRD for lithium content near 11% (this percentage corresponds to one Li per layer since a 3 × 3 × 1 supercell has 9 Li sites per layer and 1/9 sites are occupied). The substituent configurations were built by substituting a single Ni atom with a substituent atom (either Mg, Al, Mn, Co). Projector-Augmented Wave (PAW) datasets32 were used for Li, O, Ni, Mg, Al, Mn, Co containing 3, 6, 18, 10, 13, 15, 17 valence electrons respectively. The total ground state energies of various combinations of Li site occupations in the layers above and below the substituent atom were computed by optimizing all internal degrees of freedom. All total energies were tightly converged to < 1 meV per cell using a plane-wave energy cutoff of 600 eV and 4 × 4 × 2 Γ-centered k-point mesh.
Results and Discussion
To demonstrate that high quality samples were synthesized at Dalhousie, Figures S1 to S2 in the supplementary information show the original X-ray diffraction patterns of the samples studied here. Of particular note is the expanded view of the diffraction patterns between 20° and 35° where the strongest diffraction peaks from typical impurities such as Li2CO3 and Li5AlO4 appear. Figures S1 to S2 show that all samples are single phase and impurity-free except for LiNi0.9Al0.1O2, which has a small amount of Li5AlO4. As reported by J. Li et al.,20 the formation of Li5AlO4 is dependent on NCA elemental composition and it is prone to form in high Al content compositions. Figures S3a to S3e show SEM images of some of the synthesized materials as representatives of all the samples studied in this work. The SEM images show that all the samples made from precursors prepared at Dalhousie are spherical and dense with a typical secondary particle size of 10 μm. The samples of LiNi0.95Al0.05O2 and LiNi0.9Co0.05Al0.05O2 prepared from the commercial Ni0.95Al0.05(OH)2 and Ni0.9Co0.05Al0.05(OH)2 precursors, have a secondary particle size of 17 μm.
It has been thought that Co-doping reduces the Ni/Li interlayer mixing.7,8 But analysis of XRD patterns suggests that for Mn-free materials Co provides no benefit in reducing Ni/Li interlayer mixing. Figures 2a and 2b show the lattice constants, a and c, as a function the percent of Al, Mn, Mg, and Co substituents added. Samples with 2.5% Al, 2.5% Mg, 2.5 Mn, and 7.5% Al content were made for other studies but are included here for completeness. Table S1 shows the structural results from the X-ray profile refinements. Figure 2b shows that for the Al, Mn, and Mg substituents, the c lattice constant increased continuously with the amount of substituent. The a lattice constants of the Mn and Mg series increased as the substituent content increased, while for the Al series, the a lattice constant continuously decreased as the substituent content increased. Figure 2c shows the percentage of Ni atoms in the lithium layers. It is not surprising that with more Mn substituent, there were more Ni atoms in the lithium layers because of the presence of more Ni2+ to compensate Mn4+. Figure 2c and Table S1 show that even without Co, both the Al and Mg series demonstrated very low interlayer mixing, suggesting that Co is not required to eliminate Ni/Li mixing when there is no Mn in the structure.
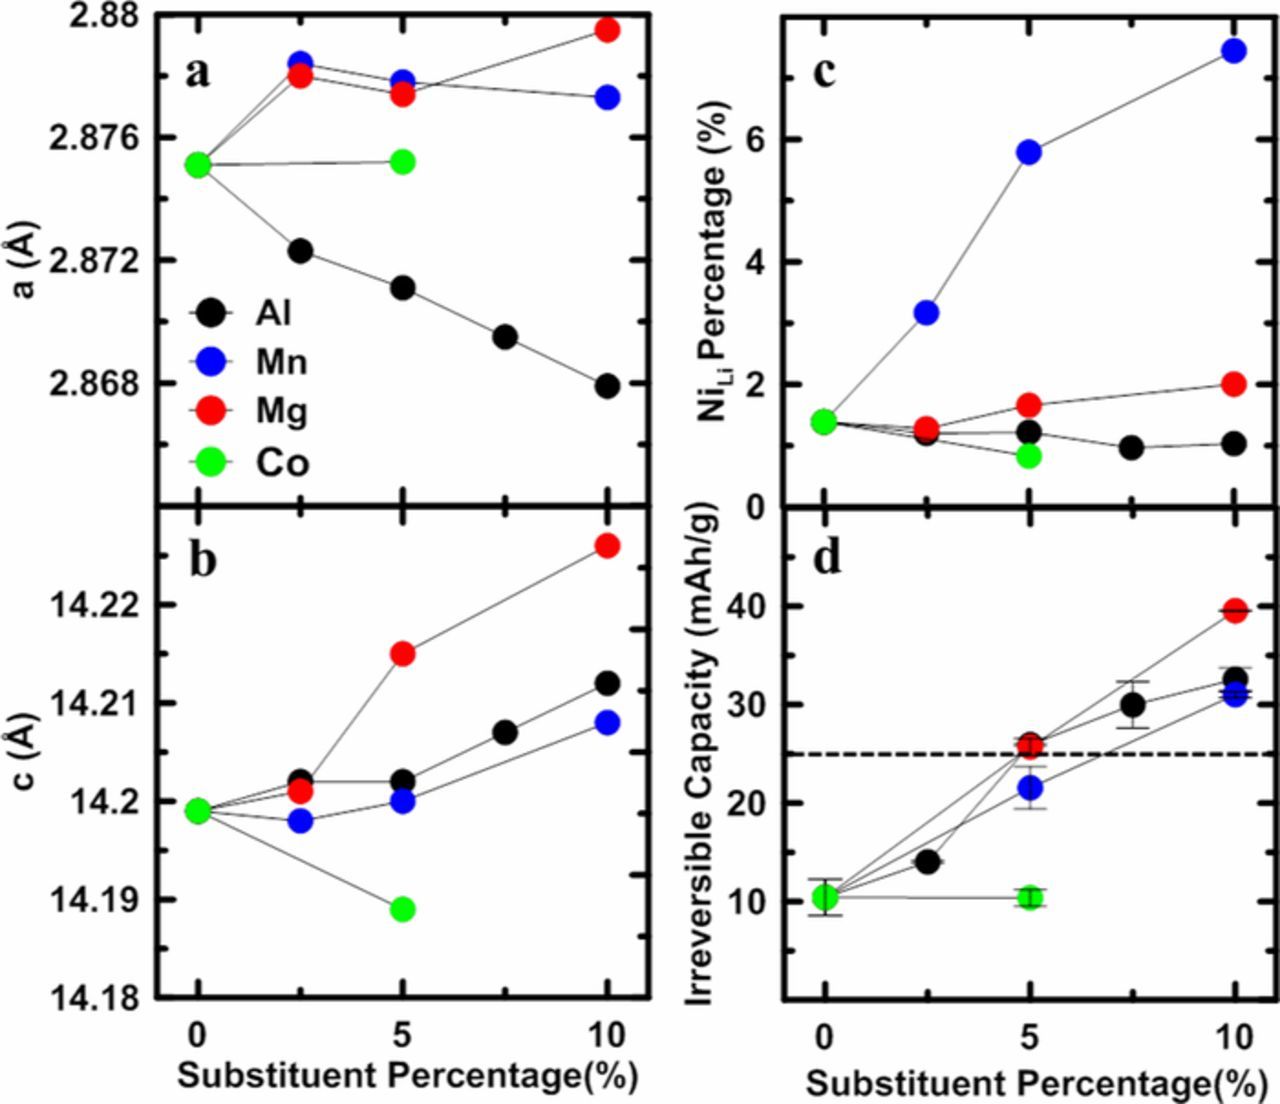
Figure 2. Unit cell constants a (a) and c (b) as a function of substituent percentage; the percentage of Ni/Li interlayer mixing as a function substituent percentage; (c); the irreversible capacity (IRC) as a function of substituent percentage (d). The horizontal dashed line in Figure 1d shows the irreversible capacity of LiNi0.95Co0.05Al0.05O2.
Figure 2d shows the irreversible capacity (IRC) of coin cells cycled at 30°C with a current density of 10 mA/g (∼C/20) between 3.0 - 4.3V. The IRC increases as the dopant content increases. The black dotted line shows the IRC of LiNi0.90Co0.05Al0.05O2 synthesized in this work, indicating that the LiNi0.95M0.05O2 (M = Al, Mn, Mg) materials do not have significantly different irreversible capacity compared to a typical NCA material with 5% Al content. (What is the purpose of the Co?) Table S2 summarizes the data for coin cells tested at 30°C and 55°C with a current density of 10 mA/g (∼C/20) between 3.0 and 4.3V. LiNi0.9Co0.05Al0.05O2 and LiNi0.9M0.1O2 (M = Al, Mn, or Mg) cells were cycled at both 30°C and 55°C. Table S2 shows that at elevated temperature, the IRC was reduced significantly. This suggests that the increase in IRC observed in Figure 2d is not due to irreversible structural changes during the 1st charge/discharge caused by the introduction of substituents, and is presumably related to a lithium diffusion hindrance.19
The following discussion addresses the possibility that Co doping may suppress the multiple phase transitions observed in LiNiO2 during charge and discharge.10 It is found that Co content up to at least 5% does not effectively suppress phase transitions during charge and discharge. Figures 3A–3E show the cell voltage as a function of specific capacity (V vs. Q) for LiNiO2, LiNi0.95Al0.05 O2, LiNi0.95Mn0.05O2, LiNi0.95Mg0.05O2, and LiNi0.95Co0.05O2, respectively. Figures 3a–3e show the corresponding differential capacity as a function of cell voltage (dQ/dV vs. V) for the 2nd charge and discharge. Solid and dashed lines represent two duplicate cells. The data in Figures 3A and 3a were reported by H. Li et al.10 where the multiple phase transitions of LiNiO2 during charge and discharge were discussed in detail. Four pairs of peaks have been circled in Figure 3a, and peaks i-iv represent the kinetic hindrance peak in the H1 phase, the H1-M phase transition peaks, the M-H2 phase transition peaks, and the H2-H3 phase transition peaks, respectively.10 Figures 3a and 3e show that both LiNiO2 and LiNi0.95Co0.05O2 have clear and intense dQ/dV peaks, while Figures 3b–3d show that with 5% Al, 5% Mn or 5% Mg substitutions, the peaks were diminished significantly, suggesting an effective suppression of the phase transitions observed in LiNiO2, as will be proved by in-situ XRD experiments discussed below. The insets in Figures 3b–3d show the dQ/dV vs. V curves with an expanded scale.

Figure 3. Cell voltage as a function of specific capacity (V vs. Q) of LiNiO2 (A), LiNi0.95Al0.05O2 (B), LiNi0.95Mn0.05O2 (C), LiNi0.95Mg0.05O2 (D), and LiNi0.95Co0.05O2 (E); Differential capacity as a function of cell voltage (dQ/dV vs. V) of 2nd charge and discharge of LiNiO2 (a), LiNi0.95Al0.05O2 (b), LiNi0.95Mn0.05O2 (c), LiNi0.95Mg0.05O2 (d), and LiNi0.95Co0.05O2 (e).
For LiNiO2, the kinetic hindrance peaks, which fall in the H1 single phase region, and the other three pairs of phase transition peaks are believed to be related to Li ion ordering and disordering.10,33 The significant "steps" in the voltage curve and the corresponding minima in dQ/dV vs. V are strong signatures of a composition where Li atoms are ordered.34 It is believed that with 5% Al, 5% Mn or 5% Mg substitutions, the lithium ordering can be suppressed. Figure 3e shows that compared with LiNiO2, the addition of 5% Co cations resulted in attenuated dQ/dV vs. V peaks, but the features associated with lithium ordering and ensuing phase transitions during charge and discharge are still quite distinct. Previous studies have shown that LiNi0.5Co0.5O2,9 LiNi0.8Co0.2O2,35 and LiNi0.7Co0.3O28 have smooth V vs. Q curves, and no phase transitions were observed. This suggests that unlike Al, Mn and Mg, Co does not effectively suppress phase transitions during charge/discharge until the content of Co is higher than at least 5% and probably higher. To further understand these observed phenomena, first-principles computations were performed and proposed phase transition suppression mechanisms will be discussed later below.
Figures 4A–4D show the V vs. Q curves of LiNi0.9Al0.1O2, LiNi0.9Mn0.1O2, LiNi0.9Mg0.1O2, and LiNi0.9Co0.05Al0.05O2, respectively. Figures 4a–4d show the corresponding dQ/dV vs. V curves of the 2nd charge and discharge in black lines. In Figures 4a and 4b, red lines show the dQ/dV vs. V curves of LiNi0.95Mg0.05O2. Solid and dashed lines represent two duplicate cells. Figures 4a, 4b, and 4c show that with 10% cation substitution, dQ/dV vs. V peaks were further attenuated compared to samples with 5% of substituent (see Figure 3). Especially in Figure 4c, for LiNi0.9Mg0.1O2, all the peaks that corresponded to phase transitions in LiNiO2 virtually disappeared. Figure 4d shows that with both 5% Co and 5% Al substituents, LiNi0.9Co0.05Al0.05O2 showed different dQ/dV vs. V features compared to LiNi0.95Co0.05O2, and that the distinct phase transition peaks diminish significantly due to the presence of Al, not Co. Figures 4a and 4b include the dQ/dV vs. V curves of LiNi0.95Mg0.05O2 in red, to illustrate that dQ/dV for a 5% Mg substitution is very similar to materials with 10% Al or 10% Mn. This is presumably due to a similar degree of lithium ion/vacancy ordering suppression, as will be addressed in the first-principles computation discussion later.
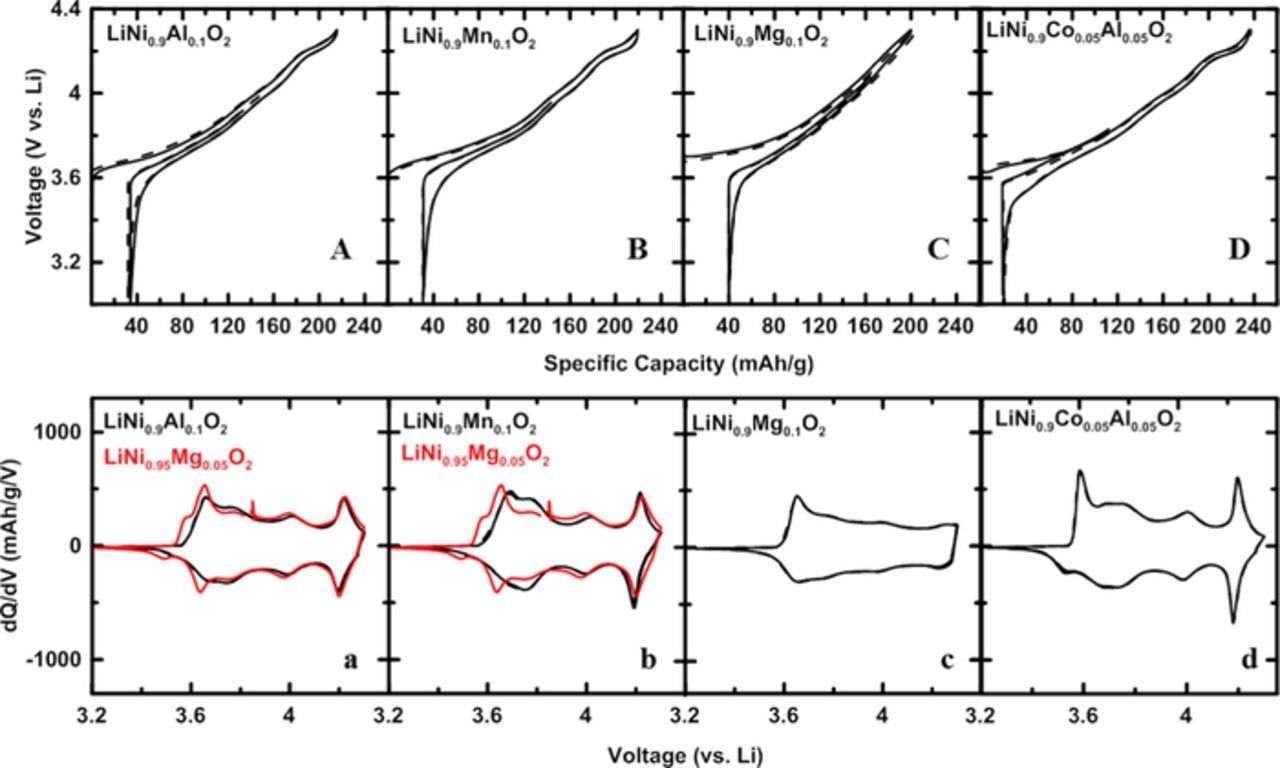
Figure 4. V vs. Q curves of LiNi0.9Al0.1O2 (A), LiNi0.9Mn0.1O2 (B), LiNi0.9Mg0.1O2 (C), and LiNi0.95Co0.05Al0.05O2 (D); dQ/dV vs. V curves of 2nd charge and discharge of LiNi0.9Al0.1O2 (a), LiNi0.9Mn0.1O2 (b), LiNi0.9Mg0.1O2 (c), and LiNi0.95Co0.05Al0.05O2 (d). The dQ/dV vs. V curves of LiNi0.95Mg0.05O2 were plotted in Figures (a) and (b) in red for comparison.
Figure 5 shows the results of in-situ X-ray diffraction experiments on LiNi0.95Al0.05O2, LiNi0.95Mn0.05O2, LiNi0.95Mg0.05O2, and LiNi0.9Co0.05Al0.05O2 cells. The XRD patterns are sequentially offset for clarity and are accompanied by the in-situ coin cell voltage-time profile which has been scaled so that each XRD pattern appears at the time, voltage and cycle number when it was collected. Figures 5a1, 5b1, 5c1, and 5d1 are aligned with the corresponding diffraction patterns, and show that the cell was first charged and discharged between 3.0 - 4.3 V for 1 cycle at a rate of ∼C/100, and then the cell was charged to 4.6 V at the same rate. Each XRD scan took exactly 2.803 hours. In the four sets of in situ XRD patterns, four selected scattering angle regions were shown. A peak from beryllium oxide was observed at 46°. Reference 10 shows that the in situ XRD patterns of LiNiO2 have very distinct features signaling multiple phase transitions during charge and discharge, which include the splitting of (101) and (104) Bragg peaks at ∼3.7V and the coexistence of two (003) Bragg peaks at high states of charge. Figure 5a2 shows that during charge, the (003) Bragg peaks continuously shifted to lower angle first, and then shifted to higher angle at the end of charge. Figures 5a3, 5a4, and 5a5 also show continuous peak shifting, and no splitting of peaks was observed. This suggests that for LiNi0.95Al0.05O2, a single phase structure was maintained during charge and discharge. Similar phenomena were also observed in the case of LiNi0.95Mn0.05O2, LiNi0.95Mg0.05O2, and LiNi0.9Co0.05Al0.05O2, and no phase transitions were observed during either charge or discharge. Figure S4 shows the results of in-situ XRD measurements on a LiNi0.95Co0.05O2 cell. The cell was charged from 3.0 V to 4.3 V at a rate of ∼C/100. Figure S4 shows that LixNi0.95Co0.05O2 has a very similar phase evolution behavior as LixNiO2.10 The splitting of the (101) and (104) Bragg peaks indicates the existence of the monoclinic distortion, and the phase transition from the H2 phase to H3 phase at the high state of charge was also captured. These in-situ XRD measurements correspond well to the dQ/dV vs. V measurements, and confirm that 5% Al, 5% Mn or 5% Mg can suppress the phase transitions exactly as in LiNi0.9Co0.05Al0.05O2, while 5% Co cannot eliminate the phase transitions. Figure S5 in supplementary information shows the large scale versions of the in-situ XRD results for readers that want to see the data more clearly.

Figure 5. In-situ XRD patterns and cell cycling profiles of LiNi0.95Al0.05O2 (a1–a5), LiNi0.95Mn0.05O2 (b1–b5), LiNi0.95Mg0.05O2 (c1–c5), and LiNi0.9Co0.05Al0.05O2 (d1–d5). In-situ XRD patterns of selected scattering angle regions of 18–21°, 36–40°, 43–51°, and 58–68° are shown. The cells were charged and discharged between 3.0–4.3 V at a rate of ∼C/100 for 1 cycle, and charged to 4.6 V at a rate of ∼C/100.
To understand the influence of substituents {Al, Mg, Mn, Co} on the voltage profiles (Figures 3 and 4) and in-situ XRD patterns (Figure 5), first-principles computations within the formalism of density functional theory were performed on structures corresponding to near top-of-charge. Starting from the hexagonal LiNiO2 unit cell, partially delithiated (1/9 remaining Li) structures were made by multiplying the unit cell 3 times along the a and b lattice vectors (3 × 3 × 1 supercell) while removing all but 1 Li atom per layer. For the cases with substituents, a single Ni atom was substituted by a substituent atom to give 1 substituent per 27 metal atoms or about 4%, close to the experimental compositions studied here. Panel (a) in Figure 6 shows a superposition of each of the 5 symmetrically distinct Li configurations considered; the black octahedron corresponds to the Ni site that was substituted by a substituent, the gray octahedra contain Ni atoms, the red spheres are O atoms, the yellow octahedra (labeled "E", for edge) are Li sites that are edge-sharing with the substituent site, the light green octahedra (labeled "V", for vertex) are Li sites that are vertex-sharing with the substituent site, the light blue octahedra (labeled "F", for far) are Li sites in the layers immediately above and below the substituent that are as far away from the substituent site as possible for a 3 × 3 × 1 supercell, and the dark blue (labelled "C", for constant) octahedron is a Li site two layers away from the substituent that remains fixed in all 5 configurations. Note that a given configuration consists of 1 Li atom in site "C", 1 Li atom in the layer below the substituent site (in either a "E", "V", or "F" site) and 1 Li atom in the layer above the substituent site (in either a "E", "V", or "F" site). This way configurations are labeled as ({E,V,F}, {E,V,F}, C) where {E, V, F} means "one of E, V, or F".

Figure 6. (a) Representation of possible Li sites between NiO2 layers. Ni atoms (gray octahedra) are 6-fold coordinated with O atoms (red spheres) and Li atoms can occupy octahedral sites between layers. The black octahedron contains either a substituent atom {Al, Mg, Mn, Co} or a Ni atom for the undoped case. The different colored and labeled octahedra correspond to different types of sites relative to the substituent site that can be occupied by Li: Edge-sharing (yellow, E), Vertex sharing (light green, V), Far away (light blue, F), and Constant (dark blue, C). (b) Relative energies for five symmetrically distinct lithium configurations. The x-axis labels correspond to a configuration of Li atoms consisting of one Li atom per layer. For example, (E,F,C) means that site E above the substituent, site F below the substituent, and site C are occupied by Li and all other sites are empty. Note that site C is occupied in every configuration.
Figure 6b shows the differences in total ground state energy for each configuration relative to configuration (F,F,C) corresponding to Li atoms and the substituent atom that are maximally separated in the plane of the a and b lattice vectors. It is important to note that energies are compared across the configuration space for a given substituent (or for pure LiNiO2) and not between different substituent types. This is why all energies are normalized to 0 eV for configuration (F,F,C). Now, an appreciation for energy difference values must be emphasized. Thermodynamically, free energy differences of 100 meV/atom are substantial barriers to phase transitions (equivalent temperature of 1160 K). For example, energies between 20–100 meV/f.u. above the convex hull are sufficient to motivate intercalant ordering at finite-temperature.36 Here, it is not the free energy difference between phases that are compared, rather the 0 K free energy (under the assumption that the pressure and volume changes are negligible for different configurations) between Li configurations. These energy differences translate into which Li configuration is thermodynamically preferred at a given Li concentration. Similar to thermodynamic phase transitions then, a difference of 100 meV represents a substantial preference for a particular configuration. The consequences of the energy differences between Li configurations presented in Figure 6b will now be discussed and connected to experimental observations.
The blue circles labelled "Ni" correspond to the undoped case. The lowest energy configuration by ∼210 meV is (F,F,C) where the Li atoms are maximally separated across layers. This implies a strong interlayer Li-Li repulsion – a necessary condition for phase transitions driven by Li ordering during charge and discharge cycling as discussed in Ref. 10.
The Mn-substituted case (labeled with green stars) exhibits similar behavior to the LiNiO2 case, however the energy differences for configurations farther away from (F,F,C) are shifted higher. This could lead to the conclusion that Mn doping would promote Li ordering but care must taken when interpreting these data: experimental dQ/dV (Figure 3) shows phase transition suppression when doping with Mn, while Figure 2c shows increasing Ni content in the Li layer with increasing Mn content, however no Ni was included in the Li layers for these computations. The shift to larger energy differences between the Mn-substituted case and the LiNiO2 case means that Mn prefers a local environment free of Li atoms (i.e. Mn4+ is preferred). In a lithium-rich environment, Ni2+ is required to balance charges leading to more Ni in the Li layers as shown in Figure 2c.37 Thus, both the phase transition suppression and capacity penalty observed in Figure 3c in the case of Mn substitution are attributed to the increased Ni-Li interlayer mixing where the Ni2+ ions in the Li layer hinder Li ordering while the Li atoms in the Ni layer cannot be de-intercalated and become inactive.
The Co-doped material (orange squares) presents two configurations, (F,F,C) and (V,F,C), with energies relatively close (∼30 meV) implying that a Li atom in the vicinity of a Co atom has two sites available without a large thermodynamic penalty. Even though the lowest energy configuration involves 1 vertex-sharing Li with Co, for sufficiently low Co content, Li order could be preserved by having some Li atoms around a Co atom adopt the (F,F,C) configuration. However, since the preferred Li sites will be lower in energy, the intercalation voltage is expected to increase slightly with a moderate capacity penalty, exactly as observed in the voltage profile of Figure 3e, and Table S2. Previous studies have shown that with 20% Co substitution, LiNi0.8Co0.2O2 shows no phase transition features in dQ/dV vs V,34 which suggests that a relatively large amount of Co substitution is required to block the lithium ordering in the lithium layer during charge and discharge. Figures 3e and 4d show that in high nickel content NCA materials like LiNi0.9Co0.05Al0.05O2, the phase transition suppression is not caused by the Co substituent, but instead by Al.
The local environment near a Al atom exhibits a relatively strong tendency for only one Li atom to occupy a vertex-sharing site as seen by the red triangles marking the (V,F,C) configuration. The implication relating to capacity penalty is that for every Al atom added to the material, one Li atom will be rendered inactive, thereby losing capacity relative to LiNiO2 equal to the percentage of Al. In addition, since the Al atoms are randomly distributed within the Ni layers, the inactive Li atoms will inhibit ordering and prevent phase transitions during intercalation. Both of these observations are clearly reflected in Figure 3b where the voltage profile is smoothed-out compared to LiNiO2 (phase transition suppression) and the capacity is reduced by ∼5% at top-of-charge Since each Al atom renders a single Li atom inactive, for sufficiently low Al content (maybe 1 or 2%), Li ordering could still occur and phase transitions would not be suppressed.
Lastly, the purple crosses in Figure 6 show that for Mg doping, there is a very strong preference (∼450 meV) toward the (V,V,C) configuration meaning that the Li atoms in the layers above and below the Mg atoms will sit in vertex-sharing sites. The capacity penalty should then be double that of Al as two Li atoms per Mg atom are rendered inactive. Figure 3D demonstrates this point as the top-of-charge capacity is ∼10% less than that of LiNiO2. Also, similar to Al, the observed suppression of phase transitions can be explained by the random placement of Mg atoms within the Ni layers and the inactive Li atoms destroying ordering. The strong thermodynamic preference for Mg to vertex-share two Li atoms, one in the layer above and one in the layer below, means that the Li-Li interlayer repulsion will be overcome in the local Mg environment. It is therefore expected that the Mg doped materials would suppress phase transitions at slightly lower concentrations than Al and Mn.
The arguments above can potentially explain why Figures 4a and 4b show that LiNi0.95Mg0.05O2 (Mg traps two Li atoms per Mg) has very similar dQ/dV vs. V features as LiNi0.9Al0.1O2 (Al traps one Li per Al) and LiNi0.9Mn0.1O2. In the case of Mn substitutions, it is the Ni in the Li layer that causes capacity loss and eliminates the phase transitions. It is very interesting that a 5% Mn substitution leads to approximately an additional 5% Ni in the Li layer compared to LiNiO2, while a 10% Mn substitution leads to only about 7% Ni in the Li layer. (See Figure 2c). Further work is needed to explain this non-linear behavior. In the case of small amounts of Al and Mg substitutions, simple oxidation state arguments can be used to also explain the loss in capacity observed as the amount of Al (cannot be oxidized, so expect 1 Li per Al in lost capacity) and Mg (cannot be oxidized and creates Ni4+, so expect two Li per Mg in lost capacity) increase. These arguments do not consider "oxygen redox",38 which would occur at higher potentials. Thus, it is appropriate to neglect oxygen redox in these simple oxidation state based arguments for cells charged to 4.3 V.
The question of whether the presence of Co in small concentrations brings any structural stabilization during charge and discharge cycles is now addressed. Figure S6 shows the profile refinement results of the in-situ XRD patterns accompanied by cell charge and discharge profiles. Figure S6a(1) shows the LiNi0.9Co0.05Al0.05O2 in-situ cell voltage as a function of specific capacity during the 1st charge (black line), 1st discharge (blue line), and 2nd charge (red line). Figure S6 a(2) - a(4) show the corresponding unit cell constant a, c, and unit cell volume as a function of specific capacity, respectively. Figures S6b, S6c, and S6d show the same sets of refinement results for LiNi0.95Al0.05O2, LiNi0.95Mn0.05O2, and LiNi0.95Mg0.05O2, respectively. Figures S6a(2) - S6d(2) show a similar phenomenon that the lattice constant, a, decreased continuously as lithium ions were deintercalated, and increased reversibly during lithium intercalation. Figures S6a(3) - S6d(3) show that for all the four samples, the c lattice constant increased initially as lithium ions were de-intercalated, and decreased dramatically at high state of charge. During the process of lithiation, the c lattice constant followed the same trend reversely. Figures S6a(4) - S6d(4) show that the unit cell volumes of the four samples also changed in a similar manner. The unit cell volumes decreased slowly during lithium de-intercalation and then shrank dramatically at highly state of charge because of the sudden decrease in the c lattice constant.
Figure 7 shows the normalized unit cell volumes of LiNiO2, LiNi0.95Al0.05O2, LiNi0.95Mn0.05O2, LiNi0.95Mg0.05O2 and LiNi0.90Co0.05Al0.05O2 plotted as a function of x in Li1-xMO2. The unit cell volume change of LiNiO2 was included from reference.10 The volume changes versus Li content for the Li1-xNi0.95M0.05O2 samples are almost exactly the same and match that of Li1-xNi0.90Co0.05Al0.05O2 suggesting there is nothing "special" that Co brings to the table in terms of "structural stabilization". The dashed line marks the place where the H3 phase, which has a smaller unit cell volume, forms in LiNiO2. This place is also the onset of the abrupt unit cell volume decrease for the substituted samples. Unlike LiNiO2, which shows the formation of the H3 phase at high states of charge due to complete removal of lithium atoms from lithium layers, the substituted samples experienced a more homogeneous lithium de-intercalation because of the sites in each lithium layer from which lithium cannot be removed as shown in Figure 6. This suppresses the formation of the H3 phase, and results in a continuous rapid contraction along the c-axis, instead. A single phase region with lattice constants that vary with lithium content is more resistant to particle cracking than a two phase region where the phases have quite different lattice constants.39

Figure 7. Normalized unit cell volumes of LiNiO2, LiNi0.9Co0.05Al0.05O2, LiNi0.95Al0.05O2, LiNi0.95Mn0.05O2, and LiNi0.95Mg0.05O2 as a function of lithium content x in Li1-xMO2.
Figure 8 shows the dQ/dV vs. V curves of LiNi0.95M0.05O2 and LiNi0.9M0.1O2 (M = Al, Mn or Mg) measured at different temperatures and C rates between 3.0 - 4.3 V. Data represented by black lines were measured at 30°C with a current density of 10 mA/g (∼C/20), data represented by red lines were measured at 30°C with a current density of 5 mA/g (∼C/40) and data represented by blue lines were measured at 55°C with a current density of 5 mA/g (∼C/40). Solid and dashed lines in the same color represent two duplicate cells. For all of the six compositions, the dQ/dV vs. V features between 3.6 V and 4.3 V remained unchanged at lower rates and higher temperature. However the pair (charge and discharge) of diminished kinetic hindrance peaks in the region of 3.4 - 3.6 V could be recovered at lower rates and higher temperature, and these peaks were marked with black circles in Figure 8. Figures 8b and 8e show that compared with Mg and Al, Mn substituted samples had a much more moderate recovery of kinetic hindrance peaks at slower rates and higher temperature. This is presumably because unlike Mg and Al, which have Li atoms in the lithium layers "bound" to substituent atoms in the transition metal layers, Mn substituted samples have inactive Ni atoms in lithium layers which will impede diffusion greatly. According to Van der Ven's divacancy model,40 diffusion will slow when there are no divacancies in the Li layer which will occur when the Li layer is almost full and also when states with ordered vacancies are formed. Even though the Al and Mg substituents suppress long range order, it is unlikely they suppress short range order and hence if the H1 phase in LiNiO2 is one where vacancies are ordered, one expects a similar degree of kinetic hindrance in the Al and Mg substituted samples.
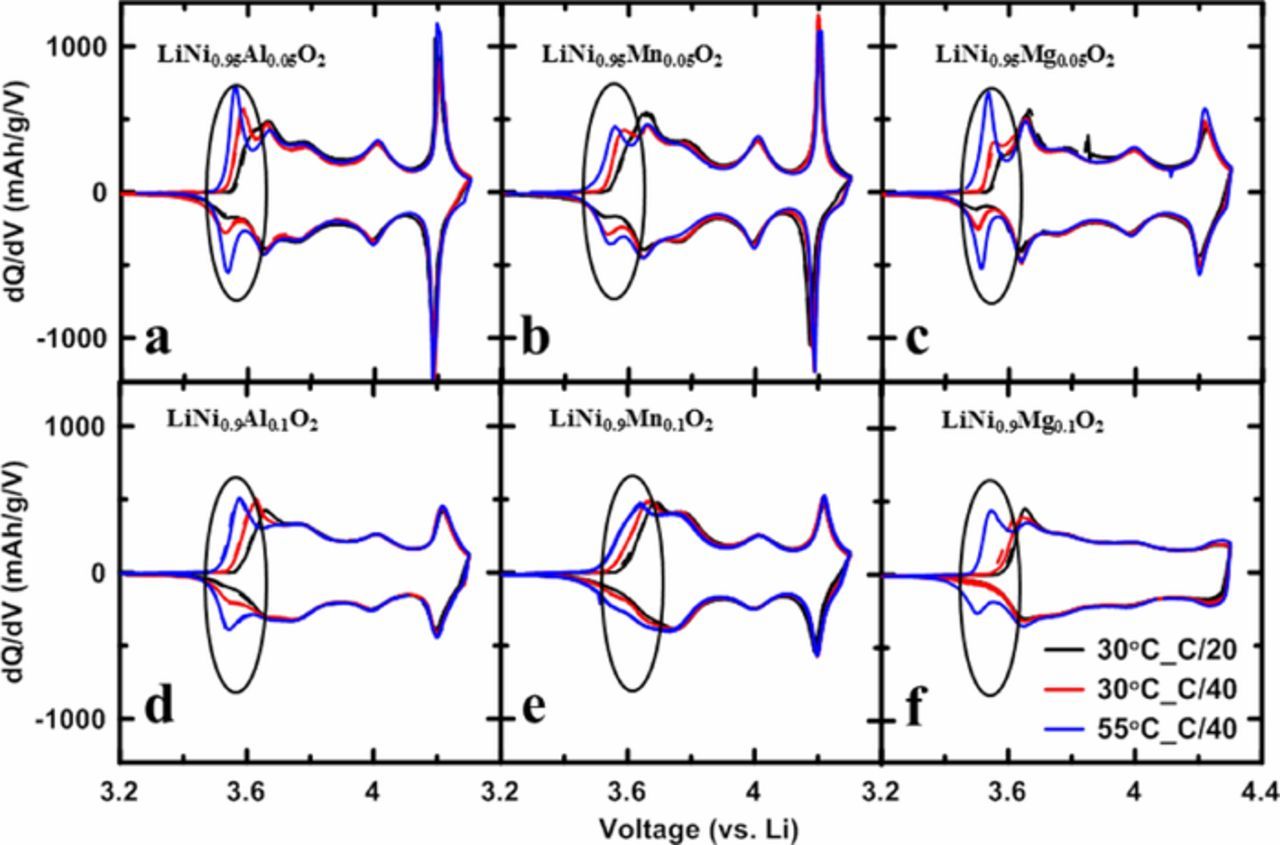
Figure 8. dQ/dV vs. V curves measured at different C rates and temperatures: LiNi0.95Al0.05O2 (a), LiNi0.95Mn0.05O2 (b), LiNi0.95Mg0.05O2 (c), LiNi0.9Al0.1O2 (d), LiNi0.9Mn0.1O2 (e), LiNi0.9Mg0.1O2 (f).
Figure 9a plots the 1st charge/discharge specific capacity as a function of substituent percentage. Coin cells were cycled at 30°C with a current density of 10 mA/g between 3.0 and 4.3 V. Black symbols, blue symbols, and red symbols represent the Al series, Mn series, and Mg series, respectively. Solid circles represent the 1st charge capacity, and triangular symbols represent the 1st discharge capacity. The black, blue and red solid lines are the predicted first charge capacity for the Al series, Mn series, and Mg series, respectively. As discussed in the previous sections, Al substitution results in a corresponding amount of inactive Li atoms that cannot de-intercalate. Based on this assumption, the 1st charge capacity of LixNi1-nAlnO2 (QAl) between 3.0 and 4.3 V should follow the equation:
where QLNO is the 1st charge capacity of LiNiO2 between 3.0 and 4.3V. Similarly, in LixNi1-nMgnO2, each Mg doping atom can "lock" two lithium atoms, so
For LixNi1-nMnnO2, the interlayer mixing between Ni and Li is thought to be the origin of capacity loss. Based on this,
where NiLi% is the fraction of Ni/Li cation mixing. Figure 9a shows that the theoretical lines agree well with the experimental data when the substituent percentage is relatively low but deviations can be observed when more than 5% of substituents were added. This indicates that the theoretical models proposed here are too simple. For example, these simple models do not take into account the changes to the delithiation/lithiation potential caused by the substituents. Figures 9b–9d show the 1st charge/discharge V vs. Q profiles of Li/LiNi0.95M0.05O2 (black lines) and Li/LiNi0.9M0.1O2 (red lines) cells. Solid and dashed lines in the same color represent two duplicate cells. It is clear that with more substituent, the lithiation and delithiation potential increases. More sophisticated models are needed to consider this.
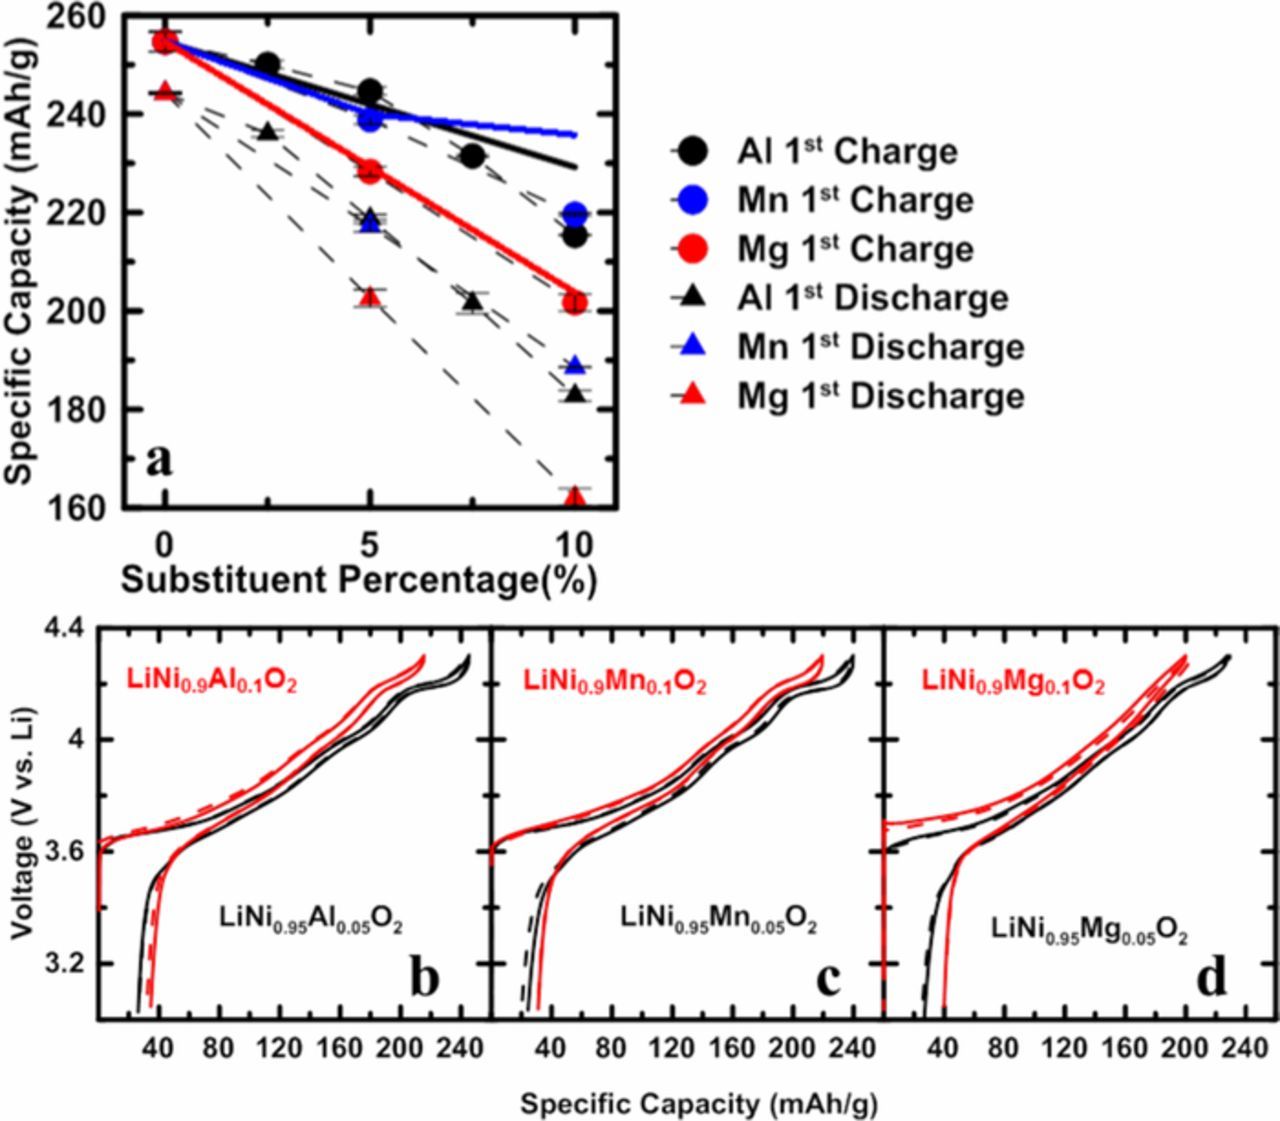
Figure 9. Specific 1st charge/discharge capacity as a function of substituent percentage of Al, Mn, and Mg series (a); 1st charge/discharge V vs Q curves of LiNi0.95Al0.05O2 and LiNi0.9Al0.1O2 (b), LiNi0.95Mn0.05O2 and LiNi0.9Mn0.1O2 (c), and LiNi0.95Mg0.05O2 and LiNi0.9Mg0.1O2 (d).
ARC results show that Co-doping brings negligible contribution to thermal stability while Al, Mg, and Mn -doping demonstrate substantial benefit. Figure 10 shows the ARC results for selected samples. Results for LiNiO2 (LNO), LiNi0.95Co0.05O2, (NiCo95/05), LiNi0.95Mg0.05O2 (NiMg95/05), LiNi0.95Al0.05O2 (NiAl95/05), and LiNi0.95Mn0.05O2 (NiMn95/05) are represented by black lines, green lines, magenta lines, blue lines and red lines, respectively. All positive electrode samples were delithiated to 230 mAh/g specific capacity before the ARC testing. It is clear that the self-heating rates of (SHR) of LiNiO2 and LiNi0.95Co0.05O2 increased rapidly above about 160°C, and the samples went into thermal runaway. However, the LiNi0.95Mg0.05O2, LiNi0.95Al0.05O2, and LiNi0.95Mn0.05O2 samples did not reach the ARC maximum SHR threshold of 20°C/min over the entire testing temperature range. ARC results strongly indicate that 5% Mg, 5% Al, or 5% Mn substitutions can effectively lower the reactivity of charged positive electrode powders with electrolyte, while the 5% Co substituent has little to no effect on the thermal stability of LNO.

Figure 10. Self-heating rate as a function of temperature for delithiated LiNiO2 and LiNi0.95M0.05O2 (M = Co, Mg, Al or Mn) electrode samples reacting with electrolyte in accelerating rate calorimeter experiments. All samples were delithiated to a delithiation specific capacity of 230 mAh/g.
Figure 11 shows specific capacity (a) and normalized capacity (b) as a function of cycle number for NCA 80/15/05 (LiNi0.8Co0.15Al0.05O2, obtained from Ecopro) and two selected "Co-free" samples, NA 95/05 (LiNi0.95Al0.05O2) and NMg 95/05 (LiNi0.95Mg0.05O2). Coin cells were cycled with a current density of 10 mA/g (∼C/20) for 2 cycles and then with a current density of 40 mA/g (∼C/5) for 50 cycles. NCA 80/15/05 was cycled between 3.0 – 4.4 V. NA 95/05 and NMg 95/05 were cycled between 3.0–4.3 V for 50 cycles, followed by another 50 cycles between 3.0 – 4.4 V. The comparison between NCA 80/15/05 and NA 95/05 shows that for the same specific capacity delivered, the additional 15% of Co provides little benefit to the capacity retention. With 5% Mg substitution, which as discussed above results in more inactive Li atoms, less specific capacity was accessed with a 4.3 V upper cutoff voltage and this material shows the best capacity retention. Figure 11 strongly suggests that Co is not required in materials with high Ni content (>90% Ni in the transition metal layer) in order to obtain acceptable capacity retention during cycling.

Figure 11. Specific capacity (a) and normalized capacity (b) as a function of cycle number for NCA 80/15/05 (LiNi0.8Co0.15Al0.05O2, obtained from Ecopro) and two selected "Co-free" samples, NA 95/05 (LiNi0.95Al0.05O2) and NMg 95/05 (LiNi0.95Mg0.05O2). Coin cells were cycled with a current density of 40 mA/g (∼C/5). NCA 80/15/05 was cycled between 3.0 – 4.4 V. NA 95/05 and NMg 95/05 were cycled between 3.0–4.3 V for 50 cycles, followed by another 50 cycles between 3.0 – 4.4 V. All testing was at 30°C.
Conclusions
In this work, positive electrode materials made by doping LiNiO2 with various amounts of Al, Mn, Mg, or Co were systematically investigated and compared to LiNi0.9Co0.05Al0.05O2 with electrochemical characterization, in-situ XRD, dQ/dV analysis and accelerating rate calorimetry. It was found that LiNi0.95Al0.05O2, LiNi0.95Mg0.05O2, LiNi0.95Co0.05O2 and LiNi0.9Co0.05Al0.05O2 all had very similar amounts of Ni in the Li layer (Table S1) suggesting Co is not required when the substituents Al and Mg are used. Just as in LiNi0.9Co0.05Al0.05O2, 5% Al, 5% Mn or 5% Mg cation substitutions in LiNi0.95M0.05O2 were found to suppress the multiple phase transitions observed in LiNiO2 during charge and discharge, while 5% Co in LiNi0.95Co0.05O2 did not. This suggests Co is unnecessary in these materials. 5% Al, 5% Mn or 5% Mg cation substitutions in LiNi0.95M0.05O2 reduced the reactivity of the charged electrode material with electrolyte. By contrast, 5% Co substitution did not significantly reduce reactivity with electrolyte at elevated temperature also suggesting Co is unnecessary in these materials.
The dQ/dV vs. V curves of Li/LiNi0.9Co0.05Al0.05O2 cells can be well matched by LiNi0.95Al0.05O2, LiNi0.95Mn0.05O2 and presumably by LiNi1-xMgxO2 with x near 0.025. The reversible and irreversible specific capacities of Li/LiNi0.9Co0.05Al0.05O2 cells can be well matched by LiNi0.95Al0.05O2, LiNi0.95Mn0.05O2 and presumably by LiNi1-xMgxO2 with x near 0.025. The structural changes in Li1-xNi0.9Co0.05Al0.05O2, Li1-xNi0.95Al0.05O2 and Li1-xNi0.95Mn0.05O2 and Li1-xNi0.95Mg0.05O2 with x are all virtually identical. All the relevant properties of NCA with high nickel content can be matched by materials with no cobalt.
Cycling tests for LiNi0.95Al0.05O2, LiNi0.95Mg0.05O2, and commercial LiNi0.8Co0.15Al0.05O2 showed that the 15% Co substitution in commercial NCA material did not improve capacity retention compared with Co-free LiNi0.95Al0.05O2. Long term charge-discharge cycle testing of commercial grade pouch cells was not included in the results presented here. Recent work by others has shown the strong impact of coatings and dopants on the capacity retention of Ni-rich materials.41,42 We are optimistic that with appropriate coatings or low levels of dopants at the surface, that LiNi1-xMxO2 materials of the type discussed here can be matched or exceeded by materials without cobalt.
With the first-principles computations within the formalism of density functional theory, a mechanism for how substituents function in LiNiO2 was proposed and shows good agreement with the experimental results. It is hoped that this work can help both industry and academia to understand how substituents work and why Co may not be necessary for Ni-rich positive electrode materials.
Acknowledgments
The authors thank NSERC and Tesla Canada for the funding of this work under the auspices of the Industrial Research Chairs program. The authors thank Yiqiao Wang, Shuo Yin and Haohan Wu of Zoomwe for providing some of the precursors used in this work. Hongyang Li thanks the Nova Scotia Graduate Scholarship program for financial support. Marc Cormier thanks NSERC for scholarship support. Ning Zhang thanks the China Scholarship Council for generous support. Julie Inglis thanks NSERC for support under the USRA program.
ORCID
J. R. Dahn 0000-0002-6997-2436