Performance models are powerful tools allowing developers to understand the behavior of their applications, and empower them to address performance issues already during the design or prototyping phase. Unfortunately, the difficulties of creating such models manually and the effort involved render performance modeling a topic limited to a relatively small community of experts. This article summarizes the results of the two projects Catwalk, which aimed to create tools that automate key activities of the performance modeling process, and ExtraPeak, which built upon the results of Catwalk and worked toward making this powerful methodology more flexible, streamlined and easy to use. The sew projects both provide accessible tools and methods that bring performance modeling to a wider audience of HPC application developers. Since its outcome represents the final state of the two projects, we expand to a greater extent on the results of ExtraPeak.
1 Introduction
High-performance computing (HPC) is a key technology of the twenty-first century. Numerous application examples, ranging from the improved understanding of matter to the discovery of new materials and from the study of biological processes to the analysis of social networks, give evidence of its tremendous potential. Mastery of this technology will decide not only on the economic competitiveness of a society but will ultimately influence everything that depends on it, including the society’s welfare and stability. Moreover, there is broad consensus that high-performance computing is indispensable to address major global challenges of humankind such as climate change and energy consumption. However, the demand for computing power needed to solve problems of such enormous complexity is almost insatiable. In their effort to answer this demand, supercomputer vendors work alongside computing centers to find good compromises between technical requirements, tight procurement and energy budgets, and market forces that dictate the prices of key components. The results are sophisticated architectures that combine unprecedented numbers of processor cores into a single coherent system, leveraging commodity parts or at least their designs to lower the costs where in agreement with design objectives.
Exploiting the full power of HPC systems has always been hard and is becoming even harder as the complexity and size of systems and applications continues to grow. On the other hand, already today the savings potential in terms of energy and CPU hours that application optimization can achieve is enormous [5]. As the number of available cores increases at tremendous speed, reaping this potential is becoming an economic and scientific obligation. For example, an exascale system with a power consumption of 20 MW (very optimistic estimate) and 5000 h of operation per year would—assuming an energy price of 0.1€ per kWh—produce an energy bill of 10 M€ per year.
Advertisement
Ever-growing application complexity across all domains, including but not limited to theoretical physics, fluid dynamics, or climate research, requires a continuous focus on performance to productively use the large-scale machines that are being procured. However, designing such large applications is a complex task demanding foresight since they require large time investments in development and verification and are therefore meant to be used for decades. Thus, it is important that the applications be efficient and potential bottlenecks are identified early in their design as well as throughout their whole life cycle. Continuous performance analysis starting in early stages of the development process is therefore an indispensable prerequisite to ensure early and sustained productivity.
Tuning an application means finding the sweet spot in its combined design and configuration space. Unfortunately, the sheer size of this space renders its exhaustive traversal via performance experiments prohibitive. In the absence of alternatives, many developers still rely on experiments, trying only a small and not necessarily representative subset of the available design and configuration options. Because of their limited view, they more than often overlook valuable optimization opportunities or miss latent performance limitations whose underlying trend they did not capture.
Performance models, in contrast, allow the design space to be explored much faster and much more thoroughly. Although often based on simplifying assumptions, they offer tremendous insight at the small cost of evaluating a formula. A model can be easily used to balance important trade-offs and adjust design parameters such that close to optimal performance is achieved. Such models allow problems in applications to be detected early on, long before they manifest themselves in production runs, and their severity to be determined when the cost of eliminating the problems is comparably small. If the problem is discovered later, dependencies between its source and the rest of the code that have grown over time can make remediation much harder. However, finding performance models is both hard and time consuming, which is why many developers shy away from it. Sometimes such models are simply built on inaccurate back-of-the-envelope calculations, rough estimates, simple and manual spreadsheet calculations, or even only developer intuition, which may be misleading.
An analytical performance model expresses the performance of an application in terms of a purely analytical expression [20, 27, 31]. A target metric m (e.g., execution time, energy, or number of floating-point operations) is represented as a function m = f(x1, …, xn) of one or more parameters xi (e.g., the number of cores or the size of the input problem). To make statements about application performance that can be relied on under changing conditions, it is usually not enough to focus on any single parameter in isolation. The effect that one varying parameter has on performance must be considered in the context of the variation of other relevant parameters, including algorithm options, tuning parameters such as tiling, or characteristics of the input data set. However, often it is not obvious which parameters are truly performance-relevant and should be included. In general, the decision whether to include a certain parameter or not has to trade off different criteria. Models with fewer parameters are easier to generate and maintain and provide more high-level insight, whereas models with more parameters can be more accurate because they consider more effects. Abstract application performance models with a reasonably small number of parameters can be designed and maintained by application developers while a system model can only be provided by system experts. Simpler models can be used as an interface to application developers and algorithm designers, while more complex models can be used for detailed tuning and projections. The task of modeling the performance of an application is rather complex and time-consuming though. This is why—in spite of its potential—it is rarely used in practice. However, with the help of automatic tools that support the creation of accurate performance models, this powerful methodology could spread across a much wider audience of HPC application developers.
Advertisement
This article summarizes the results of the Catwalk and ExtraPeak projects, which set out to improve this situation. The main goal of Catwalk, the first of the two projects, was to make performance modeling more attractive for a broader audience of HPC application developers by providing a method to create insightful performance models as automatically as possible, in a simple and intuitive way. Given the success of Catwalk, the follow-up project ExtraPeak aimed to improve upon the basic performance modeling method by allowing the models to include more than one parameter, while preserving the speed and accuracy of the original model generation process. Since ExtraPeak represents the more advanced state of our research and the outcome of Catwalk is already summarized elsewhere [47], we take the liberty of expanding mostly on the achievements of ExtraPeak. The two projects are part of a wider pioneering effort to construct performance models automatically in multiple application areas also beyond HPC, ranging from enterprise systems [7] to databases [15] and software product lines [40].
2 Overview of Contributions
Although we focus on the contributions of ExtraPeak, we start by offering a short overview of Catwalk and its achievements, given that the former builds upon the results of the latter. Figure 1 summarizes the accomplishments of both projects and their relationship to each other. Results from Catwalk are shown in hatched boxes while results from ExtraPeak are shown in solid boxes.
Fig. 1
Main contributions overview. Contributions in boxes with darker shades and solid fill represent work completed in the ExtraPeak project, whereas contributions in boxes with lighter shade and hatched fill represent contribution from the Catwalk project
×
2.1 Catwalk
The most important goal of Catwalk was to provide an automated method for constructing performance models. The focus was on the discovery of scalability bugs, achieved by creating models describing the performance of different parts of a program when scaled to larger processor configurations and demonstrated using several realistic applications, including Sweep3D, MILC, and HOMME [10]. The method is the foundation of the performance modeling tool Extra-P, a major outcome of Catwalk, which has been released under an open-source license. Extra-P enabled numerous application case studies to showcase the type of insights this analysis can provide, including UG4 [44], an unstructured-grid package, as well as several state-of-the-art MPI [37] and OpenMP implementations [24]. In Catwalk, we also worked on approaches leveraging the performance-modeling base method to allow new research avenues to be explored. The results include a scalability test framework that combines performance modeling with expectations to systematically validate the scalability of libraries [37], a tool that automatically instruments applications to generate performance models at runtime [4], and a fully static method to derive numbers of loop iterations from loops with affine loop guards and transfer functions that can be used to limit the performance model search space [22].
2.2 ExtraPeak
In ExtraPeak, we improved the basic modeling approach and expanded it to allow the analysis of multiple parameters simultaneously, automating the search space generation for models and even handling discontinuities in the model space. A continuous goal in the development of our methods was to ensure flexibility and ease of use. Our main accomplishments can be divided into three categories: new features for and improvements of the base method, advanced methods building upon it to explore new ways of expressing and understanding performance, and finally case studies leveraging Extra-P to gain insights into the performance of specific applications.
Base Methods
The extensions of the base method cover both multiple model parameters and a refined model search for a single parameter:
We extended the basic approach to allow insightful modeling of any combination of application execution parameters while using heuristics to decrease the time to find the best models quickly without compromising their quality [11].
We developed an algorithm to detect segmentation in a sequence of performance measurements and estimate the point where the behavior changes, allowing complex irregular behaviors to be modeled [23].
We designed a new model-generation algorithm by which the search space is built and automatically refined on demand relieving the user from the burden of search space selection [34].
Advanced Methods
The flexibility of Extra-P together with the width of models it can express and the insight they offer make it easy to tailor it to advanced tasks related to the exploration of multi-dimensional performance spaces:
Task-based programming offers an elegant way to express units of computation and the dependencies among them, making it easier to distribute the computational load evenly across multiple cores. We introduced an automated empirical method for finding the isoefficiency function of a task-based program, binding efficiency, core count, and the input size in one analytical expression. The insights gained via these expressions can be used to co-design programs and shared system resources [38].
In the co-design process, a fundamental aspect of the application requirements are the rates at which the demands for different resources grow as a code is scaled to a larger machine. We showed how automated performance modeling can be used to quickly predict application requirements for varying scales and problem sizes [12].
Case Studies
In ExtraPeak, we continued the series of case studies started in Catwalk, in which we confirm prior expectations or discover the existence of previously unknown scalability bottlenecks—often in collaboration with other research teams. Many of them were conducted when we extended our base methods or developed advanced methods and are described in the work cited above. In addition, we conducted further case studies with the sole aim of better understanding the performance of their application targets:
We helped validate the complexity of Relearn, a code that simulates structural plasticity in the brain. Inspired by hierarchical methods for solving n-body problems in particle physics, Relearn uses a scalable approximation algorithm with the complexity \(O(n \cdot \log {n})\), which can simulate the structural plasticity of up to 109 neurons—four orders of magnitude more than the naïve O(n2) version previously available [35].
We investigated two implementations of the LLL lattice basis reduction algorithm in the popular NTL and fplll libraries, which helps to assess the security of lattice-based cryptographic schemes, to validate their complexity in practical usage scenarios. This task reverses the perspective of classic HPC applications. In the field of cryptography, high algorithmic complexity is a desirable trait that characterizes the hardness of breaking certain security protocols [9].
We performed an analysis of parallel sorting algorithms and further MPI implementations using the framework for continuous scalability validation previously developed during the Catwalk project [39].
In the remainder of the article, we further describe the extensions of the base method as well as the advanced methods building upon it. Since this article focuses on advances in automatic performance modeling, we cover only case studies conducted alongside these developments, but do not include more details on the remaining ones listed above. For those, we refer the reader to the cited literature. The overview of our technological contributions is followed by a summary of ongoing developments in our project, a review of related approaches, and eventually a brief conclusion. However, because it is fundamental to everything we did in ExtraPeak, we first provide a short introduction to Extra-P, the tool whose development was started in Catwalk.
3 Extra-P
The key result of Catwalk has been a method to identify scalability bugs. A scalability bug is a part of the program whose scaling behavior is unintentionally poor, that is, much worse than expected. As computing hardware moves towards exascale, developers need early feedback on the scalability of their software design so that they can adapt it to the requirements of larger problem and machine sizes. In addition to searching for performance bugs, the models our tool produces also support projections that can be helpful when applying for the compute time needed to solve the next larger class of problems. For a detailed description, the reader may refer to Calotoiu et al. [10].
The usual input of our tool when used as a scalability bug detector is a set of performance measurements on different processor counts {p1, …, pmax} in the form of parallel profiles. As a rule of thumb, we use five or six different configurations. The output of our tool is a list of program regions, ranked by their predicted execution time at a chosen target scale or by their asymptotic execution time. We call these regions kernels because they define the code granularity at which we generate our models.
Model Generation
When generating performance models, we exploit the observation that they are usually composed of a finite number n of predefined terms, involving powers and logarithms of p:
This representation is, of course, not exhaustive, but works in most practical scenarios since it is a consequence of how most computer algorithms are designed. We call it the performance model normal form (PMNF). Moreover, our experience suggests that neither the sets \(I, J \subset \mathbb {Q}\) from which the exponents ik and jk are chosen nor the number of terms n have to be arbitrarily large or random to achieve a good fit. Thus, instead of deriving the models through reasoning, we only need to make reasonable choices for n, I, and J and then simply try all assignment options one by one. For example, a default we often use is n = 3, \(I =\left \{\frac {0}{2}, \frac {1}{2},\frac {2}{2},\frac {3}{2},\frac {4}{2},\frac {5}{2},\frac {6}{2}\right \}\), and J = {0, 1, 2}. A possible assignment of all ik and jk in a PMNF expression is called a model hypothesis. Trying all hypotheses one by one means that for each of them we find coefficients ck with optimal fit. Then we apply cross-validation to select the hypothesis with the best fit across all candidates. As an alternative to the number of processes p, our method can also support other model parameters such as the size of the input problem or other algorithmic parameters—as long as we vary only one parameter at a time.
Our tool models only behaviors found in the training data. We provide direct feedback information regarding the number of runs required to ensure statistical significance of the modeling process itself, but there is no automatic way of determining at what scale particular behaviors start manifesting themselves. This version of our method is most effective for regular problems with repetitive behavior, whereas irregular problems with strong and potentially non-deterministic dynamic effects require enhancements which we detail in Sect. 4.2.
Open Source Release
The Extra-P performance-modeling tool has been made available online under an open-source license.1 Users have access not only to the software but also to documentation material describing both our method and its implementation.2 We have been actively supporting the use of Extra-P at several organizations, among them the High Performance Computing Center Stuttgart, TU Darmstadt, Lawrence Livermore National Laboratory, FZ Jülich, and the University of Washington, just to name a few.
Figure 2 shows how the results of the model generator can be interactively explored. The GUI annotates each call path with a performance model. The formula represents a previously selected metric as a function of the number of processes, and allows other parameters to be represented as well. The user can select one or more call paths and plot their models on the right. In this way, the user can visually compare the scalability of different application kernels.
Fig. 2
Interactive exploration of performance models. The screen shot shows performance models generated for call paths in SWEEP3D, a neutron transport simulation
×
The profiles needed as input for the model generator are created in a series of performance experiments. To relieve the user from the burden of manually submitting large numbers of jobs and collating their results, we use the Jülich Benchmark Environment (JUBE) [26], a workflow manager developed at Forschungszentrum Jülich.
The tool was presented at multiple tutorials at conferences such as EuroMPI and Supercomputing, as well as at numerous VI-HPS and HKHLR tuning workshops. Following a 90-min theoretical explanation of the method and the tool, users were able to model the performance of two example applications, SWEEP3D and BLAST, in a 90-min practical session. Using previously prepared measurement data, they were able to generate models for the entire codes, evaluate the results, and understand the scaling behavior of the two applications. With this knowledge, attendees are able to apply Extra-P to their own applications, once the required performance measurements have been gathered. Because Extra-P is compatible with Score-P an established infrastructure for performance profiling, even collecting these measurements is straightforward.
4 Developments of the Base Methods
While the tool created during the Catwalk project is already widely used in the HPC community and provides meaningful insights to developers seeking to understand the performance of their codes, we have added significant new features during the ExtraPeak project which we detail below, most important among them the ability to model multiple parameters simultaneously.
4.1 Multi-Parameter Modeling
Common questions asked by developers when trying to understand the behavior of applications are:
How does application performance change when more processors are used?
How does application performance change when the problem size is increased or decreased?
When considering the pressure on applications to judiciously use computing resources both questions must be answered, and a new vital question arises:
Are the effects of processor variation and problem-size variation independent of each other or can they amplify each other?
For example, a weak-scaling run of the kernel SweepSolver in Kripke [28], a particle transport proxy application, has a runtime model for processor variation of t(p) = O(p1∕3) and a runtime model for varying the number of dimensions of t(d) = O(d). The number of dimensions influences the problem size proportionally. It now needs to be determined how these two factors play together. Depending on their interaction, the application is scalable or not. For example, it would make a huge difference whether the combined effect of processor variation and number of dimensions was t(p, d) = O(p1∕3 ⋅ d) or t(p, d) = O(p1∕3 + d).
We expanded the original performance model normal form presented in Sect. 3 to include multiple parameters.
This expanded normal form allows a number m of parameters to be combined in each of the n terms that are summed up to form the model. Each term allows each parameter xl to be represented through a combination of monomials and logarithms. The sets \(I, J \subset \mathbb {Q}\) from which the exponents \(i_{{k}_l}\) and \(j_{{k}_l}\), respectively, are chosen can be defined as in the one-parameter case.
Of course, if multiple parameters are considered, performance experiments have to be conducted for all combinations of parameter values and the total number of experiments that is required grows accordingly. While this might be manageable if the number of parameters considered is small enough and/or the cost of an individual experiment is very small, another and more serious problem emerges even for two and three parameters, namely the combinatorial explosion of the model search space.
Therefore, multi-parameter modeling was outside the reach of automatic methods due to the exponential growth of the model search space. We developed a new technique to traverse the search space rapidly and generate insightful performance models that enable a wide range of uses from performance predictions for balanced machine design to performance tuning. The details can be found in the work of Calotoiu et al. [11], but we present the most important heuristics here, together with a summary of the evaluation.
Hierarchical Search
The idea is to first obtain single parameter models for each individual parameter. Once we have these models, all that is left is to compare all additive and multiplicative options of combining said models into one multi-parameter model and to choose the one with the best fit.
The size of the search space for this approach is as follows, given m parameters and one n-term model for each of them. We must combine all subsets of terms of each single-parameter model with each subset of terms of each other single parameter model. The number of subsets of a set of n elements is 2n, so the total size of the search space is 2n⋅m.
Assuming there are three parameters, the single-parameter models for all of them have been computed and each model has three terms (the worst case scenario for search space cardinality in this case), the number of hypotheses that have to be tested is 23∗3 = 512. Adding the 3 times 25 steps needed to generate the single-parameter models, we will need to look at most at 587 models to find the best fit, compared to the 6.51 ⋅ 1014 in the unoptimized approach.
Evaluation
To evaluate the multi-parameter modeling approach we quantify the speedup of the model search in comparison to an exhaustive traversal of the same search space. Furthermore, we determine the frequency at which our heuristics lead to models that differ from the ones the exhaustive search produces. In those cases where the models we discover are different, we analyze these differences and discuss their impact on the quality of the results. Because traversing the entire search space for three or more parameters is prohibitively time consuming even with a very small number of potential terms, we allow only at most two model parameters for the purpose of this comparison.
The evaluation is divided into two parts. First, we examine how closely the models generated both through exhaustive search and with the help of heuristics resemble inputs derived from synthetically generated functions. This allows our results to be compared with a known optimal model. Second, we compare the results of both approaches, when applied to actual performance measurements of scientific codes, which factors in the effects of run-to-run variation.
Synthetic Data
We generated 100,000 test functions by instantiating our normal form from Eq. 1 with random coefficients. Our model generator responded in three different ways:
1.
Optimal models. The most common result (ca. 95%) is that the heuristically determined model, the model determined through an exhaustive search, and the known optimal model are identical.
2.
Lead-order term and its coefficient identified, smaller term not modeled by either method. In rare cases, neither modeling approach is capable of detecting the smaller term and they both only model the lead-order term. The effect on the quality of the resulting models is very small, and an attempt to model such small influences will often lead to noise being modeled instead.
3.
Lead-order term and its coefficient identified, smaller additive term only modeled by exhaustive search. In this case the heuristic approach fails to identify the parameter with a much smaller effect. The effect on the quality of the resulting model is again negligible.
Table 1 displays the number of times the modeling identified the entire function correctly and the times only the lead-order term was identified correctly. The lead-order term was correctly identified in all test cases. The difference in time required to obtain the 100,000 models is significant: 1.5 h when using the heuristics compared to 107 h when trying out all models.
Table 1
Evaluation of heuristics using synthetic functions
Application Measurements
In addition to synthetic data, we evaluated our heuristics with three scientific applications: Kripke, Cloverleaf, and BLAST. For BLAST we used two qualitatively different solvers and will therefore present separate results. Real data sets come with new challenges, such as not knowing the optimal model, and indeed no guarantees that the assumptions required for our method hold, namely that the optimal model is described by one and only one function and that the function is part of the search space. Figure 3 shows the results of both applying the heuristics and searching the entire solution space. As expected, in the overwhelming majority of cases the two approaches provide the same result (84%), or at least present the same lead-order term (14%). In about 2% of the cases the models differ. The reason is that noise and outliers occurring in real data sets are not limited to any arbitrary threshold compared to the effect of different parameters on performance. The projection used by the heuristics to generate single-parameter models out of multi-dimensional data reduces noisy behavior to a higher degree than the exhaustive search does. Therefore, in these rare cases, the heuristic approach results in models with a slower growth rate than the ones identified through an exhaustive search. The optimal model is not necessarily the one identified by the exhaustive search, as noise could be modeled alongside the parameter effects.
Fig. 3
Comparison of performance models obtained for all kernels of scientific applications using either our heuristics or a full traversal of the search space. For each application, we show the percentage of times where the resulting models were identical (left bar), where only the lead-order terms and their coefficients were the same (center bar), and where the lead-order terms were also different (right bar)
×
In all three cases, the model generation for an entire application took only seconds and was at least a hundred times faster than the exhaustive search. Generating performance models for an entire application means one model per call path and target metric. The search space reduction in all three cases was five orders of magnitude (from 4,250,070 model hypotheses down to 66 per call path and target metric).
Discussion
The evaluation with synthetic and real data demonstrates that our heuristics can offer results substantially faster than an exhaustive search—without significant drawbacks in terms of result quality. For three or more parameters, the size of the search space would have prevented such a comparison altogether, which also means that the exhaustive search presents no viable alternative beyond two parameters.
4.2 Segmented Modeling
Although our method is very powerful it struggles with the situation where performance data representing two or more different phenomena need to be combined into a single performance model, effectively being a function composed of multiple segments. This not only generates an inaccurate model for the given data, but can also either fail to point out existing scalability issues or create the appearance of such issues when none are present.
We have developed an algorithm to help Extra-P detect segmentation in the data before models are generated. Its input is a set of performance measurements, while the output indicates whether the given measurements show segmented behavior or not. If the data turns out to be segmented, the algorithm tries to identify the change point. With this information, Extra-P can generate separate models for each segment and/or request new measurements if any segment is too small for model generation. For more information, we refer the reader to Ilyas et al. [23].
Our method correctly identified segmentation in more than 80% of 5.2 million synthetic tests and confirmed expected segmentation in three application case studies. The results of this evaluation show that the proposed algorithm can be used as an effective way to find segmentation in performance data when creating empirical performance models. The suggested algorithm does not require any extra effort on the user’s side, and can work very well on as few as six points.
4.3 Iterative Search Space Refinement
While Extra-P strives to be easy to use and provide meaningful insights even to users without an extensive background in performance modeling, the version we developed in the Catwalk project still required the manual pre-configuration of the search space. This adds a layer of complexity to the modeling process, and requires the user to have an idea of what type of models can be expected from his application. Should the search space not include a model found in the code, the method will still try to approximate by selecting the one best fitting the data from the set of options available, but the result will be less accurate. Furthermore, noise in the data often leads to models that indicate a worse behavior than there actually is as sometimes a model in the search space fits not only the behavior we are trying to capture but also the noise, leading to overfitting. We have developed a new iterative model-generation approach, where we configure the search space on demand and iteratively raise the accuracy of the model until no meaningful improvement can be made. In this way, we increase both the ease of use for Extra-P and its range of application without sacrificing accuracy. For details, we refer the reader to the work by Reisert et al. [34]. In the following we show a summary of the results, showing the improvements that the new approach provides.
We used measurements from previous case studies to evaluate our new algorithm on measured data. The measurements include a variety of call paths (i.e., kernels) and different metrics, such as runtime, number of function calls, memory footprint, and network traffic.
The results of the comparison, which are presented in Table 2, show that, when the last (i.e., largest) measured data point is excluded from the data used to calculate the model, the model produced by our new algorithm allows for a better prediction of the last point in 19–65% of the cases, which corresponds to 53–85% of those models that changed in each benchmark. Although some predictions do get worse, the mean relative prediction error decreases across all applications, in all but one case even significantly.
Table 2
Comparison of the original and our improved algorithm, using data from previous case studies, showing the quality of predictions of the last data point when that point is not used for modeling
Not shown in the table is the number of models that are constant, which has considerably increased in every single case study (from 44 to 76% overall). Because the synthetic evaluation has shown that our new algorithm is able to recognize constant functions more reliably, this indicates that the previous algorithm might have modeled noise or tried to fit a PMNF function to inaccurate measurements.
With iterative refinement we remove the need for a predefined search space and also significantly reduce the number of false positives by being more resilient to noisy measurements of constant behavior. Most of the models generated with this new algorithm are able to make predictions that are equally or even more accurate than before. We therefore open the way for a performance modeling workflow that is more automated than ever and equips developers with a tool that helps them efficiently understand the performance of their applications.
5 Developments of the Advanced Methods
Extra-P is at its core a tool to generate a human-readable function out of a set of inputs. The flexibility it offers and the features we added over time made it attractive for uses beyond identifying performance bugs in parallel applications. Some approaches, such as the compilation and modeling framework by Bhattacharyya et al. [4], were developed during the Catwalk project. The scalability framework [37] was also developed during the Catwalk project, but we have further refined and expanded it during the ExtraPeak project, and also tested a number of parallel sorting algorithms using this framework [39]. Two research directions newly investigated during the ExtraPeak project are requirements engineering and iso-efficiency modeling, and are discussed below.
5.1 Lightweight Requirements Engineering
Co-designing applications and the system is a powerful technique to ensure early and sustained productivity as well as good system design, especially in high-performance computing where the cost of systems is very high and applications are expected to remain in use for long periods of time. In their early phases, such co-designs often rest on back-of-the-envelope (BOE) calculations. In general, such calculations allow problems in applications to be detected early on and their severity to be determined years before the machine is installed or the first prototype becomes available. This is increasingly important since mitigating such problems can often take several personyears. On the system side, BOE calculations allow designers to adjust system parameters to target applications, for example, they can be used to determine the required bytes-to-flop ratio of memory, network, or even the file system. In addition, they can be used to determine required memory sizes, usability of accelerators and co-processors, and even the number of sockets and size of shared-memory domains in the target system.
We automate these BOE calculations in a lightweight requirements analysis for scalable parallel applications. We introduce a minimal set of hardware-independent application-centric requirements that cover the most significant aspects of application behavior. Combining performance profiling [1, 8] and stack-distance sampling [3] with a lightweight automatic performance-modeling method [10, 11], we generate empirical models of these requirements that allow projections for different numbers of processes and problem sizes.
As the foundation of our approach, we define a very simple notion of requirements that supports their quantification in terms of the amount of data to be stored, processed, or transferred by an application. Knowing these numbers alone does not target a precise prediction of application runtime but can serve as an indicator of the relative importance of certain system resources and how this ratio changes as we scale a program to a larger system. Ultimately, our requirements are expressed in the form of empirical models that allow projections for different numbers of processes and problem sizes.
Application-Centric Requirements
We choose requirements to be purely application centric, that is, we do not make any assumption about the hardware other than the ability to run the code as is. Hence, all our requirement metrics refer to data flow at the interface between hard- and software—not between lower layers of the hardware. While specific hardware features could improve the rate at which the requirements are fulfilled, the classes of behavior our requirement models capture will not change. For example, even if revolutionary hardware features double the speed at which floating-point computations are performed, if the number of floating-point computations that need to be performed grows quadratically with the number or processes, while all other requirements remain constant, the floating-point requirement will remain the bottleneck for that particular application as it scales up.
Since it is currently the predominant programming model and also expected to be highly influential in the future, we stipulate that of each target application an MPI version exists. Application requirements are then expressed as a set of functions r(p, n) that predict the demand for resource r depending on the number of processes p and the problem size per process n. Because we regard thread-level concurrency merely as a way to satisfy the requirements, we consider requirements not below the granularity of processes, which may nevertheless be multithreaded—either locally or by launching GPU kernels.
Currently, we consider the requirement metrics listed in Table 3, classified by the resource they refer to. I/O would be handled analogously to the network communication requirement. None of our analyzed applications includes significant I/O traffic, we therefore refrain from including I/O metrics in this analysis. Our metrics characterize application requirements in terms of space (i.e., memory consumption) and “data metabolism” (i.e., bytes processed in floating-point units or exchanged via memory and network). Because the amount of data moved between processor and memory subsystem alone is barely a reliable indicator of the pressure an application exerts on the memory subsystem, we also consider memory access locality.
Table 3
Requirement metrics
Co-design
The key point of our method is to guide the programmer to find application bottlenecks relative to an architecture as well as to guide the architect to find system bottlenecks that a given application would experience. Our requirements models are functions of the number of MPI processes p and the input problem size n. To compare the requirements of an application on two different architectures, all we need to do is to calculate the application requirements using the values for p and n the application would use on these two systems. For details regarding the collection of requirement metrics and more detailed case-studies we refer the readers to Calotoiu et al. [12]. In the following we wish to present a brief example for the types of insights requirements modeling offers.
LULESH is a widely studied proxy application in DOE co-design efforts for exascale which calculates simplified 3D Lagrangian hydrodynamics on an unstructured mesh. The problem size per process is defined as the simulated volume per process. The growth rates of all requirements with respect to both problem size and process count are very close to ideal. With the current implementation, the multiplicative effect process count and problem size per process have on computation and communication for LULESH is a small obstacle in tailoring and scaling the application to run on different systems. The growth rates are slow enough to limit these issues at anything except the most extreme scales. Having introduced the per process requirement models, we can now showcase the workflow to evaluate a possible system upgrade taking account of these requirements. Let us consider the scenario where LULESH is working on a given system, but needs to be deployed to a larger system of the same type, for example one having twice the number or racks.
The requirements of LULESH are listed at the top of the table as part of Step I. Following this process, we can now draw conclusions regarding system utilization, requirements balance, and usefulness of a particular upgrade. The ratios between new and old problem sizes indicate how the largest problem size that can be solved changes, both per process and overall. The ratios between new and old requirements indicate which system components will experience an increased load relative to other components (Table 4).
Table 4
Per-process requirements models
The requirements of LULESH can be expressed as the product of single-parameter functions that either depend the problem size per process or the number of processes. When doubling the racks, only the value of p changes, and in this particular case, all terms depending on n can be reduced when determining the ratios of the changing requirements. This means that these ratios are valid regardless of the problem size per process. This will not generally be true as it depends on the specific relative upgrade. That the number of processes affects computation and communication means that these requirements increase slightly. Luckily, computation and communication only increase by 20% and will therefore allow LULESH to solve an overall problem twice as large with only a small performance degradation.
Discussion
The workflow we propose leverages these models to enable system designers and application developers to ponder various upgrade and design options. We characterize performance in terms of relative requirement changes—from one system or one application to another. This pattern indeed matches the common case, where an initial version of an application running on an initial system already exists. And even if no such system exists, our approach can successfully help compare design options. The main advantage of our approach in relation to architecture-specific performance models, which are traditionally hard and laborious to produce with high accuracy, however, is the small effort on the one hand and the low complexity of the models on the other, facilitating quick insights at low cost—easily at the scale of an entire compute-center workload (Table 5).
Table 5
Workflow for determining the requirements of LULESH after doubling the number of racks
5.2 Configuring and Understanding the Performance of Task-Based Applications
Task-based programming models, such as Cilk [6] or OpenMP [32], are well known and as the number of cores per node continues to increase, they gain more and more attention. One major advantage of task-based programming is that it allows parallelism to be expressed in terms of tasks, which are units of computation that can be either independent, dependent on a previous task, or a prerequisite to a subsequent task. Explicitly expressing parts of the code as tasks allows the compiler to take care of all the thread management intricacies, thereby sparing the user from tedious low-level details.
However, ensuring that that the problem to be solved is large enough to require a certain number of tasks is a difficult problem, and requires extensive analysis. The efficiency of the program will decrease as more processing elements are added. The only way to ensure that efficiency remains constant, as the number of cores increases, is to increase the input size as well. This concept is embodied in the iso-efficiency relation [17], which binds the number of processing elements (PEs) the application uses to the input size. It specifies by which factor the input size has to increase, with respect to the increase in the number of PEs, to maintain constant efficiency. Isoefficiency can be generalized to a two-parameter efficiency function that provides efficiency values as a function of both the PE count and the input size.
Although isoefficiency analysis is useful in understanding the scalability behavior of algorithms, it is not straightforward to apply and requires deep knowledge of the algorithm. In practice, however, task-based algorithms experience hardware limitations in the form of resource contention in general and memory contention in particular. Resources such as cache and memory controllers are limited and can negatively impact application scalability [46]. These might render theoretical isoefficiency functions not accurate enough to be used in practice. To be able to make informed decisions as to how big the input size should be in order to use all of the allocated cores efficiently, the user not only has to have a realistic isoefficiency model but also needs to understand the severity of resource contention at higher scales.
We proposed a novel practical method to automatically model the empirical efficiency functions of task-based applications [38]. Modeling the efficiency function allows us to easily derive an isoefficiency relation for any realistic target efficiency, and a carefully designed framework allows replays with different contention assumptions.
In our approach we identified three different efficiency functions for a task-based application:
1.
Eac(p, n): The actual efficiency function of the application, modeled after the empirical results of runtime benchmarks. In this case the application runs as it is and experiences contention. Therefore, this function reflects realistic application performance including resource contention and scheduling overhead.
2.
Ecf(p, n): The contention-free efficiency function, modeled after the results of replaying empty task skeletons according to the application’s task dependency graphs. The replay uses the same task dependency graphs and scheduling policy as in the original runs that were benchmarked to produce Eac(p, n). Since the replay is free of resource contention, this efficiency function reflects an ideal situation in which the application does not experience resource contention caused by threads accessing the same resource simultaneously.
3.
Eub(p, n): An upper bound on the efficiency of the application. Since efficiency is defined as \(\frac {S_{p}(n)}{p}\), an upper bound on the speedup also limits the efficiency. Considering the average parallelism π(n) for a problem size n, we determined that \(S_{p}(n) \le \min \{p, \pi (n)\}\), thus we define \(E_{ub}(p,n) = \min \{1, \frac {\pi (n)}{p}\}\). This function describes an ideal situation of maximum speedup that is hardly achievable in practice.
Beyond simply uncovering fundamental scalability limitations in an algorithm, we can provide insights into the impact of resource contention and determine what input size is required for any given degree of parallelism to reach a given efficiency. Further questions that our approach can answer are: What is the required core count for a given input size such that we maintain a constant, given efficiency? Which efficiency can we expect for a given number of cores and input size? Both questions are related to the co-design process when hardware designers have to understand how to make future systems suitable for both existing and future applications. Details regarding the approach and the framework required can be found in the work by Shudler et al. [38].
For an idea of the type of insights we provide, we show the summary of results for a number of task-based benchmark applications. Table 6 presents the efficiency models of the evaluated applications. There are 3 rows for each application listing the three efficiency models that we created (i.e., Eub(p, n), Eac(p, n), and Ecf(p, n)). In all the models the logarithms are binary. The rRMSE column is the relative root-mean-square error. It is a standard statistical factor that measures the relative differences between the observed data and the model, and is defined as: rRMSE \(= \sigma / \bar {y}\), where: \(\sigma = \sqrt {\sum _{i=1}^{n}(f(x_i) - y_i)^2 / n}\), yi are observed data, and \(\bar {y}\) is the mean of the yi values. The last column shows the input size n, derived from our models by letting the efficiency E be 0.8 and the core count p be 60.
Table 6
Efficiency models of the evaluated applications
All of the Eac(p, n) and Ecf(p, n) models follow the same pattern C − A ⋅ f(p) + B ⋅ f(p)g(n) that empirically emerged from our measurements. The interpretation of this pattern is that the first term, the constant C, is approximately 1 and it denotes the maximum attainable efficiency. The second term, − A ⋅ f(p), reflects the reduction in efficiency that occurs when we increase the core count. The last term, B ⋅ f(p)g(n), denotes the efficiency that we gain when we increase the input size. Together these terms reflect the interplay between the core count and the input size, and the effect it has on the efficiency. In the case of FFT, the constant B in the last term of Eac(p, n) is very small, which means that resource contention is a very significant factor and even large increases of the input size are not enough to offset the drop in the efficiency.
By analyzing the discrepancies between these efficiency functions, we are able to provide answers to questions regarding co-design aspects, the connection between poor scaling and resource contention, optimization potential, and the presence of scalability bugs.
Discussion
Our approach is viable for analyzing both the effects of resource contention on efficiency and further optimization potential. It provides users with an insight into whether the obstacle to scaling is resource contention or insufficient parallelism in the structure of the task dependency graph. In addition, users can also calculate the required input sizes to keep efficiency constant on a given core count. This approach can be used in co-design analysis to understand how many processing elements to put in a future machine, such that we can have high efficiency with realistic application input.
6 Ongoing Work
While Extra-P is already a powerful and versatile tool, we believe there are still some areas where we can improve and streamline our approach even more. Our efforts are currently focused on methods that would make it easier to consider multiple parameters in the performance modeling process. In the following, we briefly discuss two promising and so far unpublished approaches, one aiming to reduce the number of inputs the modeling algorithm requires to generate accurate multi-parameter models, and another targeting the use of compile-time information to identify relevant parameters and formulate expectations regarding their interaction, further reducing the need for measurements while improving the quality of the resulting models.
6.1 Reducing the Cost of Measurements with Sparse Modeling
We have shown how useful the performance models we generate can be to developers, but even though the modeling is done cheaply and automatically, we still require a series of small-scale experiments in order to start the process. Therefore, the experiment design determines the quality of the model as well as the overall cost of the modeling process. The current state of the art requires at least five different values for each parameter, and measurements with all possible combinations of values for all parameters considered. Therefore, an exponential number of samples is needed, namely 5n if n parameters are being modeled. For specific applications this makes it impractical to even create performance models. We are working on a novel parameter sampling approach that utilizes reinforcement learning, and leverages a sparse modeling technique, which only needs a polynomial number of samples and allows a more flexible experiment design.
We have made the observation that Extra-P assumes that there is one and only one behavior with respect to each parameter across the entire measured space. If this is true, the same function terms describing the effect of a given parameter should be identified no matter which sequence of five measurements is considered as long as the effect of all other parameters are kept constant. Rather than requiring all combinations of all values for each parameter, it could be sufficient to select a sequence of five measurements for each parameter to create single-parameter models, but a thorough analysis is required to ensure that lowering the number and cost of measurements is not detrimental to the quality of the results. When considering the interaction of parameters a new challenge arises: the binary decision of whether effect of any parameter pair is additive or multiplicative cannot be made with only a sequence of five measurements for each parameter. At least one additional data point is required, one that is not part of those sequences. In our evaluation, the addition of this one additional point improves the number of correctly identified models from 81.1 to 99.9%, while more data points only marginally improved the results.
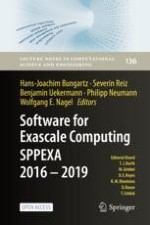
Figure 4 shows a set of measurements that is usually sufficient to correctly identify two-parameter performance models. Of course, any of the columns and rows could be used to generate the performance model. The question as to how to select which rows and columns to measure as well as which additional points to consider such that the best models can be generated with the smallest cost is still open. While selecting the combination with the smallest cost is appealing, we must quantify how the quality of the models degrades compared to other strategies. For this purpose, we leverage reinforcement learning to compare and evaluate different strategies.
Fig. 4
Example set of performance measurements for a two-parameter analysis. The filled circles represent a subset that is likely to be sufficient to create a performance model
×
Using this approach on some of our existing case studies shows very promising preliminary results: we were able to reduce the average modeling costs by up to 93% while maintaining 99% of the model accuracy. We are currently in the process of analyzing the limits of this approach and trying to define if there are any conditions required for it to be successful, or if it is a valid solution for most applications.
6.2 Taint Analysis for Many-Parameter Modeling
The current workflow of Extra-P follows three major steps: parameter identification, designing a set of experiments to measure the influence of changes in the parameters of interest, and estimating the best model from the provided data. A lot of work in Catwalk and ExtraPeak focused on automating and improving the third step in this process, leaving the user to still identify parameters of interest and choose which values to give these parameters for the subsequent measurements that will serve as input to Extra-P.
We are prototyping a tool called perf-taint to alleviate this issue. Perf-taint is an LLVM-based hybrid program analysis integrated with Extra-P that will supply program information to the modeling process. We use taint analysis [14], a computer security technique which reliably relates marked input values with the program parts they potentially affect to determine which parameters influence the performance critical control-flow in the program and detects functions that are constant with respect to selected performance parameters.
We have preliminary results using two benchmarks: LULESH and su3_rmd from the MILC suite. In LULESH, we consider three parameters and prune 303 out of 347 functions. In su3_rmd, we consider four parameters and prune 364 out of 621 functions. The instrumentation overhead is decreased 45 times in the case of LULESH compared to a full instrumentation. While these massive improvements in runtime overhead are likely specific to object-oriented C+ + applications, the quality of the resulting models is increased across all our experiments. We hope this approach will allow better models to be generated with even less effort even for large, complex applications where the importance of individual parameters is not necessarily well understood.
7 Related Work
Performance analysis and prediction of real-world application workloads is most important in high-performance computing. Performance tools such as Score-P [1] allow the programmer to observe the performance of real-world applications at impressive scales but are often limited to observations of the current configuration and do not provide insight into their behavior when being scaled further.
Such insights can be obtained with the help of analytical performance models, which have a long history. Early manual models showed to be very effective in describing application performance characteristics [27] and understanding complex behaviors [33]. Hoefler et al. established a simple six-step process to guide the (manual) creation of analytical performance models [21]. The resulting models lead to interesting insights into application behavior at scale and on unknown systems [2]. The six-step process formed the blueprint of our own approach.
Various automated performance modeling methods exist. Tools such as PALM [43] use extensive and detailed per-function measurements to build structural performance models of applications. The creation of structural models is also supported by dedicated languages such as Aspen [42]. These methods are powerful but require the prior manual annotation of the source code.
Hammer et al. combine static source-code analysis with cache-access simulations to create ECM and roofline models of steady-state loop kernels [19]. While their approach uses hardware information gathered on the target machine, it does not actually run the code but relies on static information instead. Lo et al. create roofline models for entire applications automatically and attempt to identify the optimal configuration to run an application on a given system [29]. Extra-P, in contrast, identifies scalability bugs in individual parts of an application rather than determining the optimal runtime configuration on a particular system.
Vuduc et al. propose a method of selecting the best implementation for a given algorithm by automatically generating a large number of candidates for a selected kernel and then choosing the one offering the best performance according to the results of an empirical search [45]. Our approach generates performance models for all kernels in a given application to channel the optimization efforts to where they will be most effective. Zaparanakus et al. analyze and group loops and repetitions in applications towards automatically creating performance profiles for sequential algorithms [49]. Goldsmith et al. use clustering and linear regression analysis to derive performance model coefficients from empirical measurements [16]. This approach requires the user to define either a linear or power law expectation for the performance model unlike the greater freedom offered by the performance model normal form defined in our approach. Jayakumar et al. predict runtimes of entire applications automatically using machine-learning approaches [25].
Zhai, Chen, and Zheng extrapolate single-node performance of applications with a known regular structure to complex parallel machines via simulation [50], but require the entire memory that would be needed at the target scale to correctly extrapolate performance. Wu and Müller [48] showed how to predict the communication behavior of stencil codes at larger scales by extrapolating their traces. While still requiring an SPMD-style parallel execution paradigm, Extra-P has proven to work with general OpenMP or MPI codes beyond pure stencil codes.
Carrington et al. introduced a model-based performance prediction framework for applications on different computers [13]. Marin and Mellor-Crummey utilize semi-automatically derived performance models to predict performance on different architectures [30]. Siegmund et al. analyze the interaction of different configuration options and model how this affects the performance of an application as a whole rather than looking at its individual components [18, 41].
Reducing the burden of collecting the measurements required for the empirical learning process is a research effort in its own right. Sarkar et al. [36] suggest a powerful sampling approach which can be used if all features of interest are boolean. Another approach for sampling highly configurable systems with boolean configuration options by Zhang et al. [51] suggests using the Fourier transform to select the best samples. However, these methods cannot be directly adapted to our use case: the features modeled by Extra-P are allowed a much wider range of expression. They can be not just boolean, but functions with polynomial and logarithmic terms.
8 Conclusion
In the Catwalk project, we initially set out to prove that automated performance modeling is feasible and that automatically generated models are accurate enough to identify scalability bugs. We started by showing that in those cases where hand-crafted models existed in the literature our models are competitive. Our interaction with many different users from different fields taught us that approximate models are acceptable as long as the effort to create them is low and they do not mislead. Furthermore, being able to produce many performance models cheaply helps drastically improve code coverage, which is as important as model accuracy. Having approximate models for all parts of the code can be more useful than having a model with 100% accuracy for just a tiny portion of the code or no model at all.
Finally, after the public release of the Extra-P software and numerous tutorials where Extra-P was introduced, we have seen growing interest from HPC application developers—whether for immediate use or in incorporating Extra-P in their own research. The continuous development of Extra-P during the ExtraPeak project was partly driven by feature requests from the users themselves, and while the collaboration uncovered many challenges, the results invariably proved useful beyond the problem they were specifically developed to solve: The capability of modeling the impact of multiple parameters simultaneously paved the way for complex approaches such as using application-centric requirements in the co-design process or determining the iso-efficiency of task-based parallel applications. We confidently claim that Extra-P is a powerful tool capable of providing insightful performance information for most developers while requiring only a modicum of experience in performance analysis and few resources.
Acknowledgements
This work has been funded by the German Research Foundation (DFG) and the Swiss National Science Foundation (SNF), primarily through the DFG Priority Programme 1648 Software for Exascale Computing (SPPEXA) and the ExtraPeak project (Grant Nr. WO 1589/8-1) but also through the DFG Program Performance Engineering for Scientific Software. It has received further support from the Federal Ministry of Education and Research BMBF under Grant No. 01IH16008, the Hessian LOEWE initiative within the Software-Factory 4.0 project, and the US Department of Energy under Grant No. DE-SC0015524. Calculations for this research were conducted on the Lichtenberg high performance computer of the TU Darmstadt, Vulcan at Lawrence Livermore National Laboratory, and SuperMUC at Leibniz Supercomputing Centre.
Open Access This chapter is licensed under the terms of the Creative Commons Attribution 4.0 International License (http://creativecommons.org/licenses/by/4.0/), which permits use, sharing, adaptation, distribution and reproduction in any medium or format, as long as you give appropriate credit to the original author(s) and the source, provide a link to the Creative Commons license and indicate if changes were made.
The images or other third party material in this chapter are included in the chapter's Creative Commons license, unless indicated otherwise in a credit line to the material. If material is not included in the chapter's Creative Commons license and your intended use is not permitted by statutory regulation or exceeds the permitted use, you will need to obtain permission directly from the copyright holder.