This article embarks on ethical trade-offs at the sustainability/finance interface by contrasting shareholders’ interest in short-term financial returns with society’s interest in counteracting ecological and social grievances. Scrutinizing share repurchases, we investigate a firm’s communicated sustainability orientation (i.e., its environmental and social value orientation) as well as its environmental and social sustainability performance. Our results are based on a large-scale panel dataset of 491 U.S. firms observed from 2004 to 2016. The dataset combines share buyback data with sustainability orientation scores from shareholder letters and sustainability performance ratings. The econometric models suggest no association between social value orientation and repurchase volumes, but a significantly negative relationship between environmental value orientation and buybacks in a cubic form. Executive stock options partially attenuate this relationship. Share repurchases in turn negatively affect future environmental and social performance. This study grasps the consequences of firms’ short-term shareholder satisfaction and discusses its ethical implications in the context of firms’ contribution to sustainable development, thereby providing important insights to the business ethics discourse.
Notes
Publisher's Note
Springer Nature remains neutral with regard to jurisdictional claims in published maps and institutional affiliations.
Introduction
Already in 2016, around 90% of CEOs worldwide claimed to be guided by sustainability motives (Unruh et al., 2016). Nevertheless, many of the world’s most valuable firms still underperform on environmental and social matters (Bansal & DesJardine, 2014; Kim et al., 2018). For instance, ExxonMobil—one of the largest carbon emitters globally—has long denied scientific evidence and cast doubt on anthropogenic climate change to avoid revising their fossil-fuel-centered business model (Johnston, 2017). In line with extant research (e.g., Sneirson, 2009), managers often justify their firms’ insufficient environmental and social sustainability performance with a duty to “make decisions that are in the best interests of the shareholders” (Smith, 1998, p. 278). While environmental and social interests are becoming increasingly relevant in shareholders’ investment decisions, the majority of investors still primarily pursue financial interests, that is, they aim to maximize the value of their holdings (Crifo et al., 2019; Hockerts & Moir, 2004).
During the last decade, U.S. firms listed in the S&P 500 have returned $4.3 trillion in value to shareholders by buying back their own shares from them (Lazonick et al., 2020). Share repurchases often increase earnings per share and stock prices, thus benefitting both managers and investors (Brav et al., 2005). From 2010 to 2017, ExxonMobil, for example, has paid out USD 91 billion to investors in the form of share repurchases.1 Repurchase spending in the U.S. surpasses dividends as well as capital expenditures and R&D expenses, which underlines its immense relevance to firms’ financial resource allocation (Fried & Wang, 2019; Wang, 2019; Wang et al., 2020). While academia is largely silent on the dark side of the buyback boom, practitioner voices criticize how it cannibalizes firms’ long-term prospects (Brettell et al., 2015; Das, 2016; Lazonick & Jacobson, 2019). To date, there does not appear to be published research focusing on share repurchases in the sustainability literature, perhaps because its properties are grounded in finance. Adding an ethical view to the debate, we inquire how the repurchase revolution relates to corporate sustainability, which yields important implications for ethical decision-making at the sustainability/finance interface. Following Martin et al., (2020, p. 595), we discuss the implications of corporate behavior based on the assumption that ethical behavior should be “fair and just” and excludes behaviors that favor the personal goals of an individual actor (e.g., shareholders) at the expense of many other stakeholders. In fact, firms that use share repurchases to drive short-term shareholder returns face trade-off decisions in their financial resource allocation, which could ultimately lead to a reduced budget for long-term environmental and social objectives (Kim et al., 2018). Precisely, budget shortages induced by share repurchases may have detrimental effects on the implementation of firms’ sustainability strategies, given that social and environmental projects are often costly and take time to pay off financially (Ameer & Othman, 2012; Bansal & DesJardine, 2014).
Advertisement
Against this backdrop, this study examines the role of share repurchases in relation to corporate sustainability. In terms of both theory and analysis, it is crucial to distinguish between communicated corporate sustainability strategies (i.e., sustainability orientation) and actual corporate sustainability performance (Covin & Wales, 2018). Therefore, this study investigates (1) how communicated environmental and social sustainability orientation influence firms’ share repurchase behavior and (2) how share repurchases, in turn, influence actual environmental and social sustainability performance. Moreover, it is important to consider individual-level factors that affect executives’ decision-making as they face the choice between share repurchases and sustainability investments. Research shows that share repurchases can be used to maximize executives’ variable compensation, such as stock options and earnings-based bonuses (Kahle, 2002; Kim & Ng, 2018). Hence, executives might benefit from adverse behavior. We thus further investigate the moderating effect of executives’ stock option volumes on the link between sustainability orientation and share repurchases.
With a dataset comprising 491 U.S. firms listed in the Standard & Poor’s 500 index and observations over a period from 2004 to 2016, we first examine the influence that firms’ orientation toward environmental and social sustainability has on their share repurchase behavior. We measured firms’ environmental and social sustainability orientation by analyzing their letters to shareholders (LTS). Share repurchase data were gathered manually from company filings. Second, we explore the moderating effect of stock-based executive incentives in that context. We then move on to analyze how share repurchases relate to actual corporate environmental and social sustainability performance. Sustainability performance ratings stem from the MSCI KLD database.
This study offers valuable theoretical and practical insights into the sustainability/finance interface and its ethical considerations. First, this study explores ethical trade-offs in the corporate sustainability realm. We observe that firms with extensive share repurchases show a lower environmental and social sustainability performance in subsequent years. Our findings demonstrate that from a normative perspective, firms’ adherence to the concept of corporate sustainability is questionable if firms balance the competing but interrelated sustainability objectives in favor of short-term distributions to shareholders as opposed to investments in long-term environmental and social projects. Hence, we direct the attention of sustainability scholars toward repurchases as a practice that may impede corporate sustainable development. Second, this article reassesses the importance of shareholders as stakeholders in the corporate sustainability domain. Crane et al., (2019, p. 274) emphasize that “in business ethics texts, shareholders are normally a somewhat neglected species.” Our paper addresses this gap and introduces the role share repurchases—the dominant financial payout instrument to serve shareholders’ interest—play for firms’ sustainability activities. We create new narratives for the literature on corporate sustainability and highlight interdependencies: firms have to manage both the intergenerational justice of sustainability and their fiduciary responsibilities toward shareholders. Third, our study introduces the moderating role executives’ vested stock options play in the relationship of strategic sustainability orientations and share repurchases. We argue that even in sustainability-oriented firms, managerial compensation incentives should be designed in a way that limits trade-offs between corporate long-term goals and managers’ strive for short-term payoff (Sanders & Carpenter, 2003). In sum, the proposed research agenda revisits our understanding of shareholders’ role for corporate sustainability as well as of the ethical trade-offs between short-term and long-term investments and their effect on sustainable development.
Conceptual Background and Hypotheses
Corporate Sustainability
The concept of sustainability helps detangle the complex relationships between economics, society, and environment (Bansal & Song, 2017). Past research has extensively examined sustainability on a corporate level, but it is still difficult to arrive at a definition covering nearly all of its facets (Montiel & Delgado-Ceballos, 2014). As Meuer et al. recently (2019, p. 12) suggested, we leniently define corporate sustainability as “a firm’s attempt to respond to environmental and social issues”. Focusing on the social and environmental aspects of corporate sustainability allows us to assess the association of both dimensions with an instrument commonly used to drive the third dimension of the triple bottom line (i.e., economic benefits): share repurchases (Sanders & Carpenter, 2003). This definitional focus also enables a discussion on the ethically sound trade-off decisions firms make when striving to meet both shareholders’ interest in short-term financial returns and society’s interest in counteracting ecological and social grievances. Multiple studies already reveal a positive link between firms’ responses to environmental and social issues and long-term economic performance (e.g., Gao & Bansal, 2013). Share repurchases often aim at driving short-term economic benefits and hence may threaten investments in long-term social and environmental measures.
Advertisement
From a methodological perspective, the manifestations of corporate sustainability are diverse (Antolín-López et al., 2016). In this paper, we focus on the operationalization of corporate sustainability in terms of firms’ communicated strategic sustainability orientation and firms’ actual sustainability performance. The former determines firms’ aims and strategy, while the latter is based on concrete accounting and reporting (Crane et al., 2019). Definitions of sustainability orientation generally agree that it describes the integration of sustainability principles into corporate strategy (Claudy et al., 2016; Roxas & Coetzer, 2012). Firms thus strive to adopt sustainability as a core purpose: the pursuit of socially and environmentally responsible activities becomes a strategic guideline (Gao & Bansal, 2013; Hahn et al., 2015). Extant research assesses firms’ sustainability orientation by scrutinizing related narratives in their corporate communications (Moss et al., 2018). With respect to actual corporate sustainability performance, a variety of stakeholders—academics, investment rating agencies, and multilateral or non-governmental organizations—have developed several measuring instruments (Cubas-Díaz et al., 2017).2 In line with the contextual focus of our study (i.e., share repurchases), we understand the measurement of firms’ actual sustainability performance as an attempt to translate corporate sustainability into investors’ language of traditional financial accounting (Cubas-Díaz et al., 2017). We hence measure sustainability performance based on recent developments in the space of sustainability ratings.3
Within the business ethics discourse, scholars investigate the phenomenon of corporate sustainability to reveal what organizations actually do; but also what they normatively could or even should do to advance sustainable development (Hahn et al., 2018). In practice, there is a variety of obstacles that hinder firms’ implementation of corporate sustainability. Sustainability initiatives are often costly and involve high uncertainty about the level and timing of financial returns (Bansal & DesJardine, 2014; Hahn et al., 2015), not least due to the intangible nature of some of the benefits, including reputational gain (Axjonow et al., 2018). Findings on long-term shareholder returns generated by sustainability remain inconsistent and vary by type of engagement (Hillman & Keim, 2001; Khan et al., 2016; McWilliams & Siegel, 2000). Investors favor tangible and secure returns, and this preference may impede corporate sustainability (Ameer & Othman, 2012). Beyond financial considerations, firms are dependent on executives with a cognitive frame that allows them to adopt to sustainability issues (Hahn et al., 2014). In conclusion, implementing corporate sustainability is subject to a variety of challenges that may divert financial resources toward alternative purposes—such as maximizing shareholder returns through buyback programs.
Share Repurchases
Share repurchases are an instrument used to distribute returns to investors (Vermaelen, 2005). Furthermore, by buying back shares, companies can reduce the number of shares to which their earnings are allotted without affecting earnings themselves (Grullon & Michaely, 2004). Increased earnings per share typically result in higher stock prices, from which both remaining shareholders and selling ones benefit (Hribar et al., 2006). Other prominent motivations for share repurchases include meeting earnings forecasts (Farrell et al., 2014; Fos et al., 2016), signaling a positive financial outlook, increasing stock liquidity (Busch & Obernberger, 2017; Hillert et al., 2016) and making use of excess liquidity to avoid potential overinvestment (Jensen, 1986). Investors often react more favorably to share repurchases than to dividends as they represent extraordinary payouts; moreover, they allow deferring the taxation of capital gains in the U.S. (Skinner, 2008). Buybacks have hence surpassed dividends as the dominant U.S. payout instrument (Standard & Poor’s, 2019).
Since 2007, S&P 500 firms have consistently spent more than 50% of net income on share repurchases, making them one of their major use of funds (Lazonick, 2018). Observations like these raised doubts on the long-standing academic consensus that companies would first serve investment needs and then decide upon distribution to shareholders (Grullon & Michaely, 2004; Jensen, 1986). In fact, scholars find reduced investment activities accompanied by share repurchases (Bendig et al., 2018; Fos et al., 2016). The substantial amount of means firms use for buyback programs also entails susceptibility to trade-offs between the benefits of share repurchases and the need for internal investments to foster growth (e.g., Denning, 2021; Georgescu, 2020). Resource constraints resulting from a buyback emphasis might have especially detrimental effects for investments in corporate sustainability, as sustainability investments often lack the appeal of quick financial returns, which managers may aim for in order to ensure investor support in the short term (Huang & Thakor, 2013; Sanders & Carpenter, 2003). Following normative theories, particularly firms that postulate to focus on long-term, sustainable value creation should pursue more prudent distribution policies that ensure sufficient budget for long-term, sustainable investments. However, sustainability projects are often considered non-core activities and are dropped first when firms encounter budget shortages (Chakrabarty & Wang, 2012; Girerd-Potin et al., 2014). Overall, we argue that share repurchases likely relate to a firm’s corporate sustainability activities. This study thus investigates a firm’s environmental and social value orientation as well as its environmental and social sustainability performance in the context of share repurchases, as presented in Fig. 1. Next, we derive our hypotheses.
Fig. 1
Research model. Solid lines represent the hypothesized and examined relationships; expected direction of influence in brackets
×
Firms’ Social and Environmental Value Orientation in the Context of Share Repurchases
A promising line of inquiry measures firms’ strategic orientations, such as their sustainability orientation, to assess how firms signal a particular strategic posture. Following the Sapir-Whorf hypothesis (Hoijer, 1954), firms’ use of specific language indicates their direction of attention and transports a specific strategic orientation (Noble et al., 2002). Moss et al. (2018) explain that guiding stakeholders through communications is particularly important for firms pursuing multiple goals such as economic, social, and environmental ones. However, firms may signal a particular strategic orientation or posture, “but not necessarily and strictly behave as they espouse” (Covin & Wales, 2018, p. 6). Strategic orientations need to be translated into actual behavior. For instance, a firm’s relative prioritization of strategic dimensions needs to be reflected in a corresponding allocation of financial resources to projects and divisions (Harris et al., 1982). Organizations truly pursuing sustainability objectives devote a greater share of resources to socially and environmentally beneficial projects than do firms solely focusing on shareholder value maximization (Cubas-Díaz et al., 2017; Gao & Bansal, 2013).
Recent studies find associations between social and environmental sustainability orientation and financial resource allocation (e.g., Croom et al., 2018). For instance, Claudy et al. (2016) observe sustainability orientation to predict new product development success; Mariadoss et al. (2016) identify a materiality of environmental and social orientation in supply chain management. Sustainability projects aiming for social and environmental value creation compete for resources with other corporate purposes such as maximizing shareholder return or maintaining an attractive value proposition (Luo & Bhattacharya, 2006; McWilliams & Siegel, 2000). To ensure sufficient budget for sustainability investments, firms should thus curtail distributions to shareholders to the level required for effective governance. A guiding principle of sustainability orientation, in terms of firms’ social and environmental value orientation, would hence only approve of share repurchases in situations of abundant liquidity—as hypothesized by Jensen (1986) who considered free cash flow the key driver of distributions to shareholders. In line with normative ethical theory and in light of increasing public awareness of corporate sustainability, a high sustainability orientation should, ceteris paribus, reduce share repurchase volumes. The following arguments also support a negative association between social and environmental value orientation and share repurchases.
First, translating sustainability strategies into actual behavior pays off in the long run. Scholars have shown that sustainability investments can significantly enhance economic performance through cost efficiency, new revenue streams, and brand equity (Ameer & Othman, 2012; Gao & Bansal, 2013; Ortiz de Mandojana & Bansal, 2015; Torres et al., 2012). Even investors who do not prioritize social and environmental performance may thus benefit from sustainability projects. In a 2016 global study, 75% of surveyed investors agreed on the general value creation potential of corporate sustainability (Unruh et al., 2016). Correspondingly, multiple recent studies observed positive investor reaction to firms’ sustainability engagement (Girerd-Potin et al., 2014; Khan et al., 2016; Ng & Rezaee, 2015). Second, firms’ communications may induce self-selection toward sustainability-supportive shareholders who do not primarily focus on short-term financial returns (Brønn & Vidaver-Cohen, 2009). Recent calls to climate action by some of the world’s largest asset managers (Wentworth, 2018) illustrate that investors are becoming increasingly aware of sustainability challenges and accordingly change their investment criteria. Managers in sustainability-oriented firms should thus not only have the discretion to balance distributions to shareholders with social and environmental investments, but could even be expected to do so.
Third, increasing societal attention has made impression management and greenwashing more difficult (Marquis et al., 2016). Impression management is a tactic that firms apply to actively influence stakeholder perceptions (Bansal & Clelland, 2004) to enhance the legitimization of the own business model. This motivation has been found to be a major driver of corporate social and ecological action (Brønn & Vidaver-Cohen, 2009; Chiu & Sharfman, 2011). Greenwashing occurs if “initiatives merely provide the appearance of environmental benefit” (Wright & Nyberg, 2017, p. 1635). As deceptive public communications are quickly unveiled (D’Aveni & MacMillan, 1990), companies engaging in impression management put their legitimacy and thus shareholder value at risk (Bansal & Clelland, 2004). For instance, Bansal and Clelland (2004) observe increasing stock price risk for firms whose environmental performance does not live up to expectations, while Lourenço et al. (2012) discover that investors penalize profitable firms who lag behind in corporate social responsibility. Summarizing the preceding arguments, we argue that sustainability-oriented firms will ‘walk the talk’ which, in turn, will be reflected in their resource allocation behavior. As such, a communicated sustainability orientation in terms of firms’ social and environmental value orientation will limit firms’ share repurchase behavior. We thus formally hypothesize:
Hypothesis 1a
A firm’s communicated social value orientation is negatively associated with share repurchases.
Hypothesis 1b
A firm’s communicated environmental value orientation is negatively associated with share repurchases.
The Moderating Role of Executives’ Stock Option Pay
According to agency theory, the purpose of executive compensation is to align the interests of executives with those of shareholders (Nyberg et al., 2010). Compensation packages can include short-term components, such as cash salary or bonuses, but also stock and options grants. The value of stock- and option-based compensation is not solely based on past performance, but also on the capital market’s expectations of all future cash flows. Stock- or option-based compensation thus motivates managers to maximize these market expectations (Bizjak et al., 1993). To better understand the underlying mechanisms of stock options, it is important to consider their vesting periods. Generally, stock and option grants are long-term compensation components that aim to align the interests of executives with corporate objectives and shareholders’ interests (Sanders & Carpenter, 1998). However, stock options without a vesting period or whose vesting period has lapsed—so-called vested stock options, which are the conceptual focus of this study—might motivate executives to act myopically and try to boost the share price for their own benefit. Sanders and Carpenter (2003, p. 165) write that “as executives bear greater risk, […] they tend to pursue strategic options that can quickly make an impact on stock prices while avoiding excessive personal risk.” Hence, vested stock options might incentivize managers to boost short-term earnings as their payoff is contingent on a firm’s share price (Narayanan, 1985; Stein, 1989).
A sub-stream of agency theory, the behavioral agency model, argues that executives (agents) favor practices aimed at protecting their current wealth rather than risking that wealth by seeking additional wealth (Martin et al., 2020; McGuire et al., 2019; Wiseman & Gomez-Mejia, 1998). Generally, the executive incentive pay structure should be in line with the overall strategy, as disincentives can cause executives to deviate for personal gain (Honoré et al., 2015; Stein, 1989). This also holds true in sustainability-oriented firms. While a sustainability-oriented culture may create intrinsic motivation, complementary formal incentives are required to ensure managers’ devotion to long-term performance across economic, social, and environmental dimensions (Fabrizi et al., 2014; Gao & Bansal, 2013). However, for the reasons explained above, some managerial incentives such as stock options and earnings-based bonuses can entail major trade-offs for the relationship between firms’ sustainability orientation and share repurchases. We thus expect executives’ stock option pay to play an important contingency role in the negative relationship between a firm’s sustainability orientation and share repurchase behavior.
First, in the corporate sustainability context, research shows that executives’ commitment to sustainability often reaches only as far as individual utility is not adversely affected (Gibson et al., 2013; Kock et al., 2012). As a result, executives with vested stock options might prioritize the short-term increase of their own financial wealth rather than their commitment to the firm’s long-term sustainability goals (e.g., Gibson et al., 2013; Kock et al., 2012). With respect to firm’s social value orientation, a recent study elaborates on the ethical implications of executives’ equity incentives and reveals that CEOs with stock option holdings underfund the pension plans of their employees (Martin et al., 2020). Depending on managers’ self-interest and their discretion in financial decisions, vested stock option pay may hence weaken the negative relationship between sustainability orientation (i.e., social value orientation) and repurchase behavior. Second, following the behavioral agency model, executives’ stock option pay may cause executives to pursue opportunist motives (i.e., increase buyback volumes) and deviate from long-term firm interests (i.e., environmental value orientation). As extant research reveals, stock option pay fosters executives’ opportunistic behavior and changes their decisions with respect to cash allocation behavior (Bens et al., 2003; Cheng et al., 2015). Scholars link stock option pay to executives’ decision to invest higher amounts in short-term (e.g., share repurchases) rather than in long-term capital assets (e.g., environmental projects) (Wowak et al., 2014). Especially the implementation of environmental goals, such as greener supply chains or carbon neutrality, are often perceived as long-term costly initiatives. As a result, managers with stock option pay indeed often choose to allocate cash to short-term initiatives like share repurchases (Cheng et al., 2015; Fenn & Liang, 2001; Kim & Ng, 2018). Sanders and Hambrick (2007) even reveal that stock option pay leads to executive carelessness in investment decisions, which can have detrimental effects for a firm’s sustainability agenda. Third, share buybacks are typically orchestrated by the CEO or CFO (Vermaelen, 2005), who largely influence firms’ strategic orientation (Fabrizi et al., 2014). Although both executives may have been selected based on a perceived intrinsic motivation to pursue sustainability goals, literature emphasizes the power of monetary interests as a driver of economic actors’ decisions (Fabrizi et al., 2014; Laffont & Martimort, 2002; Narayanan, 1985). Scholars have found repurchases to be associated with employee stock holdings, stock options, and bonuses contingent on earnings per share (Kahle, 2002; Kim & Ng, 2018). As outlined, managers are hence incentivized to conduct share repurchases in order to maximize their payoff—regardless of their communicated sustainability values. Thus:
Hypothesis 2a
Stock option pay of executives attenuates the negative association between social value orientation and share repurchases.
Hypothesis 2b
Stock option pay of executives attenuates the negative association between environmental value orientation and share repurchases.
Firms’ Social and Environmental Sustainability Performance in the Context of Share Repurchases
The distribution of financial resources may have significant effects on the operating business if it happens sans alignment with long-term corporate goals. In the case of share repurchases, multiple studies hint at this scenario, finding that managers conduct buybacks in response to short-term performance pressure (Farrell et al., 2014; Hribar et al., 2006; Huang & Thakor, 2013). Recognizing the potential for opportunism in buyback decisions, Fos et al. (2016) examine the operating implications of share repurchases and observe associated reductions in employment, R&D investment, and capital expenditures. Bendig et al. (2018) further find subsequent adverse effects on product safety. These observations indicate resource allocation conflicts between distribution to shareholders and long-term investment, which may have particular relevance for firms’ social and environmental sustainability performance. This trade-off has ethical implications as financial constraints are frequently named as one of the most common barriers to sustainability (Lourenço et al., 2012; Unruh et al., 2016). While many projects have the potential to eventually improve financial performance (Ameer & Othman, 2012; Gao & Bansal, 2013; Ortiz de Mandojana & Bansal, 2015), they often require significant upfront investment (Bansal, 2005; Ng & Rezaee, 2015). Since corporations typically own limited resources, sustainability competes for funding with other purposes such as innovation, operating stability, or distribution to shareholders. The complexity of allocating financial resources to these purposes increases as the firm caters to different stakeholders, a condition inherent to sustainability-driven organizations (Battilana & Dorado, 2010; Gao & Bansal, 2013).
Share repurchases were long understood as an instrument used only in times of excessive funds and little investment opportunities (Grullon & Michaely, 2004; Jensen, 1986). Under such circumstances, investors might perceive repurchases as a signal of healthy financials and respond with greater support for investments that focus on social or environmental benefits. However, recent studies disprove this “excess cash hypothesis” by showing that buybacks entail investment reductions across corporate operations (Bendig et al., 2018; Fos et al., 2016). In the light of resulting resource constraints, several factors suggest negative implications of buyback behavior for firms’ social and environmental sustainability performance. First, in alignment with the theory of myopic management, shareholders of buyback-intensive firms might have a strong preference for short-term returns and thus be skeptical toward uncertain, long-term investments (Sanders & Carpenter, 2003). They would likely support investments they believe to have economic value creation potential (Girerd-Potin et al., 2014; Hahn & Figge, 2011). Second, frequent share repurchases are also indicative of a managerial focus on short-term benefits. Buybacks are expected to trigger immediate stock price increases (Hribar et al., 2006), thereby allowing managers to steer investor sentiment and maximize their own compensation (Sanders & Carpenter, 2003). Projects that strive to increase firms’ social and environmental sustainability performance, meanwhile, involve uncertain, hard-to-quantify returns that may only be realized in future periods (Bansal, 2005; Bansal & DesJardine, 2014; Hahn et al., 2015).
Third, heavily distributing funds via repurchases implies a corporate strategy focused on shareholder value maximization (Lazonick, 2014; Vermaelen, 2005). Managers who conduct buybacks under resource constraints will thus likely fund them by dismissing investments which they perceive as less essential for shareholder wealth. Scholars showed that executives cut non-operating expenditure first when facing budget shortages, particularly when also under short-term performance pressure (Brandenburger & Polak, 1996; Mizik & Jacobson, 2007). Since sustainability investments are often considered non-core activities (Chakrabarty & Wang, 2012; Girerd-Potin et al., 2014), they are likely assigned lower priority than investments appearing essential to maintaining profitability (Kuckertz & Wagner, 2010). Based on this rationale, we expect share repurchases to affect corporate social and environmental sustainability performance negatively. We therefore hypothesize:
Hypothesis 3a
Share repurchases are negatively associated with a firm’s social sustainability performance.
Hypothesis 3b
Share repurchases are negatively associated with a firm’s environmental sustainability performance.
Data and Methodology
Sampling
We base our analyses on the S&P 500 index to enable inferences on the investment and sustainability policies of the world’s most active repurchasers. The original sample includes all firms that were part of the S&P 500 at least once between 2004 and 2016 and published buyback information during this period. In 2004, U.S. corporations became obliged to disclose repurchase information as part of their reporting to the Security Exchange Commission (SEC), setting a suitable starting point for our analysis. After removing companies with missing data on either core variable in more than 6 years (Gao & Bansal, 2013), we obtain an unbalanced panel of 491 companies. Our sample includes 96 companies from the financial industry. Differentiating between finance and non-finance firms is important as academic studies observed significant differences between the financial industry and other sectors when using the same metrics to measure sustainability performance (Ameer & Othman, 2012; Lourenço et al., 2012). We, therefore, conduct our analyses both including and excluding financial firms.
Variables
Social and Environmental Value Orientation
We derive firms’ communicated social and environmental value orientation by computer-aided text analysis (CATA) of the narratives in their annually provided letters to shareholders (LTS). Introduced by Short et al. (2010), CATA has become an established process for evaluating the extent to which text documents convey a certain theme. Shareholder letters are the most-read section of annual reports (Short et al., 2010) and represent a suitable source for sustainability orientation for three reasons. First, LTS typically represent the entire management team’s views on past and present developments and future priorities (Gamache et al., 2020; McKenny et al., 2018). Second, LTS are directed toward the broad audience of annual report readers and therefore reflect what a firm wants stakeholders to expect and associate it with (Short et al., 2010). Third, by their low degree of structural and linguistic standardization, LTS allow the management team to emphasize specific topics in their own style (McKenny et al., 2018; Pandey & Pandey, 2017).
LTS were manually extracted from annual reports. To calculate social and environmental orientation scores, we draw upon a dictionary developed by Moss et al. (2018) for the examination of venture narratives presented to potential investors. Moss et al. (2018) developed dictionaries for rating economic value orientation (EVO), social value orientation (SVO), and environmental value orientation (EnVO).4 Yet, while funding proposals and shareholder letters are both directed toward investing audiences and intend to signal a positively framed but realistic outlook on the future, there is a need to adjust for differences in industry focus and in the maturity of firms and their products between the venture context and the corporate context. Following McKenny et al. (2018), we therefore created revised dictionaries for SVO and EnVO to ensure construct reliability. We started by deductively deriving further words, word stems, and phrases commonly used to describe social and environmental themes, based on the CSR IPO dictionary by Pencle and Mâlâescu (2016). We then inductively enhanced this set by producing a list of terms contained more than three times in our LTS sample and adding those referring to social and environmental themes. For SVO, this concerns terms such as charit*, communit*, or inclusive, whereas for EnVO, we added terms such as climate impact, waste reduction, and biodiversity.5 The terms in the combined list were reviewed by three independent experts who judged their appropriateness for measuring SVO and EnVO. The reviewers agreed on 91% of the terms, which we subsequently added to the dictionaries. In the second step, we investigated a 10% subsample of shareholder letters to identify terms in the original dictionaries that were regularly used in a different, non-sustainability context (McKenny et al., 2018). An independent researcher assessed 500 randomly selected letters, representing roughly 12% of the sample, and indicated relevant terms. On a case-by-case basis, we verified, removed, or altered such terms. Table 1 presents the revised dictionaries.
Table 1
Revised SVO, EnVO, and SO dictionaries
Lists of terms for social value orientation, environmental value orientation, and sustainability orientation
SVO
abus*, affordable, beneficial for society, beneficial to consumers, benevolen*, bribe*, caregiver*, caring, charit*, child education, civic, civil society, commitment to diversity, communit*, compassion*, corporate citizen, corporate citizenship, corrupt*, create jobs, CSR, developing countries, developing nations, developing world, development aid, dignity, disabilit*, disadvantaged, discrimination, diverse company, diverse organization, empathy, employee benefit, employee benefits, employee participation, employee relations, empower*, ensure diversity, equal opportunities, equal opportunity, equal rights, equality, ethic*, ethnic*, fair trade, fair treatment, fairness, for society, for the people, freedom, gay, gender diversity, gender equality, genero*, good cause, harmony, health and safety, health benefit, health benefits, healthier, homeless, human needs, human rights, humanit*, humankind, immigra*, improve education, inclusion, inclusive, indigenous, inequality, integrity, lesbian, LGBT*, life-transforming, literacy, livelihood, lives, living conditions, malnutrition, mankind, mentoring, microcredit, microfinance, minorit*, nourish*, occupational safety, our colleagues, our people, paid time, peace*, pension plan, pension plans, philantroph*, poorest, poverty, profit sharing, profitshar*, profit-sharing, promote diversity, pro-social, provide access to, public education, public health, quality of life, racial, refuge*, sexual orientation, social activities, social benefit, social engagement, social impact, social investment, social investments, social issue, social performance, social policy, social responsibilities, social responsibility, social welfare, socially, societal, stable employment, support families, support local, teamwork, their families, their children, underprivileged, underrepresented, unfair, veteran*, volunteer*, wellbeing, well-being, womens health, working conditions, workplace benefit*, work-life balance, youth education
1aAdditional terms not clearly assignable to either SVO or EnVO, thus only usable for calculation of an aggregate sustainability orientation (SO) index
We use the CATScanner software (McKenny et al., 2012) to derive SVO and EnVO scores by counting the words per LTS that match with the respective dictionary. Those word counts, normalized by the total number of words per LTS and scaled up by 1000, represent our EnVO and SVO variables. The more words from a certain dictionary a letter has relative to total word count, the higher its score. Finally, we test our variables for three error types following McKenny et al. (2018). First, we measure test–retest reliability to understand the consistency of narratives in shareholder letters. We calculate intraclass correlation coefficients and obtain coefficients of 60% (SVO) and 77% (EnVO). This appears plausible, given that we expect some variability from internal changes and external market conditions. Second, we test for specific factor error by comparing scores returned by the CATScanner to those attributed in our manual coding of the 10% subsample and calculating parallel forms reliability. Results show that our revision of the original dictionaries has increased parallel forms reliability from 65 to 88% (r = 0.88). This score is well above the 0.8 benchmark set by Nunnally and Bernstein (1994), meaning that variance in our measurement of SVO and EnVO due to specific factor error should be low. Lastly, we address algorithm error by additionally processing our sample with the LIWC software (Pennebaker et al., 2015) and comparing scores. The procedure results in a correlation of 99.7%.
Share Repurchases
The annual volume of share repurchases serves both as an outcome and an antecedent variable in this study. We use raw dollar volumes to reflect that resource shortages may constrain sustainable investment opportunities of many different sizes. Buyback data are manually extracted from companies’ 10-K reports to the SEC (Banyi et al., 2008). 10-K reports allow us to exclude preferred stock transactions, transactions with public authorities, and employee surrenders of shares (Banyi et al., 2008) and, thereby, ensure we only consider actual cash outflows that were induced by management. Our sample confirms the significance of share repurchases in the U.S.: in a given year, around 67% of sample firms engaged in buybacks, almost half of which exceeded USD 500 million, extracting on average 71% of corporate net income.
Stock Option-Based Executive Incentives
Executive compensation incentives are common in the form of stock holdings, stock options, and annual bonuses (Fabrizi et al., 2014). We utilize the Execucomp estimate of the total dollar value of all stock options owned by the top management team that are exercisable (i.e., they represent vested options) but have not yet been exercised. This value is calculated based on the difference between an option’s exercise price and the annual closing price of the underlying stock (Kahle, 2002). Vested options are a practical measure of short-term incentives as they can be monetized anytime. For robustness, we further consider the aggregate of vested and unvested options.
Social and Environmental Performance
Empirical research on corporate sustainability performance can draw on a multitude of rating data bases (Delmas & Blass, 2010) such as the Dow Jones Sustainability Index (López et al., 2007; Lourenço et al., 2012), the MSCI KLD Index (Attig et al., 2013; Ortiz de Mandojana & Bansal, 2015; Perez-Batres et al., 2012), or the Thomson ASSET4 (now Refinitiv) ratings (Axjonow et al., 2018; Cheng et al., 2014). Typically, these ratings disregard the economic dimension of sustainability and include a separate ‘Corporate Governance’ dimension. For the purposes of this study, we employ the MSCI ESG KLD Statistics, which represent the most commonly used index in sustainability literature and encompass a broad range of sustainability performance categories (Gao & Bansal, 2013; Semenova & Hassel, 2015). Based on firms’ reporting and proprietary research, KLD annually assigns binary scores that indicate the existence of sustainability strengths and concerns in seven subcategories (MSCI ESG Research Inc., 2015). In 2010, the subcategories “Community”, “Human Rights”, “Employees”, “Diversity”, and “Product” were combined under an umbrella “social” category. While Semenova and Hassel (2015) show that the measures offered by different sustainability rating providers are highly correlated, Berg et al. (2020) find that varying scope and measurement of categories can still lead to divergence among ratings. When re-assessing the relationship between share repurchases and Refinitiv Total ESG score as a measure of sustainability performance in unreported additional tests; results show a negative association of share repurchases and sustainability performance in t + 1 and t + 2.
We derive annual performance scores from the numbers of strengths and concerns per category, disregarding KLD’s additional controversial business involvement scores. As KLD only assigns scores in criteria relevant to a firm’s industry (MSCI ESG Research Inc., 2015), for each category and each firm-year we need to normalize the number of strengths attributed by the number of strengths evaluated and the number of concerns attributed by the number of concerns evaluated. We then calculate net scores by deducting concerns from strengths for each category (Attig et al., 2013; Ng & Rezaee, 2015) and combine category values to obtain an aggregate social performance score, and scale up the results by 10 to ease interpretability. For robustness, we further calculate separate strengths and concerns scores since scholars have pointed out that both may sometimes not converge depending on the factor to be measured (Semenova & Hassel, 2015). Equations (1) and (2) show the formulas applied.
We control for relevant drivers of financial resource allocation and sustainability engagement in all models, using data from S&P’s Compustat and Execucomp databases. We include firm size, measured as log-transformed sales, and firm age as both affect priority setting in resource allocation (Coad et al., 2014; Sanders & Carpenter, 2003). We furthermore proxy for current demand conditions through year-on-year sales growth and for profitability through the operating margin (Attig et al., 2013), calculated as EBIT less extraordinary items divided by total sales. We also include companies’ growth ambitions through asset growth, employing the lagged growth rate of total firm assets (Cooper et al., 2008) and R&D intensity in terms of R&D expenditures divided by sales. Missing R&D observations were imputed following the stepwise method established by Malshe and Agarwal (2015). Finally, we incorporate measures of liquidity, which is both a key predictor of share repurchases (Brav et al., 2005) and a major determinant of sustainability engagement (Cheng et al., 2014). Specifically, liquidity is expressed in the variables financial slack, defined as the difference between current assets and current liabilities scaled by total assets (Perez-Batres et al., 2012), and leverage ratio—long-term debt divided by total assets (Ng & Rezaee, 2015).
Financial resource allocation is subject to shareholders’ power and perception of firms’ financial performance (Flammer & Bansal, 2017; Honoré et al., 2015). We hence further include stock price performance, measured via year-on-year changes in mean stock prices, and shareholder concentration, measured as the average portion of shares held per shareholder. Stock price performance also proxies for the influence of public attention, which may evoke a sudden sustainability push (Perez-Batres et al., 2012).
In our investigation of H1 and H2, we further include log-transformed cash dividend volumes (dividends) to control for the influence of a potential shift in distribution policies (Grullon & Michaely, 2002). Moreover, we include CEO tenure and CEO-CFO power balance, measured as the difference in salaries, to address the CEO’s influence on resource allocation and strategic priorities (Fabrizi et al., 2014). In our analysis of H3, we include two additional drivers of social and environmental performance. We control for capital intensity via the ratio of property, plant, and equipment to total assets to reflect that asset-heavy firms might find it more difficult to improve their environmental footprint (Marquis et al., 2016). Furthermore, we include Tobin’s Q, representing the ratio of market value to book value of assets, to proxy for the general availability of investment opportunities (Chakrabarty & Wang, 2012).
Finally, we control for U.S. economic growth and industry competitiveness in all models. Industry competitiveness is measured using the Herfindahl–Hirschman index of industry sales and is included since market pressures can trigger imitation of competitors’ sustainability engagement but also reduce managerial scope in the allocation of financial resources (Flammer & Bansal, 2017; Perez-Batres et al., 2012).
Modeling
We explore our hypotheses in two separate regression models, focusing on social and environmental variables as both antecedents and outcomes of share repurchase policies. Regression models are designed to fit the distributions of our core variables. Table 2 shows descriptive statistics. Both share repurchases and social and environmental performance, respectively, are continuously distributed. Since share repurchases are strongly right-skewed, we log-transform the variable to approximate a normal distribution in our analyses of H1 and H2. We then calculate pairwise Pearson correlations, which reveal no notable correlation among independent variables and other predictor variables in the respective model (ρ ≤ 0.24). However, we observe correlations with ρ > ± 0.3 for in total seven pairs of financial control variables. The maximum variance inflation factor observed is 2.08. We follow the steps described by Kalnins (2018) to test for errors in identification due to multicollinearity. We observe a change in signs from Pearson coefficients to beta coefficients during preliminary regressions for three pairs of highly correlated variables. This affects Tobin’s Q and its correlations with firm size (ρ = − 0.45) and financial slack (ρ = 0.42), respectively, financial slack and its correlation with firm size (ρ = − 0.34) as well as the correlation between dividends and firm age (ρ = 0.50). We investigate the affected models both with and without Tobin’s Q, financial slack, and dividends to account for each of those pairs. As presented in column 1 in Table 5 for H2 and in columns 2 and 3 in Table 7 for H3, our results remain robust.
Table 2
Descriptive statistics
Variables
n
M
SD
Min
Max
1
2
3
4
5
6
7
8
9
10
11
12
1
SVO
5223
2.87
2.96
0.00
27.9
1.00
2
EnVO
5223
1.12
2.36
0.00
29.9
0.13
1.00
3
Share repurchasesa
6327
713
1852
0.00
35,734
0.14
− 0.09
1.00
4
Sustainability performance
6218
3.36
9.61
− 30.0
52.4
0.14
− 0.08
0.19
1.00
5
Social performance
6218
2.22
8.30
− 30.0
42.4
0.13
− 0.07
0.16
0.97
1.00
6
Environmental performance
6218
1.14
2.55
− 7.14
10.0
0.11
− 0.06
0.20
0.61
0.39
1.00
7
Executive stock optionsa
6209
34.7
85.8
0.00
2377
0.08
− 0.09
0.29
0.04
0.04
0.02
1.00
8
Firm size
6328
9.48
1.43
4.41
14.8
0.21
0.11
0.23
0.16
0.15
0.13
0.07
1.00
9
Firm age
6328
35.02
18.88
0.00
66.0
0.08
0.19
0.07
0.14
0.10
0.19
− 0.02
0.28
1.00
10
Sales growth
6321
0.09
0.64
− 4.49
45.2
− 0.01
− 0.05
− 0.05
− 0.08
− 0.08
− 0.06
0.13
− 0.06
− 0.14
1.00
11
Operating margin
6328
0.06
1.70
− 102
6.65
0.02
− 0.02
0.10
0.04
0.03
0.03
0.11
0.00
− 0.03
0.10
1.00
12
Asset growth
6328
0.05
0.17
− 2.68
0.91
0.02
− 0.01
− 0.05
− 0.05
− 0.05
− 0.03
0.18
− 0.02
− 0.14
0.31
0.23
1.00
13
R&D intensity
6328
0.02
0.04
0.00
0.68
− 0.08
− 0.12
0.07
0.14
0.12
0.15
0.04
− 0.24
− 0.12
0.07
0.03
0.04
14
Capital intensity
5946
0.27
0.25
0.00
0.95
− 0.04
0.35
− 0.23
− 0.16
− 0.13
− 0.17
− 0.10
− 0.04
0.13
− 0.03
− 0.07
− 0.05
15
Financial slack
6328
0.08
0.09
0.00
0.79
− 0.07
− 0.16
0.05
0.07
0.05
0.08
0.03
− 0.34
− 0.17
0.04
0.04
0.06
16
Leverage ratio
6328
0.22
0.17
0.00
1.65
− 0.05
0.15
− 0.15
− 0.01
− 0.02
0.02
− 0.12
− 0.04
0.06
− 0.09
− 0.07
− 0.10
17
Stock price performance
6292
0.29
5.30
− 1.00
353
0.00
− 0.01
0.05
− 0.01
0.00
− 0.04
0.03
− 0.02
− 0.03
0.03
0.01
− 0.09
18
Tobin’s Q
6306
1.35
1.31
0.00
15.53
0.01
− 0.15
0.13
0.04
0.04
0.04
0.31
− 0.45
− 0.23
0.17
0.13
0.15
19
Shareholder concentration
6265
1.50
25.62
0.00
1000
0.03
0.03
− 0.03
− 0.01
0.00
− 0.02
− 0.05
0.00
− 0.07
0.00
0.01
0.01
20
Dividendsa
6305
531
1327
0.00
36,112
0.15
0.16
0.26
0.19
0.17
0.17
0.05
0.56
0.50
− 0.14
0.04
− 0.10
21
CEO tenure
6244
6.50
6.50
0.00
53.00
− 0.01
− 0.06
− 0.01
0.00
0.00
0.00
0.13
− 0.07
− 0.12
0.05
0.01
0.07
22
CEO-CFO power balance
6209
1.99
1.10
0.00
29.25
− 0.02
0.01
− 0.03
− 0.07
− 0.05
− 0.07
0.01
− 0.07
0.01
0.02
0.00
0.02
23
U.S. economic growth
6328
0.02
0.02
− 0.03
0.04
0.04
− 0.09
0.14
0.12
0.10
0.11
0.21
0.01
0.02
0.14
0.06
0.04
24
Industry competitiveness
6328
0.07
0.06
0.03
0.45
− 0.08
− 0.03
− 0.05
− 0.06
− 0.04
− 0.07
0.02
− 0.09
− 0.03
0.00
− 0.05
− 0.01
Variables
13
14
15
16
17
18
19
20
21
22
23
24
1
SVO
2
EnVO
3
Share repurchasesa
4
Sustainability performance
5
Social performance
6
Environmental performance
7
Executive stock optionsa
8
Firm size
9
Firm age
10
Sales growth
11
Operating margin
12
Asset growth
13
R&D intensity
1.00
14
Capital intensity
− 0.23
1.00
15
Financial slack
0.41
− 0.28
1.00
16
Leverage ratio
− 0.13
0.30
− 0.17
1.00
17
Stock price performance
0.00
0.00
− 0.01
0.00
1.00
18
Tobin’s Q
0.39
− 0.10
0.42
− 0.19
0.06
1.00
19
Shareholder concentration
− 0.01
0.04
− 0.02
0.04
0.03
− 0.01
1.00
20
Dividendsa
− 0.23
0.09
− 0.23
− 0.01
− 0.02
− 0.20
0.00
1.00
21
CEO tenure
0.03
0.01
0.04
− 0.02
0.01
0.12
− 0.02
− 0.07
1.00
22
CEO-CFO power balance
− 0.01
0.05
− 0.02
0.02
0.01
− 0.02
0.00
− 0.03
− 0.01
1.00
23
U.S. economic growth
− 0.01
− 0.01
− 0.03
− 0.02
0.03
0.11
− 0.02
0.03
0.02
− 0.01
1.00
24
Industry competitiveness
− 0.01
0.22
− 0.02
0.09
0.01
0.03
− 0.02
0.01
0.02
0.08
0.00
1.00
Boldface indicates correlations significant at least at the 5% level. a. Descriptive statistics reported in millions without log
M = mean; SD = standard deviation
aN = 491 firms; n = number of observations;
Following Hausman tests of preliminary regression models (Hausman, 1978), we use fixed effects models to identify the hypothesized relationships. Fixed effects models estimate constant coefficients across a panel (Wooldridge, 2005), reflecting that further firm characteristics yet unaccounted for may influence identification (Chakrabarty & Wang, 2012; Khan et al., 2016). We additionally include time dummies and estimate robust Huber-White standard errors (White, 1982) to address potential heteroskedasticity.
Since shareholder letters are written in retrospect, we investigate H1 and H2 for repurchase volume in the following year. Similarly, we analyze H3 for firms’ social and environmental performance in each of the three periods subsequent to repurchases to reflect that resource allocation decisions in t = 0 likely affect project outcomes across several future periods (Chakrabarty & Wang, 2012). Equations (3), (4), and (5) describe our regression models. Rep_vol refers to share repurchase volume and SO classifies social and environmental value orientation, respectively. In Eq. (4), Opt_vol denotes the volume of vested, unexercised executive stock options, and Int refers to the interaction term between SO and Opt_vol. In Eq. (5), Sust_Perf comprises total sustainability performance, social performance, and environmental performance. λ is a vector of year dummies. x describes a set of controls lagged by one period in regard to the dependent variable, whereas y in Eq. (5) comprises those controls that drive financial resource allocation and are always kept in t = 0 to isolate the effect of share repurchases. Dividends and the CEO-related controls are only included in Eqs. (3) and (4), while capital intensity and Tobin’s Q are only included in Eq. (5).
While our models account for time-fixed effects and firm-fixed effects, omitted predictor variables varying across time and firms might still distort identification. Omitted variables may further lead to simultaneity and reverse causality issues. Following Gao and Bansal’s (2013) findings on simultaneous determination, our model of share repurchases as a function of sustainability orientation may be biased if firms purposely adjust their communication prior to conducting repurchases. We thus apply a two-Stage least squares instrumental variable regression to isolate the exogenous part of SO (Papies et al., 2017). Similar to Attig et al. (2013), we use previous-year industry averages of SVO and EnVO as instruments in the first-stage regression. Literature shows that companies’ sustainability engagement is strongly impacted by competitor behavior (Brønn & Vidaver-Cohen, 2009; Roxas & Coetzer, 2012). Industry SO-averages should be exogenous to individual firms’ repurchase plans; it is unlikely that competitor firms act collectively against the focal firm (cf. Germann et al., 2015). Following Papies et al. (2017), we assess the strength of our candidate instruments using different statistics. We calculate the correlation coefficients between the industry-average values and the individual firm score. For SVO we got a coefficient of 0.27 and for EnVO a coefficient of 0.58, providing initial evidence for instrument strength. Table 3 additionally provides first-stage regression results. Both models show a significant effect of the instruments, and the strength of our instruments is additionally verified by the Cragg-Donald Wald F-statistic at the 1%-level (Staiger & Stock, 1997). The F-statistic-value of 11.98 for SVO fulfills the requirement of the Stock-Yogo critical value at a 15% level and the F-statistic value of 49.62 for EnVO exceeds the 10% critical value of 16.38. The R2 increases significantly when adding the respective instrument at the first stage. We then predict SVO and EnVO scores and include them in our main models. To test for presence of endogeneity after implementing our instruments, we run the Durbin–Wu–Hausman test to compare the original model to the one using predicted values. The tests are significant (p < 0.01) for both variables as stated in Table 3, thus indicating that our corrected SVO and EnVO variables are to be preferred for unbiased identification of the hypothesized relationships.
Table 3
Instrumental variable regression for H1 & H2
Variables
(1)
SVO
(2)
EnVO
Industry SVOa
0.42***
(0.09)
Industry EnVOa
0.56***
(0.13)
Firm size
0.41***
0.30***
(0.11)
(0.07)
Firm age
0.09
− 0.06
(0.12)
(0.08)
Sales growth
0.02
− 0.01
(0.03)
(0.01)
Operating margin
0.04
0.02
(0.02)
(0.01)
Financial slack
0.03
0.02
(0.06)
(0.04)
Leverage ratio
− 0.17**
0.08*
(0.08)
(0.04)
Stock price performance
− 0.00
− 0.22**
(0.27)
(0.11)
Shareholder concentration
0.04***
− 0.02**
(0.01)
(0.01)
CEO tenure
− 0.11
− 0.00
(0.07)
(0.04)
CEO-CFO power balance
0.02
0.02
(0.05)
(0.03)
U.S. economic growth
− 0.89***
− 0.25*
(0.24)
(0.14)
Industry competitiveness
− 0.46
− 0.48*
(0.57)
(0.28)
Constant
3.86***
1.03***
(0.39)
(0.18)
Time-fixed effects
Included
Included
Industry-fixed effects
Included
Included
Observations
4503
4503
Cragg–Donald Wald F-statisticb
11.98
49.62
p-value
0.00
0.00
Wu-Hausman Fc
39.07
55.19
p-value
0.00
0.00
Results for first-stage random effects regression of SVO and EnVO; boldface indicates significance for focus variables
aInstruments
bStock-Yogo test for weak identification;
cDurbin-Wu-Hausman test for endogeneity performed on second-stage regression (see Table 4)
N = 491 firms
*p < 0.10; **p < 0.05; ***p < 0.01
In Eq. (5), a comparable bias would arise if repurchase decisions were driven by a lack of investment opportunities in sustainability. Share repurchases literature regularly emphasizes growth opportunities, which we have approximated via Tobin’s Q, as drivers of distribution policies (Fos et al., 2016). Yet, corporate sustainability can be fostered through a broad range of initiatives across a company’s organization and activities, making it highly unlikely that firms, regardless of industry, do not dispose of fruitful opportunities to invest in social and environmental impact. We infer that our model of social and environmental performance is not unduly affected by reverse causality.
Results
The Association of Social and Environmental Value Orientation and Share Repurchases
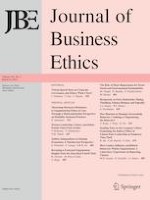
Table 4 provides regression results with standardized coefficients from the estimation of Eqs. (3) and (4). We validate the strength of the basic model (F = 31.44) and afterward add the SVO and EnVO variables. We first analyze H1. The first regression, including all sample firms, does not indicate any association of either SVO or EnVO with share repurchases (p > 0.1). Due to the aforementioned differences of financial firms, we then re-estimate the model with a reduced sample of 395 firms that excludes the financial industry. This adjustment does not affect the significance of SVO, so we cannot confirm that SVO is negatively associated with share repurchases (H1a). Still, the adjustment results in a significant curvilinear association between EnVO and repurchases (Model 3: β1 = − 1.53, p < 0.01; β2 = − 0.39, p < 0.05; β3 = 0.14, p < 0.01). When adding the linear, then the squared, and then the cubic terms stepwise, the results remain stable in unreported regressions. A linear regression model would be insufficient to capture this relationship as observations do not fit a straight regression line (cf. Barnett & Salomon, 2012). Figure 2 plots the marginal change of repurchase volume at different values of EnVO. We observe significant slopes (p < 0.01) in the range of − 1.5 to + 1.5 standard deviations, illustrating a slightly S-shaped relationship with an increasing negative slope. Notably, Fig. 2 shows that an increase in EnVO is only significantly associated with concomitant decreases in share repurchases along a certain section of the EnVO continuum. Yet, those results indicate that for the most part of the continuum, financial resource allocation to buybacks decreases as firms become more environmentally oriented outside the financial industry. In economic terms, this translates an increase in share repurchase volume of $M6-7 for each 1SD-step in communicated EnVO.
Table 4
Regression results—H1 & H2
Hypothesis 1
Hypothesis 2
(1)
t + 1
Basic model
(2)
t + 1
Main model
(3)
t + 1
Main model excl. financial sectorb
(4)
t + 1
SVO interacted w stock optionsb
(5)
t + 1
EnVO interacted w stock optionsb
Dependent variables
Share repurchases
Share repurchases
Predicted SVOa
− 0.17
− 0.27
− 0.39**
− 0.25
(0.19)
(0.19)
(0.19)
(0.19)
Predicted EnVOa
0.25
− 1.53***
− 0.04
− 1.43***
(0.27)
(0.47)
(0.27)
(0.46)
Predicted EnVOa (squared)
− 0.39**
− 0.37**
(0.19)
(0.18)
Predicted EnVOa (cubic)
0.14***
0.13***
(0.04)
(0.03)
Executive stock options
0.24**
0.41***
(0.10)
(0.12)
SVO \(\times\) Executive stock options
− 0.16*
(0.09)
EnVO \(\times\) Executive stock options
0.62***
(0.15)
EnVO (squared) \(\times\) Executive stock options
0.02
(0.13)
EnVO (cubic) \(\times\) Executive stock
options
− 0.03
(0.04)
Firm size
0.92***
0.81**
1.37***
1.19***
1.29***
(0.30)
(0.37)
(0.42)
(0.42)
(0.41)
Firm age
− 0.74
− 0.77
0.36
− 0.16
0.29
(0.68)
(0.73)
(0.82)
(0.75)
(0.81)
Sales growth
− 0.02
− 0.02
0.05
0.06
0.03
(0.06)
(0.07)
(0.07)
(0.07)
(0.07)
Operating margin
0.22***
0.22***
0.47***
0.46***
0.45***
(0.07)
(0.06)
(0.12)
(0.11)
(0.11)
Asset growth
− 0.11**
− 0.11**
− 0.18***
− 0.19***
− 0.19***
(0.04)
(0.05)
(0.05)
(0.05)
(0.05)
R&D intensity
0.05
0.06
0.10
0.12
0.09
(0.10)
(0.19)
(0.19)
(0.20)
(0.19)
Financial slack
− 0.03
− 0.06
0.01
0.01
− 0.00
(0.07)
(0.08)
(0.08)
(0.08)
(0.08)
Leverage ratio
− 0.50***
− 0.62***
− 0.48***
− 0.54***
− 0.46***
(0.12)
(0.15)
(0.15)
(0.14)
(0.15)
Stock price performance
− 0.06***
− 0.23
− 0.18
− 0.07
− 0.26
(0.02)
(0.21)
(0.24)
(0.25)
(0.25)
Shareholder concentration
0.07***
0.04***
0.03***
0.04***
0.03***
(0.00)
(0.01)
(0.01)
(0.01)
(0.01)
Dividends
0.10
0.12
0.20
0.22
0.18
(0.12)
(0.13)
(0.14)
(0.14)
(0.14)
CEO tenure
0.06
0.08
0.03
− 0.01
− 0.02
(0.07)
(0.08)
(0.08)
(0.08)
(0.08)
CEO-CFO power balance
− 0.07*
− 0.09**
− 0.08*
− 0.09**
− 0.07*
(0.04)
(0.04)
(0.04)
(0.04)
(0.04)
U.S. economic growth
− 1.33**
− 1.11*
− 0.09
− 0.50
− 0.24
(0.52)
(0.63)
(0.74)
(0.70)
(0.74)
Industry competitiveness
− 0.50
− 0.58
− 0.81
− 0.73
− 0.73
(0.50)
(0.58)
(0.62)
(0.59)
(0.60)
Constant
5.47***
5.49***
4.90***
5.23***
5.02***
(0.45)
(0.53)
(0.73)
(0.64)
(0.72)
Time-fixed effects
Included
Included
Included
Included
Included
Firm-fixed effects
Included
Included
Included
Included
Included
Observations
4773
4173
3335
3335
3335
R-squared (within)
0.15
0.16
0.16
0.15
0.17
F-statistic
31.44***
17.65***
12.78***
12.01***
12.40***
Fixed effects regression of share repurchases on SVO and EnVO, moderated by executive stock options; boldface indicates significance for focus variables
aSVO and EnVO predicted via instrumental variable regression; 2. 96 financial sector firms excluded
N = 491 firms (395 when excluding the financial sector)
*p < 0.10; **p < 0.05; ***p < 0.01; t + 0 = year of SVO/EnVO measurement
Fig. 2
Margins plot H1b. Figure based on Table 4, column (3): Predictive margins with 95% CIs for the relationship between EnVO in t = 0 and share repurchases in t + 1, excluding the financial sector (N = 395 firms)
×
We investigate H2 by interacting SVO and EnVO, respectively, with our measure of vested executive stock options. For H2a, we observe a marginally significant (p < 0.1) negative interaction of the SVO-repurchase relationship, rendering the coefficient of SVO negatively significant. We reject H2a. With regards to H2b, the linear EnVO term is significantly moderated by executive options, as indicated by a statistically significant and positive interaction term in Model 5 in Table 4 (β = 0.62, p < 0.01). This suggests a difference in slopes between firms with high and low amounts of options, which we confirm by a simple margins test (Chi2 = 27.83, p < 0.01). Figure 3 plots the interaction for − 1 and + 1 SD, illustrating a reduced negative slope for firm-years with high executive options. The point estimates remain significant throughout, but the slope is only significantly different from zero for low volumes of executive options (Chi2 = 12.84, p < 0.01).
Fig. 3
Margins plot H2b. Figure based on Table 4, column (5): Predictive margins with 95% CIs for the relationship between EnVO in t = 0 and share repurchases in t + 1, moderated by the volume of vested executive stock options in t = 0, excluding the financial sector (N = 395 firms)
×
We conduct several robustness tests, which are shown in Table 5. First, we repeat regressions without dividends as a control variable, thereby responding to multicollinearity concerns in Model 1. Second, the sum of share repurchases in t + 1 and t + 2 is used as the dependent variable in an additional regression to understand whether the association with sustainability orientation is persistent. Third, we substitute our share repurchase variable with Compustat’s Purchases of Common and Preferred Stock. Furthermore, we address concerns about autocorrelation driving our results by including share repurchase volumes in t = 0 and t − 1 as controls. The coefficients of EnVO and the related interaction terms remain significant throughout these tests. In addition, we investigate whether reduced buyback activity merely reflects a shift in distribution methods toward dividends by high-EnVO firms. Yet, replacing share repurchases with total cash dividend volumes as the new dependent variable renders the coefficient of EnVO insignificant. Moreover, when we again replace the dependent variable by the leverage ratio, we obtain a positive and significant coefficient for EnVO but a negative and significant coefficient for SVO—confirming that an environmental value orientation is associated with increased needs for financial resources. Finally, we replace our moderator variable with total executive stock options, thus also considering unvested options. The moderation remains unaffected, indicating that our inferences on the role of executive stock options are robust.
Table 5
Robustness tests—H1 & H2
(1)
t + 1
Main model
excl. dividendsb
(2)
t + 1 & t + 2c Main model
(3)
t + 1
Main model w Compustat repurchasesd
(4)
t + 1
Main model w auto-regression
(5)
t + 1
Main model w alternative DV
(6)
t + 1
Main model
w alternative DV
(7)
t + 1
Main model w alternative moderatore
Dependent variables
Share repurchases
Share repurchases
Share repurchases
Share repurchases
Dividends
Leverage ratio
Share repurchases
Predicted SVOa
− 0.24
− 0.34*
− 0.25
− 0.22
− 0.10
− 0.06***
− 0.26
(0.19)
(0.20)
(0.18)
(0.19)
(0.07)
(0.01)
(0.19)
Predicted EnVOa
− 1.44***
− 1.50***
− 1.09**
− 1.42**
− 0.14
0.09***
− 1.46***
(0.46)
(0.48)
(0.45)
(0.46)
(0.13)
(0.02)
(0.46)
Predicted EnVOa (squared)
− 0.37**
− 0.37*
− 0.35*
− 0.39**
0.00
− 0.02**
− 0.38**
(0.18)
(0.19)
(0.19)
(0.18)
(0.05)
(0.01)
(0.18)
Predicted EnVOa (cubic)
0.13***
0.12***
0.11***
0.14***
0.00
0.00
0.14***
(0.03)
(0.04)
(0.04)
(0.04)
(0.01)
(0.00)
(0.04)
Executive stock options
0.41***
0.33***
0.36***
0.30**
0.34***
(0.12)
(0.11)
(0.13)
(0.12)
(0.13)
EnVO \(\times\) Executive stock options
0.63***
0.37**
0.54**
0.45***
0.48***
(0.15)
(0.16)
(0.21)
(0.17)
(0.18)
EnVO (squared) \(\times\) Executive stock options
0.02
− 0.02
0.02
0.01
− 0.01
(0.13)
(0.12)
(0.12)
(0.12)
(0.13)
EnVO (cubic) \(\times\) Executive
stock options
− 0.03
0.01
− 0.01
− 0.01
− 0.00
(0.04)
(0.04)
(0.04)
(0.04)
(0.04)
Share repurchases (t = 0)
0.39***
(0.08)
Share repurchases (t − 1)
− 0.16**
(0.07)
Firm size
1.39***
1.23***
1.33***
1.21***
0.39***
0.04*
1.32***
(0.40)
(0.43)
(0.42)
(0.41)
(0.13)
(0.02)
(0.42)
Firm age
0.32
2.06**
0.52
0.28
0.32
0.14***
0.33
(0.82)
(0.84)
(0.78)
(0.82)
(0.29)
(0.04)
(0.81)
Sales growth
0.03
0.14**
0.12*
0.01
0.06*
− 0.00
0.03
(0.07)
(0.07)
(0.07)
(0.07)
(0.03)
(0.00)
(0.07)
Operating margin
0.45***
0.17
0.31***
0.40***
0.14**
− 0.01***
0.45***
(0.11)
(0.11)
(0.11)
(0.11)
(0.06)
(0.00)
(0.11)
Asset growth
− 0.19***
− 0.19***
− 0.15***
− 0.17***
0.02
0.00
− 0.19***
(0.05)
(0.06)
(0.05)
(0.05)
(0.02)
(0.00)
(0.05)
R&D intensity
0.09
− 0.11
0.21
0.06
− 0.06
0.00
0.09
(0.19)
(0.18)
(0.19)
(0.18)
(0.06)
(0.01)
(0.19)
Financial slack
0.01
− 0.02
0.04
− 0.02
0.05*
− 0.00
0.00
(0.08)
(0.08)
(0.08)
(0.08)
(0.03)
(0.00)
(0.08)
Leverage ratio
− 0.47***
− 0.54***
− 0.53***
− 0.49***
− 0.09**
− 0.47***
(0.15)
(0.16)
(0.15)
(0.15)
(0.04)
(0.15)
Stock price performance
− 0.25
− 0.43*
− 0.27
− 0.28
− 0.10
0.01
− 0.28
(0.24)
(0.24)
(0.29)
(0.25)
(0.11)
(0.01)
(0.25)
Shareholder concentration
0.03***
0.03***
0.03***
0.03***
0.00
0.00***
0.03***
(0.01)
(0.01)
(0.01)
(0.01)
(0.00)
(0.00)
(0.01)
Dividends
− 0.07
0.25*
0.19
1.75***
0.00
0.19
(0.14)
(0.13)
(0.14)
(0.09)
(0.01)
(0.14)
CEO tenure
− 0.02
− 0.11
0.02
0.01
− 0.02
− 0.01
− 0.00
(0.08)
(0.09)
(0.08)
(0.08)
(0.03)
(0.01)
(0.08)
CEO-CFO power balance
− 0.07*
− 0.11**
− 0.07*
− 0.08**
− 0.01
− 0.00
− 0.07*
(0.04)
(0.04)
(0.04)
(0.04)
(0.01)
(0.00)
(0.04)
U.S. economic growth
− 0.18
1.74**
− 0.06
− 0.20
− 0.42
− 0.03
− 0.18
(0.74)
(0.73)
(0.69)
(0.75)
(0.27)
(0.04)
(0.74)
Industry competitiveness
− 0.75
− 0.37
− 0.71
− 0.68
− 0.18
− 0.00
− 0.74
(0.60)
(0.66)
(0.57)
(0.60)
(0.18)
(0.02)
(0.60)
Constant
5.00***
4.13***
5.04***
4.96***
4.84***
0.27***
4.98***
(0.72)
(0.70)
(0.68)
(0.73)
(0.26)
(0.03)
(0.72)
Time-fixed effects
Included
Included
Included
Included
Included
Included
Included
Firm-fixed effects
Included
Included
Included
Included
Included
Included
Included
Observations
3340
3334
3335
3335
3334
3335
3335
R-squared (within)
0.17
0.13
0.18
0.18
0.54
0.17
0.17
F-statistic
12.80***
9.56***
13.06***
12.09***
41.74***
11.48***
12.09***
All calculations shown exclude the financial sector, which comprises 96 firms
Robustness tests for regression of share repurchases on SVO and EnVO, moderated by executive stock options; boldface indicates significance for focus variables
aSVO and EnVO predicted via instrumental variable regression
bRegression excluding dividends to account for high correlation between control variables
cCumulated share repurchases in t + 1 and t + 2 as dependent variable
dCompustat share repurchases as dependent variable
eTotal (vested and unvested) options as moderator
N = 395 firms (financial sector excluded)
*p < 0.10; **p < 0.05; ***p < 0.01; t + 0 = year of SVO/EnVO measurement
The Association of Share Repurchases and Social and Environmental Performance
Table 6 provides regression results and robustness tests for the estimation of Eq. (5) and H3. The base model is valid (F = 71.99). We observe weak negative associations between share repurchases and environmental performance as well as the combined metric in t + 1 (p < 0.1), which is plausible given that sustainability projects take time to produce tangible results (Bansal & DesJardine, 2014). We find strong evidence of share repurchases being a significant and negative predictor of combined social and environmental performance in t + 2 (β = − 0.73, p < 0.01) and t + 3 (β = − 0.87, p < 0.01), respectively. Furthermore, in t + 2, share repurchases are negatively related to both social (β = − 0.58, p < 0.01) and environmental performance (β = − 0.14, p < 0.05), while in t + 3, only social performance exhibits a negative and significant relation (β = − 0.78, p < 0.01).
Table 6
Regression results—H3
Dependent variables
(1)
t + 1
Basic model
(2)
t + 1
Main model
(3)
t + 1
Main model
(4)
t + 1
Main model
(5)
t + 2
Main model
(6)
t + 2
Main model
(7)
t + 2
Main model
(8)
t + 3
Main model
(9)
t + 3
Main model
(10)
t + 3
Main model
Social & environmental performance
Social & environmental performance
Social performance
Environmental performance
Social & environmental performance
Social performance
Environmental performance
Social & environmental performance
Social performance
Environmental performance
Share repurchases
− 0.42*
− 0.29
− 0.13*
− 0.73***
− 0.58***
− 0.14**
− 0.87***
− 0.78***
− 0.09
(0.22)
(0.18)
(0.07)
(0.24)
(0.20)
(0.07)
(0.20)
(0.19)
(0.07)
Firm size
− 0.01
0.05
0.32
− 0.27
0.52
0.69
− 0.17
1.04
1.28
− 0.24
(0.78)
(0.78)
(0.68)
(0.23)
(0.87)
(0.77)
(0.26)
(0.94)
(0.85)
(0.27)
Firm age
24.56***
24.57***
18.08***
6.49***
27.38***
20.66***
6.72***
14.65***
11.33***
3.32***
(1.53)
(1.53)
(1.38)
(0.50)
(1.44)
(1.29)
(0.50)
(3.16)
(3.03)
(0.80)
Sales growth
0.02
0.01
− 0.01
0.03**
0.05
0.01
0.04***
0.06*
0.06*
− 0.00
(0.05)
(0.05)
(0.05)
(0.01)
(0.04)
(0.04)
(0.01)
(0.03)
(0.03)
(0.01)
Operating margin
− 0.04
− 0.03
0.03
− 0.06***
− 0.07
− 0.01
− 0.07***
− 0.13***
− 0.07
− 0.06***
(0.04)
(0.04)
(0.04)
(0.01)
(0.05)
(0.04)
(0.01)
(0.05)
(0.04)
(0.01)
Asset growth
0.05
0.03
0.06
− 0.03
0.27**
0.21*
0.05
0.03
− 0.05
0.08**
(0.13)
(0.13)
(0.12)
(0.04)
(0.13)
(0.12)
(0.03)
(0.15)
(0.13)
(0.04)
R&D intensity
− 0.61*
− 0.62**
− 0.39*
− 0.23**
− 0.50*
− 0.33
− 0.18*
− 0.42
− 0.29
− 0.12
(0.32)
(0.31)
(0.23)
(0.11)
(0.30)
(0.24)
(0.10)
(0.28)
(0.22)
(0.09)
Capital intensity
1.34
1.26
1.29
− 0.03
2.14*
2.14**
− 0.00
3.24***
3.27***
− 0.04
(0.97)
(0.96)
(0.83)
(0.28)
(1.11)
(0.94)
(0.32)
(1.20)
(1.05)
(0.32)
Financial slack
− 0.23
− 0.21
− 0.21
− 0.01
− 0.30
− 0.29
− 0.01
− 0.43*
− 0.41**
− 0.01
(0.22)
(0.22)
(0.20)
(0.06)
(0.24)
(0.22)
(0.07)
(0.23)
(0.20)
(0.07)
Leverage ratio
0.18
0.20
0.13
0.08
− 0.02
0.01
− 0.03
0.17
0.21
− 0.04
(0.26)
(0.26)
(0.23)
(0.07)
(0.30)
(0.27)
(0.08)
(0.35)
(0.32)
(0.09)
Stock price performance
− 0.03
− 0.03
− 0.01
− 0.02
− 0.03
− 0.05
0.02
− 0.12
− 0.09
− 0.03
(0.08)
(0.08)
(0.08)
(0.02)
(0.13)
(0.11)
(0.03)
(0.11)
(0.10)
(0.03)
Tobin’s Q (t − 1)
− 0.39
− 0.35
− 0.44
0.10
− 0.30
− 0.33
0.03
0.27
0.30
− 0.03
(0.33)
(0.33)
(0.30)
(0.08)
(0.34)
(0.32)
(0.08)
(0.34)
(0.32)
(0.08)
Shareholder concentration
− 0.06***
− 0.05***
− 0.07***
0.01***
− 0.03
− 0.02
− 0.00
− 0.02
0.02
− 0.04***
(0.01)
(0.01)
(0.01)
(0.00)
(0.02)
(0.01)
(0.00)
(0.02)
(0.02)
(0.00)
U.S. economic growth
5.50***
5.43***
3.83***
1.60***
2.52***
1.98***
0.54***
− 5.10***
− 3.61***
− 1.49***
(1.42)
(1.43)
(1.37)
(0.36)
(0.44)
(0.43)
(0.12)
(1.30)
(1.27)
(0.33)
Industry competitiveness
4.12***
4.07***
4.32***
− 0.25
5.60***
6.09***
− 0.49
3.28**
3.49**
− 0.21
(1.28)
(1.29)
(1.11)
(0.44)
(1.33)
(1.14)
(0.49)
(1.47)
(1.37)
(0.43)
Constant
− 0.45
− 0.39
− 0.28
− 0.11
2.90***
1.93***
0.97***
6.97***
4.90***
2.07***
(1.06)
(1.07)
(1.02)
(0.26)
(0.27)
(0.26)
(0.06)
(0.58)
(0.56)
(0.15)
Time-fixed effects
Included
Included
Included
Included
Included
Included
Included
Included
Included
Included
Firm-fixed effects
Included
Included
Included
Included
Included
Included
Included
Included
Included
Included
Observations
4823
4823
4823
4823
4364
4364
4364
3905
3905
3905
R-squared (within)
0.41
0.41
0.36
0.36
0.39
0.35
0.34
0.36
0.33
0.30
F-statistic
71.99***
71.26***
82.34***
33.19***
51.07***
48.51***
33.08***
56.05***
55.09***
45.89***
Fixed effects regression of social and environmental sustainability performance on share repurchases; boldface indicates significance for focus variables
N = 461 firms
*p < 0.10; **p < 0.05; ***p < 0.01; t + 0 = year of repurchase
Table 7 shows the results of robustness tests using the combined sustainability metric as the dependent variable. We repeat regressions without financial services firms, with the Compustat repurchase measure (not shown) and excluding financial slack and Tobin’s Q, respectively, due to multicollinearity concerns. Furthermore, we address concerns for potential autocorrelation by including social and environmental performance scores for up to three lags in relation to the dependent variable (shown for t + 3). The coefficient for share repurchases remains negative and significant in all cases. Responding to Semenova and Hassel (2015), we furthermore investigate whether results change when separately investigating sustainability strengths and weaknesses. We find a negative association of share repurchases with aggregate sustainability strengths and a positive association with aggregate weaknesses. Our results are thus robust to concerns about the convergence of KLD’s categories.
Table 7
Robustness tests—H3
Dependent variables
(1)
t + 3
Main model excl. financial sector firmsa
(2)
t + 3
Main model excl. financial slackb
(3)
t + 3
Main model excl
Tobin’s Qb
(4)
t + 3
Main model w auto-regressionc
(5)
t + 3
Main model w alternative DV
(6)
t + 3
Main model w alternative DV
Social & environmental performance
Social & environmental performance
Social & environmental performance
Social & environmental performance
Aggregate sustainability strengthsd
Aggregate sustainability concernsd
Share repurchases
− 0.89***
− 0.88***
− 0.86***
− 0.56***
− 0.60***
0.33**
(0.22)
(0.20)
(0.20)
(0.18)
(0.22)
(0.15)
Total sustainability performance (t + 2)
4.06***
(0.18)
Total sustainability performance (t + 1)
− 0.67***
(0.20)
Total sustainability performance (t + 0)
− 0.78***
(0.17)
Firm size
0.99
1.34
0.90
0.60
2.82***
2.06***
(1.11)
(0.90)
(0.93)
(0.66)
(0.89)
(0.54)
Firm age
16.90***
14.45***
14.35***
23.82***
7.37**
− 12.30***
(3.50)
(3.15)
(3.13)
(3.76)
(3.11)
(1.81)
Sales growth
0.06*
0.06*
0.06*
0.03
0.01
− 0.03
(0.03)
(0.03)
(0.03)
(0.03)
(0.05)
(0.02)
Operating margin
− 0.14***
− 0.13***
− 0.11**
− 0.08**
− 0.11**
0.05*
(0.05)
(0.05)
(0.04)
(0.04)
(0.05)
(0.02)
Asset growth
0.03
0.01
0.06
− 0.08
− 0.08
− 0.06
(0.16)
(0.14)
(0.14)
(0.13)
(0.14)
(0.08)
R&D intensity
− 0.42
− 0.39
− 0.40
− 0.29
− 0.31
0.14
(0.28)
(0.27)
(0.29)
(0.19)
(0.27)
(0.13)
Capital intensity
3.25***
3.57***
3.25***
2.42***
3.01***
− 0.65
(1.22)
(1.18)
(1.20)
(0.85)
(1.13)
(0.67)
Financial slack
− 0.48**
− 0.44*
− 0.33*
− 0.61***
− 0.03
(0.24)
(0.23)
(0.18)
(0.23)
(0.12)
Leverage ratio
0.13
0.19
0.13
0.23
− 0.18
− 0.21
(0.36)
(0.35)
(0.34)
(0.26)
(0.31)
(0.18)
Stock price performance
− 0.15
− 0.11
− 0.12
− 0.10
− 0.11
0.09
(0.13)
(0.11)
(0.12)
(0.12)
(0.10)
(0.06)
Tobin’s Q (t − 1)
0.26
0.31
0.23
− 0.22
− 0.28*
(0.36)
(0.34)
(0.27)
(0.34)
(0.17)
Shareholder concentration
− 0.01
− 0.02
− 0.02
− 0.02
− 0.18***
− 0.22***
(0.02)
(0.02)
(0.02)
(0.01)
(0.01)
(0.01)
U.S. economic growth
− 4.08***
− 5.04***
− 5.22***
1.08
− 3.52***
2.02***
(1.45)
(1.31)
(1.29)
(1.63)
(1.28)
(0.75)
Industry competitiveness
3.15**
3.27**
3.25**
1.37
0.12
− 1.33
(1.49)
(1.47)
(1.47)
(1.15)
(1.56)
(0.87)
Constant
4.72***
6.96***
7.01***
4.75***
11.44***
3.77***
(0.90)
(0.58)
(0.57)
(0.69)
(0.57)
(0.34)
Time-fixed effects
Included
Included
Included
Included
Included
Included
Firm-fixed effects
Included
Included
Included
Included
Included
Included
Observations
3348
3905
3905
3896
3905
3905
R-squared (within)
0.35
0.36
0.36
0.47
0.31
0.47
F-statistic
67.11***
58.49***
58.09***
120.1***
53.39***
61.96***
Fixed effects regression of social and environmental sustainability performance on share repurchases; boldface indicates significance for focus variables
a96 financial sector firms excluded
bRegression excluding financial slack and Tobin’s Q, respectively, to account for high correlation between control variables
cSocial and environmental score for t + 0, t + 1, and t + 2 included as controls
dAggregate sustainability strengths and weaknesses as dependent variables
N = 461 firms (395 when excluding the financial sector; 460 for the case with autocorrelation)
*p < 0.10; **p < 0.05; ***p < 0.01; t + 0 = year of repurchase
Discussion
This article embarks on ethical trade-offs at the sustainability/finance interface by contrasting shareholders’ interest in short-term financial returns with society’s interest in counteracting ecological and social grievances. We have done so by exploring firms’ sustainability orientation and performance in the context of share repurchases. Our findings confirm firms’ environmental value orientation negatively relates to share repurchases in a cubic relation. Managerial incentives, in form of executive stock options, partially attenuate this relationship. Share repurchases, in turn, relate negatively to firms’ future environmental and social performance. These findings have several theoretical and practical contributions.
Implications for Theory
Recent works emphasize the need in corporate sustainability research to embrace normative aspects and a temporal perspective because many resources, whether economic, ecologic, or social, will be non-substitutable and irreversibly destroyed (Hahn et al., 2018; Kim et al., 2018). Corporations ought to move beyond compliance-oriented or business-centered sustainability approaches. As Hahn et al. (2018, p. 241) note, studies on corporate sustainability should assess the tensions among sustainability objectives and “how balancing or even compromising between different sustainability concerns can be justified normatively.” Accordingly, we acknowledge ethical considerations for corporate sustainability in the context of share repurchases in the following.
First, our study finally puts share buybacks and its ethical implications on the agenda of sustainability researchers. Share buybacks are a legal financial instrument with some practical merits, but the rapid increase in buyback volumes has led to this practice falling increasingly into disrepute (e.g., Alsin, 2017; Denning, 2021; Georgescu, 2020; Lazonick et al., 2020; William Lazonick, 2014; William Lazonick & Jacobson, 2019). Starting with the implications for firms’ actual sustainability performance, our results emphasize the negative long-term implications of extensive repurchase activity. Specifically, our findings of negative changes to social and environmental sustainability performance illustrate the thus far underestimated relevance of distribution policies for sustainability research. Firms that use their free cash flow to buy back their own shares have fewer financial resources for reinvestments to facilitate a firm’s sustainable growth (e.g., investing in employees' capabilities or sustainability projects). As more funds are being paid out, purposes with very long-term, intangible returns may fall prey to resource constraints, in particular when governance structures are not designed to support a holistic sustainability approach (Hahn et al., 2015). As Kim et al., (2018, p. 8) note, “the absence of slack resources pushes organizations to focus on the immediate concerns.” Share repurchases can thus significantly undermine corporate sustainable development. Hence, especially from a normative perspective, firms ought to morally consider the long-term consequences of buybacks for sustainability and balance “short-term deliverables with a long-term horizon to enable impact over generations” (Kim et al., 2018, p. 7). In sum, we refine the theoretical considerations of corporate sustainability by outlining that firms have to give up a short-term-focused shareholder primacy norm to achieve “economically prosperous, environmentally healthy, and socially equitable development paths” (Hahn et al., 2018, p. 245).
Second, this study also examines if firms’ communicated sustainability orientation is, under equal financial conditions, reflected in reduced share repurchase activity. In alignment with moral considerations, firms ought to behave as they espouse. We sensitize research on corporate sustainability on the tensions in corporate sustainability, as, for instance, firms with high environmental orientation should curtail their distributions to shareholders to the level required for effective governance. Indeed, we observe significantly fewer buybacks in firm-years preceded by communications heavy on environmental terms for firms outside of the financial sector in a cubic relation. It appears that large, non-financial firms do not merely emphasize environmental motives for impression management, but actually pursue objectives beyond shareholder value. On the one hand, prudent distribution policies give them greater financial scope to implement sustainability projects. On the other hand, consistency between words and strategic decisions may increase stakeholder goodwill and attract investment (Ng & Rezaee, 2015). The non-linear relationship between environmental value orientation and share repurchases also suggests that companies that are just starting to include environmental motives in their communications are not yet willing to adjust their repurchase behavior accordingly.
With respect to the social dimension of corporate sustainability, we do not obtain conclusive evidence of a relationship between social value orientation and share buybacks. The moral consideration for the lack of significance may be versatile. For instance, it may indicate a higher tendency of managers to include mere talk about social matters in their communications, potentially as they consider social impact harder to measure than environmental impact. Another explanation might be differences in shareholder pressure, as shareholders might be more opposed to some social projects as they might not believe in their significant economic returns (Cheng et al., 2014). The lack of significance for our original sample may further point to window dressing in financial firms (Kolk & Perego, 2014), an avenue worth exploring. We infer that sustainability orientation is not yet a reliable indicator of whether firms actually work toward sustainable development. This conclusion is consistent with Unruh et al.’s (2016) findings in their survey, in which 90% of executives called sustainability a corporate priority, 60% had a sustainability strategy, and only 25% had derived a positive business case. Our results further imply that while the susceptibility of text analysis to impression management may constrain its predictive power, it all the more serves to analyze the credibility of firm communications. Stakeholders require early indicators to judge the reliability of firms’ pledges, particularly since ratings and reporting only provide ex-post evaluations (Delmas & Blass, 2010). Our study raises awareness that extensive share repurchase activity may serve as a useful proxy for identifying potentially unreliable sustainability communications.
Third, we elaborate on the role of executives’ compensation incentives and their potential to cause “tension between personal and organizational sustainability agendas” (Hahn et al., 2015, p. 17). Executive options have a partial attenuating effect on the negative relationship between environmental value orientation and share repurchases. Specifically, in firms with high amounts of vested executive options, environmental value orientation does not significantly relate to buyback activity. It thus appears that even in sustainability-oriented firms, stock options retain their appeal to managers seeking secure, short-term payoff (Sanders & Carpenter, 2003). Even the risk of public disapproval and legitimacy loss (Brønn & Vidaver-Cohen, 2009) does not seem to prevent managers from deviating for personal payoff maximization. An explanation for this finding could be that firms relying heavily on executive options still lack the incentives and control systems required to support a focus on environmental sustainability (Kock et al., 2012; Lueg & Radlach, 2016). In sum, the descriptive portrayal of the moderating role of executive stock options allows a normative focus on how managerial compensation incentives should be designed in the context of corporate sustainability. By drawing on the behavioral agency model Martin et al. (2020, p. 597) also note that the ethical implications of equity incentives need further investigation in the business ethics discourse as they have the potential to “align interests or offer perverse incentives”. We add to the debate and raise awareness that companies should not only appeal to managers’ intrinsic sustainable motivation but also ensure that they do not benefit from adverse, myopic behavior.
Implications for Practice
Our findings have also important implications in terms of the ethical consequences of the rapid increase in buyback volumes for business leaders. This study underlines the need for sustainability-oriented firms to integrate their strategy and financial planning—including distribution policies—with triple-bottom-line-based objectives. Firms pursuing sustainability objectives have to balance even more priorities in budget allocation than those focusing primarily on shareholder value (Battilana & Dorado, 2010). Transitions to sustainable business models require governance structures, including managerial incentives, that help balance shareholder returns with social and environmental performance. Following Gao and Bansal (2013), top managers should embrace synergy potentials between those objectives rather than perceive them as mutually exclusive. Sustainability-interested stakeholders, meanwhile, should carefully evaluate the credibility of corporate sustainability pledges. In this regard, buyback activities can serve as signals warning of a distribution policy that might impede sustainability investment. While shareholders can use their voting power to influence managerial decision-making, financial market authorities should install provisions that prevent excessive share repurchases. For example, they could tighten regulation on the use of stock-price-related incentives (Minow, 2019), demand greater transparency on buyback plans, and tie distributions to the achievement of certain sustainability performance levels. Overall, we posit that companies must back up their sustainability-oriented communication with action to achieve long-term strategic goals.
Future Research Directions and Limitations
This study advocates the suitability of share repurchases as a proxy for unsustainable financial policies, given the lack of public data on sustainability investment levels. It may, however, be argued that maintaining repurchase levels does not necessarily signal an inability to engage in sustainability. Share repurchases might even be a useful tool to create an ownership structure supportive of sustainability investment. Recognizing this angle, we focused on a sample of frequent repurchasers and investigated deviations in annual volumes between firms who emphasize sustainability motives and those who do not. Following theory (e.g., Gao & Bansal, 2013), we argue that the implied integration of sustainability with the corporate purpose should be reflected in fewer funds spent on activities purely focused on shareholder returns. We thus expect that reducing buyback volumes would allow firms to enhance their sustainability performance. Yet, we forward the idea of further research on the tensions between short-term and long-term interests. Future research may want to explore in more detail intrafirm trade-offs that create financial barriers to sustainability and its different dimensions.
Our study also hints at the much sought-after, but rarely achieved balance between profitability and sustainability. In corporate sustainability, tensions are paramount and future research may investigate the underlying mechanisms of such sustainability tensions (Hahn et al., 2018). The balancing act of simultaneously contributing to all three sustainability bottom lines needs further investigation. In particular, we observe an interesting negative correlation between financial slack and environmental and social value orientation. There are extant studies advocating a positive relation (Adomako et al., 2021), which raises questions on the role of financial slack. Future endeavors may investigate how financial slack moderates the relationship between sustainability orientation and strategic resource allocations.
Further concerns may result from our measurement of sustainability orientation and performance. For instance, we could not observe a significant relationship between social value orientation and share repurchases. Our data do not allow us to dig deeper to understand why there is no interaction. Future work may use interviews to better understand the underlying specific channels from sustainability orientation to sustainability performance. While providing the highest standard among available sustainability ratings (Semenova & Hassel, 2015), KLD scores are still prone to input inaccuracies. Moreover, KLD only reports binary scores in a varying number of strengths and weaknesses per category, with the risk of some categories being overemphasized. We address this concern by verifying our inferences for each subcategory and for aggregate sustainability strengths and weaknesses and by re-assessing the relationship between share repurchases and Refinitiv Total ESG. Our sample period ends in 2016—but particularly environmental sustainability has recently seen a surge in popularity and public attention. Future research could thus analyze later timeframes.
Acknowledgements
The corresponding author would like to thank Westfälische Wilhelms-Universität Münster and WHU – Otto Beisheim School of Management for their accommodation and support. The authors wish to thank Section Editor Kai Hockerts and three anonymous reviewers for their valuable comments and suggestions on earlier versions of this paper. David Bendig would like to thank the State of North Rhine-Westphalia’s Ministry of Economic Affairs, Innovation, Digitalisation, and Energy as well as the Exzellenz Start-up Center.NRW program at the REACH – EUREGIO Start-Up Center for their kind support of his work.
Open AccessThis article is licensed under a Creative Commons Attribution 4.0 International License, which permits use, sharing, adaptation, distribution and reproduction in any medium or format, as long as you give appropriate credit to the original author(s) and the source, provide a link to the Creative Commons licence, and indicate if changes were made. The images or other third party material in this article are included in the article's Creative Commons licence, unless indicated otherwise in a credit line to the material. If material is not included in the article's Creative Commons licence and your intended use is not permitted by statutory regulation or exceeds the permitted use, you will need to obtain permission directly from the copyright holder. To view a copy of this licence, visit http://creativecommons.org/licenses/by/4.0/.
Publisher's Note
Springer Nature remains neutral with regard to jurisdictional claims in published maps and institutional affiliations.
According to Antolín-López et al. (2016), the following six instruments are mostly used to measure corporate sustainability: Kinder, Lydenberg, Domini (KLD); Dow Jones Sustainability Index (DJSI); United Nations Global Compact (UNGC); ISO 26000; Global Reporting Initiative (GRI); B-Corp.