Tomatoes, onions and potatoes, popularly known as the TOP vegetables, are the three largest cultivated, produced and consumed vegetables in India. Their production has increased dramatically over the years, making India the second-largest producer of all the three vegetables in the world just after China. Recent figures put tomato production at 19 million metric tonnes (MMT), onion production at 22.8 MMT and potato production at 50.2 MMT in 2018–19.
3.1 Introduction
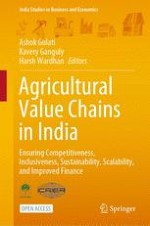
Tomatoes, onions and potatoes, popularly known as TOP vegetables, are the three largest cultivated, produced and consumed vegetables in India. Their production has increased dramatically over the years, making India the second-largest producer of all the three vegetables in the world, after China. Recent figures put tomato production at 19.8 million metric tonnes (MMT), onion production at 22.8 MMT and potato production at 49.1 MMT in TE 2018–19. However, this does not bring much cheer to the vegetable farmers. Reeling under over production, they have been resorting to distress sales, burning their crop or discarding them on the roads. The current market situation begs the question why, despite record levels of production, we have not been able to do justice to our farmers. The answer lies in value chain fragmentation, price volatility, quality and quantity losses and low levels of processing that characterise the market for horticultural crops in India. The prevalence of these problems has weakened India’s potential in the global horticulture trade and also resulted in low returns to farmers. With around 41% share in total vegetable acreage, TOP contributes only 39% to total value of output of vegetables (Fig. 3.1).
Fig. 3.1
Share of vegetables in area and value (TE 2018–19).
Source DoAC&FW, NAS (various issues), MoSPI
×
Unlike cereals and dairy, where procurement and marketing are quite developed, a robust value chain for vegetables is missing. The reasons lie in the perishable nature of the crop, regional and seasonal concentration, and lack of storage facilities. Therefore, it is essential, to make the vegetable value chain more demand-driven, where the farmers do not face the problem of plenty. To overcome these issues, the Government of India had announced Operation Greens (OG) scheme for TOP crops in 2018, on similar lines of the Operation Flood (OF) for milk. With an initial outlay of INR 500 crores, the scheme is being implemented by the Ministry of Food Processing Industries (MoFPI). The OG scheme comprises of both short term and long term components, focusing on price stabilization measures and an integrated development of value chains, respectively. NAFED, as the nodal agency for the price stabilization measure intervenes during a glut situation to move out excess supply from producing regions to storages near deficit consuming regions. For both transportation and storage, 50% subsidy is provided by MoFPI. The long term measure aims to create an integrated value chains for TOP wherein a grants-in-aid of 50% (70% in case of FPOs) is provided to project implementing agencies. The scheme is at the initial stages of implementation and it will be some time before it is able to generate results similar to Operation Flood.
Advertisement
With this backdrop, the chapter analyzes the existing value chains of the three vegetables—tomato, onion and potato and provides policy recommendations to develop more competitive, inclusive, sustainable and scalable value chains with access to finance (CISS-F). The study can be of significant help to policymakers in formulating policies aimed at creating an efficient value chain for achieving the dual objectives of stabilizing prices and delivering fair share to farmers while ensuring the availability of affordable vegetables to consumers. This chapter examines the challenges faced at each stage of the value chain from planting up to final consumption. The methodology followed in the chapter assesses the competitiveness, inclusivity, scalability, sustainability and financial requirements (CISS-F) of the TOP value chain.
3.2 Competitiveness
The competitiveness of the TOP value chain has been assessed in terms of international competitiveness using NPC (Nominal Protection Coefficient) and the efficiency of the domestic value chain, by estimating the farmer’s share in the consumer’s rupee.
3.2.1 International Competitiveness
Tomatoes, onions and potatoes are the largest traded vegetables, globally. While India has remained the number one exporter of onions in the world, it barely exports a fraction of the total global demand for tomatoes and potatoes.
India’s share in global exports of fresh tomatoes, onions and potatoes in TE 2017 was 2%, 20% and 3%, respectively (Fig. 3.2). The total export of fresh and processed form of TOP was valued at USD 755 million in TE 2018–19.
Apart from fresh vegetables, India also exports processed tomatoes (paste), dehydrated onions and processed potatoes. Although India is the largest exporter of dehydrated onions in the world, it is not among the major exporters of tomato paste.
Tomato Exports from India: Problems and Prospects
India exported 268 thousand tonnes of tomato in 2016–17, which declined to 55.8 thousand tonnes in 2017–18, and increased to 105 thousand tonnes in 2018–19. The decline in 2017–18 was due to import bans imposed by Pakistan, the largest importer of Indian tomatoes, as a result of political tensions. The constant rift between the two countries is reflected in the volatile agricultural trade. In TE 2016–17, Pakistan imported 75% of total tomato exports from India, which declined to 46% in TE 2018–19, followed by the UAE at 21%, Bangladesh at 14% and Nepal at 12%. Between 2014–15 and 2018–19, Pakistan imported tomatoes worth USD 29.7 million, i.e, 55% of the tomato exports from India (Fig. 3.3).
Fig. 3.3
Top export destinations for Indian tomato (five year average of 2014–15 to 2018–19).
Source UN Comtrade Database
×
India exported 0.17 million tonnes of tomatoes (fresh and fresh equivalent to paste), which is less than 1% of 20 million tonnes of tomatoes produced in TE 2018–19 (Fig. 3.4). India accounts for about 2% of global tomato exports, occupying 13th position in the world, and is a net exporter of the processed tomatoes (Fig. 3.4). China is the largest exporter of tomato paste in the world, with a 28% share in global exports (TE 2017), followed by Italy (21%) and the USA (13%). The major tomato juice exporters are Germany (15%), Italy (14%) and the USA (11%).
Fig. 3.4
Tomato and tomato products net exports from India.
Source Directorate General of Foreign Trade
×
India’s minimal presence in tomato paste export market can be attributed to higher input costs. China processes tomato paste at much cheaper rates, making it the global leader. Even Indian ketchup manufacturers find it cheaper to import Chinese tomato paste rather than procure from India.
Onion Exports from India: Problems and Prospects
Onions from India have a huge global demand because of its high pungency and year-round availability. India’s onion exports have increased considerably after it was canalised through NAFED and 12 other bodies. India exported 2.42 million tonnes of fresh onions in 2018–19, which was almost 45% more than what India exported in 2017–18 (1.68 million tonnes). However, the trade policy in India is haphazard and makes India’s exports very volatile. With frequent imposition of minimum export prices (MEP) or complete export bans, India is losing its credibility in the global onion export market. This gap in exports from India encourages other nations like Pakistan to increase its exports. The Netherlands, despite not being a major producer, has emerged as a top exporter on the back of their efficient storage and packaging solutions.
The varieties which are popular for exports include the NHRDF developed Agrifound Dark Red and Agrifound Light Red (big onion), Agrifound Rose (small onion), and Agrifound Red (multiplier onion) (NHRDF). Apart from these, Pusa Ratnar, Pusa Red, and Pusa White Round are also popular. The Rose variety of Krishnapuram in Karnataka is premium quality and attracts a higher price than the medium-sized onions from Maharashtra. While India is able to export much of its onions to its neighbours and Gulf countries (Fig. 3.5), exports to European countries is at a nascent stage. European countries prefer the yellow varieties of onion, which are large in size like Tana F1, Arad-H, Suprex, Granex 55, HA 60 and Granex 429. These were developed especially to cater to export markets (APEDA).
Fig. 3.5
Major export destinations for Indian onion (TE 2017–18).
Source APEDA
×
According to APEDA, modern pack-houses for sorting, grading and packing of quality onions are already available at major production centres. Guidelines for the maximum permitted residue levels (MRLs) for identified pesticides, grade designation, and quality development are also in place.
Even for dehydrated onions, India is among the largest exporters in the world along with Malaysia with 27% share each, followed by the USA (12%) and Egypt (4%) (Fig. 3.6). These top four countries account for around 70% of the world’s total dried/dehydrated onion export. Dried onion or dehydrated onion (ITC HS Code: 7122000 Onions, Dried, Whole/Cut/Sliced/Broken/In Powder but Not Further Prepared) is in the form of dried flakes, slices, granules or powder. India has the largest hub of dehydration units for onions in the world. These products are generally exported to Europe, Russia, Africa, and the Middle East countries.
Fig. 3.6
Share in global dehydrated onion exports (TE 2018).
Source UN Comtrade Database
×
Potato Exports from India: Problems and Prospects
India, despite being the second-largest producer of potatoes in the world, is not a big player in potato exports, and accounts for only 2.6% of global potato exports. The corresponding figures for Pakistan and China are 4.5% and 4.1%, respectively. However, India’s potato exports have increased over time. In value terms, India’s potato exports have increased from USD 2.4 million in 2002–03 to USD 63.4 million in 2018–19, peaking at USD 138 million in 2014–15. In volume terms, India’s exports were only 0.37 million tonnes in TE 2018–19, a minuscule proportion of India’s production of over 53 million tonnes.
Potato from India is largely exported to neighbouring countries with nearly 76% going to Nepal (Fig. 3.7). Sri Lanka, Oman, Malaysia, Mauritius, Kuwait, Maldives, Indonesia, and UAE are other important destinations. Pakistan, which imported around 129,000 MT in 2014–15, has not imported any potatoes since then.
As far as imports are concerned, processing companies import tissue culture since bulk imports of potato are banned. This is one way in which high yielding varieties can be made available to Indian farmers. India exports the Kufri Sindhuri, Kufri Jyoti and Kufri Chandramukhi varieties of table potatoes. While the first two are in great demand in Nepal and Bangladesh, the third one is very popular in Afghanistan (Rana 2017).
The Netherlands and Germany together control 54% of the global exports of potato flour, meal, powder, flakes, granules, and pellets.1 In this category, India’s share is only 2% of global exports. At a more disaggregated level, India is the third-largest exporter of potato flour, meal, and powder. However, it needs to be pointed out that India is a net importer of potato starch2 because of the virtual non-existence of the starch making industry in India. China and the European Union are India’s competitors in export of processed potato.
Nominal Protection Coefficients
To compute the nominal protection coefficients (NPCs) for TOP, two price series were taken: domestic price series and international reference price series. Domestic prices have been taken as the weighted average of prices prevailing during the harvesting months of the largest producing states that account for around 60% of national output. For international reference prices, the unit value of exports has been used. International prices include port handling charges but are net of domestic transportation costs, trading, and marketing margins and costs. This indicates the import parity price or the price at which India could have imported. This was done for the importable hypothesis model. For the exportable hypothesis model, port handling charges, domestic transportation, trading, and marketing margins were subtracted from the international price. Prices have also been adjusted for quality. These charges have been estimated as a percentage of the wholesale price based on interactions with stakeholders during the field visit.
For tomatoes, wholesale prices prevailing in Andhra Pradesh, Madhya Pradesh, Karnataka, Gujarat, and Odisha were taken. The computed values of NPC along with the export values for tomato have been shown in Fig. 3.8. The results show that tomato has been always competitive in the international market, yet the export to production ratio has been always low in India. India has not fully utilised its potential of exporting tomato like it has done for onion. There have been huge fluctuations in tomato exports from India, which is the result of import bans imposed on Indian tomatoes by our neighbouring countries, especially Pakistan, due to political reasons. This leads to undue pressure on tomato traders and farmers who are unable to sell their produce when a glut coincides with bans imposed by importing countries. Despite tomatoes being available throughout the year, exports have not picked up. Figure 3.8 also shows how India reached its peak tomato exports during 2013–14, when it exported 4 lakh tonnes of tomato.
Fig. 3.8
NPC and export value for tomato.
Source Authors’ calculation using data from Agmarknet, NHB, DGFT, and Field Study
×
Market Price Differential (MPD), which is the difference between domestic and international prices, has been negative for the entire period of the study (2002–03 to 2018–19), implying that trade policy has been pro-consumer (Fig. 3.9).
Fig. 3.9
Market price differential (MPD) for tomato.
Source Authors’ calculation using data from Agmarknet, NHB, DGFT, and Field Study
×
For onion, we have compiled the average wholesale prices from Agmarknet for the top 3 producing states, namely Maharashtra, Madhya Pradesh and Karnataka, which accounts for around 60% of the total onion production in India. The average price for a financial year is the average of the prices prevailing in the harvesting months of the crop. For Maharashtra and Madhya Pradesh, April and May prices were taken, and for Karnataka, July to November (kharif season harvest months) prices were taken. As international prices for onion were unavailable, we used the unit value of onion exports from India as a proxy for FOB prices. The nominal protection coefficient calculated for onions is consistently less than 1, indicating the export competitiveness of onions from India (Fig. 3.10).
Fig. 3.10
Nominal protection coefficient for importable and exportable hypothesis for onion.
Source Authors’ calculation using data from Agmarknet, NHB, DGFT, and Field Study
×
Figure 3.11 shows the nominal rates of protection (NRP), indicating a consumer bias in trade policies. Market price differential (MPD) for onion is negative for all years studied, which indicates a pro-consumer bias in trade policy (Fig. 3.12). This is evident from the fact that the government imposes minimum export price and other trade restrictions as soon as prices shoot up.
Fig. 3.11
Nominal rate of protection for importable and exportable hypothesis for Indian onion.
Source Authors’ calculation using data from Agmarknet, NHB, DGFT, and Field Study
Fig. 3.12
Market price differential (MPD) for onion.
Source Authors’ calculation using data from Agmarknet, NHB, DGFT, and Field Study
×
×
Due to fluctuations in domestic price, and market arrivals of onions, the Indian government resorts to measures aimed at reducing prices to safeguard the interests of consumers. Hence, Indian trade policy for onion is very unstable. It can range from a complete ban on exports or increasing the minimum export price (MEP) to freeing exports of onion and reducing import taxes. For example, onion exports were prohibited from December 2010 to February 2011 and then, briefly again in September 2011.
Minimum export prices (MEP) have been imposed on onions several times ranging from USD 0 to USD 1150 per MT for the normal variety of onion (Fig. 3.13). Since December 2015, onion exports were free. MEP was again imposed on November 23, 2017, at USD 850 per MT. In the first week of February 2018, MEP was removed as onion prices started coming down. There were a number of policy measures introduced in 2019 by the government to curb retail prices, which crossed INR 40/kg in mid-September and further to INR 50–60/kg. After imposing an MEP of USD 850/MT on September 13, 2019, the government imposed stocking limits on traders and wholesalers. However, when these measures did not cool prices, it banned all varieties of onions from being exported. This frequent imposition and removal of MEP on onions hamper the credibility of India as an onion exporter as high MEP discourages domestic exporting firms from selling their produce overseas. Importing nations resort to buying onions from elsewhere like Pakistan. The imposition of MEP not only destroys India’s credibility as an exporter, it also deprives farmers of higher prices for their produce. A datewise timeline of the imposition of MEP on onions has been shown in Fig. 3.13. The red line shows the MEP imposed on the premium Rose and Krishnapuram varieties of onions from Bangalore, which was always higher than the common variety of onion, before April 2012. Since August 2013, a common MEP was imposed on all varieties of onion.
Fig. 3.13
Timeline for MEP and other trade policies for onions in India.
Source Created by Authors using information from Directorate General of Foreign Trade (DGFT)
×
Another policy concern was the inclusion of onions as an essential commodity under the Essential Commodities Act (ECA) in 2014, which empowered states to take up de-hoarding measures and monitor prices regularly. It was under ECA that the stocking limits were imposed in September 2019 on wholesalers and retailers. However, it proved to be ineffective in controlling the prices, which went beyond INR 100/kg mark in several cities in December-2019. By enacting the amended Essential Commodities Act3 in September 2020, the government paved the way for deregulation of onion prices. Revoking ECA will encourage private investment in storage, thus reducing wastages and further helping farmers to reap benefits of storing their produce during glut and selling off later in the lean season. The benefits of some schemes like the Merchandise Exports from India Scheme (MEIS) was extended to onion in August 2016 to encourage farmers to export in case of low domestic onion prices. This is done by giving subsidy to exporters, when domestic prices are low. However, when there is a shortage of onion in the domestic market, India also imports onions from countries like Egypt, Pakistan, and Iran to meet the shortage.
For potatoes, the domestic wholesale price has been taken as the weighted average of wholesale prices prevailing in Uttar Pradesh, West Bengal, Gujarat and Madhya Pradesh. These four states accounted for around 68.5% of total potato production during TE 2017–18. Since potato prices in Bihar are not readily available because of the abolition of APMC Act, their prices have not been included. Wholesale prices for only the harvesting months of rabi crop (December to March)4 have been considered. The export unit value of potato is taken to be the international reference price, adjusted for domestic transportation costs, marketing margins, and port handling charges. These charges have been estimated as a percentage of the wholesale price based on interactions with various stakeholders, during field visits. NPC values for both exportable and importable hypotheses have remained below 1, indicating potatoes have been generally export competing, except three years (Fig. 3.14).
Fig. 3.14
Nominal protection coefficients for potato at wholesale market level.
Source Authors’ calculation using data from Agmarknet, NHB, DGFT, and Field Study
×
Potatoes were import competing in 2005–06, 2007–08 and 2013–14. The export competitiveness of potatoes increased after 2013–14, leading to a significant jump in potato exports.
Potato has been also subject to a haphazard export policy. As potato forms an important part of the average Indian’s consumption basket, high minimum export prices (MEPs) have been imposed occasionally to prevent the domestic prices of potato from shooting up. This is a clear indication of a consumer bias in trade policy (Saini and Gulati 2017). In July 2016, MEP of USD 360 per tonne was imposed on potato export.5 This policy was changed in December 2016, when the export of potato was permitted without any MEP and prevails till date.6 This perhaps explains why despite being the second-largest producer of potato, India held only 2.4% share in global potato exports in TE 2016.
Market price differential (MPD), which measures the difference between domestic price and international reference price, has been negative in recent years, indicating a pro-consumer bias in trade policy (Fig. 3.15). This is reflected in the imposition of MEPs in fear of rising consumer prices in years when there is a shortage and removing the same in years of surplus production. MEP on potatoes was imposed in June 2014 and removed in February 2015. In July 2016, MEP of USD 360 per tonne was imposed again in fear of increase in domestic price, which lasted until December 2016.
Fig. 3.15
Market price differential (MPD) for potato.
Source Authors’ calculation using data from Agmarknet, NHB, DGFT, and Field Study
×
Of the three commodities, the highest variability in NPC measured using coefficient of variation (CV) was observed for potato at 30%, followed by tomato at 22%. For onion, coefficient of variation was 15%. This implies that there is a higher degree of variation in domestic and international prices for potato and tomato, while onion prices have lesser degree of variation.
3.2.2 Domestic Price Formation (Efficiency)
An imperfect market structure and inefficient value chain for vegetables often lead to volatility in domestic prices as there is high market intermediation between the farmer and end consumer. The costs incurred and margins earned by these intermediaries inflate the prices. As opposed to intermediaries, farmers have rarely benefitted from increased production. The farmer’s share in consumer rupee varies across seasons and geographies. It also depends on the marketing channel or how many intermediaries are involved in the value chain. A direct farmer to consumer marketing channel, for example, a farmer producer company having a retail outlet, will deliver maximum return to the farmer as a share of consumer rupee. A traditional value chain involving farmers with commission agents, traders, wholesalers, and retailers will give farmers the least share. This section analyzes efficiency of both traditional value chain and organized value chain models (Table 3.1).
Table 3.1
Traditional value chain models for analysis of domestic price formation
Model
Crop
Value chain
Traditional
Tomato
Major supplying regions to Delhi through APMC
Onion
Major supplying regions to Delhi through APMC
Potato
Major supplying regions to Delhi through APMC
Potato
Nalanda to Patna without APMC
Organised
Tomato
Processing value chain
Onion
Dehydrated onion value chain
Potato
McCain contract farming value chain
Fruits and vegetables
Farmers to Safal retail outlets
Major producing states and consumption centres for tomatoes, onions and potatoes have been shown in Figs. 3.16, 3.17 and 3.18, respectively indicating the flow from production centres to major consumption centres in metropolitan cities. Regional concentration of production of TOP and consumption throughout the country leads to extreme volatility in prices. The need to transport these perishable commodities from surplus to deficient regions escalates the costs further. Andhra Pradesh, Madhya Pradesh and Karnataka supply their tomato produce to the northern states. Onions are mainly sourced from Maharashtra, Madhya Pradesh and Karnataka. Potato is mainly grown in the Indo-Gangetic plains of northern India with Uttar Pradesh, West Bengal and Bihar being the three largest states, and has to be transported to the southern parts of the country. As shown in the maps, Delhi is one of the major consumption centres for TOP. Arrivals at the Azadpur mandi (regulated wholesale market) for tomato, onion and potato stood at 1.8 LMT, 3.5 LMT, and 4.6 LMT, respectively in TE 2018–19.
Fig. 3.16
Major production and consumption centres for tomatoes in India.
Source Using data from MoAFW
Fig. 3.17
Major production and consumption centres for onions in India.
Source Using data from MoAFW
Fig. 3.18
Major production and consumption centres for potato in India.
Source Using data from MoAFW
×
×
×
Tomato Value Chain
Tomato is grown in most Indian states, but very few states have surpluses that get transferred to other states. Metropolitan cities are the major consumption centres for tomatoes and hence to study farmer’s share in consumer rupee, we have considered Delhi as one of the largest consumption markets for tomatoes. In Delhi’s Azadpur mandi, tomatoes are supplied from different parts of the country. Major supplying states include Maharashtra, Karnataka, Himachal Pradesh, Madhya Pradesh, besides adjoining regions in Haryana, Rajasthan and Uttar Pradesh. Tomatoes from these places are supplied at different points of time making tomatoes available all-round the year in Delhi.
A farmer has a number of options for selling tomatoes. For example, in Karnataka, a farmer has the following options: the traditional wholesale market, HOPCOMS (Horticultural Producers’ Co-operative Marketing and Processing Society Ltd), SAFAL Market, Namdhari Fresh, etc. However, a majority of the farmers still sell their produce through the traditional channel i.e., wholesale market. A recent study by the Indian Institute of Horticultural Research (IIHR) states that 60% of the produce is marketed through the traditional value chain and the rest goes through the other chains of HOPCOMS and SAFAL.
To estimate the farmer’s share in consumer rupee, we have used tomato wholesale prices from major mandis supplying to Delhi—Pimpalgaon (Maharashtra), Kolar (Karnataka) and Solan (Himachal) as well as Gujarat, Haryana and Rajasthan adjusted for their harvesting months and seasonality and taking three-year average of TE 2018–19 (details in Table 3.2). The mandi fees and official commission charges at Kolar, one of the largest tomato mandis in the country, have been used. While these charges are supposed to be borne by traders, the burden ultimately falls on farmers who get a price net of these charges. Data gathered during field visit suggests that the commission fees earned by commission agents and traders are much higher than what is officially prescribed by the APMC. The official commission fee in Kolar mandi including rent for crates and annual licence fee charged by APMC is about 8%. The transportation cost from Kolar to Delhi is about INR 1000/q. Using this, we have calculated transportation cost on a pro rata basis for other mandis. Subtracting the price received by farmers and total cost borne by traders from the wholesale price at Delhi’s Azadpur mandi, we get an approximate value for trader’s margin. The retail price for Delhi has been taken from the Department of Consumer Affairs. All other data on costs have been gathered during field visits. Figure 3.19 shows the markups for the tomato value chain from major producing regions to Delhi.
Table 3.2
Costs and margins of tomato value chain from producing regions to Delhi
Stakeholder
Cost and margin (INR/quintal)
Share in consumer rupee (%)
1. Price received by farmer
1123
32.4
2. Total trader’s cost
498
14.4
3. Traders margin (4-2-1)
387
11.2
4. Delhi wholesale price (Max price from Agmarknet)
2008
5. Semi wholesaler total cost
341
9.8
6. Semi wholesaler margin (10%)
201
5.8
7. Price to retailer
2549
8. Retailer cost and margin
914
26.4
9. Price paid by consumers (Delhi retail price)
3463
100.0
Source Authors’ calculation using data from Agmarknet, DoCA, and Field Visit
Fig. 3.19
Mark ups for tomato value chain.
Source Authors’ calculation using data from Agmarknet, DoCA, and Field Visit
×
Onion Value Chain
To estimate farmer’s share in consumer rupee for onions, we have considered Delhi, which is one of the largest consumption markets for onions. Depending on the season, there is a lot of volatility in the returns and margins of each stakeholder in the value chain. Therefore, we have taken the season-wise weighted average of prices for three years (2016–17 to 2018–19) to calculate price received by farmer. The weights are based on the share of onion arrival in Azadpur mandi from major mandis in Maharashtra (Lasalgaon), Madhya Pradesh (Indore), Gujarat (Mahuva) and Rajasthan (Jodhpur). Retail prices have been taken from Price Monitoring Cell, Department of Consumer Affairs (DoCA), and not from National Horticultural Board, which does not have a standard method of collecting retail prices. As Delhi’s wholesale price is the average wholesale price of onions of all qualities arriving from markets across India, we have taken the average of the maximum prices reported on Agmarknet for Delhi, Maharashtra and MP, which cater to more than 60% of Delhi’s demand for onions.
For trader’s costs, we have relied on data gathered during our field visit to Lasalgaon, the largest onion wholesale mandi. According to information provided by the Lasalgaon APMC mandi, traders need to pay 1% mandi fees to the APMC, which is the main source of income for the mandi. The official rate prescribed by the mandi for commission charges paid by onion traders to commission agents is 4%. The other official charges prescribed by the mandi are as follows:
Total labour cost works out to be INR 70 per quintal. The average transportation cost per quintal per km is 28.4 paise. Using average arrival as weights, we computed the transportation charges from different mandis to Delhi. Transport cost includes fuel and driver allowance. The cost for packing includes cost of the packing material (Jute) at INR 60 per quintal. Other costs include weight loss of (1–2)% within an hour of the auction. Storage losses include 15% weight loss for rabi onions during April–June and 30% during August–September. These figures are for A Quality onions and for average quality of onions, the losses are much higher. There is also 1.5% transit loss while transporting, loading and unloading.
Trader’s margins are Delhi wholesale prices less Lasalgaon wholesale prices and trader’s cost.
Based on the prices, costs and margins given above, the farmer’s share of the consumer’s rupee works out to 29.1% and for retailer’s it is 30.6% (Table 3.3). During a glut, often farmers are not able to cover their cost of production. Figure 3.20 shows the mark ups for the onion value chain from major producing regions to Delhi. The costs and margins of other stakeholders are based on interactions with traders, commission agents and wholesalers. Hence, it is likely that these may not reflect the true margins, due to reporting biases.
Table 3.3
Costs and margins of onion value chain from producing regions to Delhi
Stakeholder
Cost and margin
Share in consumer rupee (%)
1. Price received by farmer (From Agmarknet)
701
29.1
2. Total trader’s cost
417
17.3
3. Trader’s margin (4-2-1)
164
6.8
4. Delhi wholesale price (Max price from Agmarknet)
1282
5. Semi wholesaler total cost
265
11.0
6. Semi wholesaler margin (10%)
128
5.3
7. Price to retailer
1674
8. Retailer cost
150
6.2
9. Retailers margin (10-7-8)
587
24.4
10. Price paid by consumers (Delhi retail price)
2412
100.0
Source Authors’ calculation using data from Agmarknet, DoCA, and Field Visit
Fig. 3.20
Mark ups for onion value chain.
Source Authors’ calculation using data from Agmarknet, DoCA, and Field Visit
×
Potato Value Chain
Agra is the largest potato producing district in India. Delhi as well as the southern states are important markets for potatoes from Agra. Traders in Agra cater to many markets in Maharashtra and cities like Hyderabad, Chennai, Bengaluru, etc. and so on. Arrivals of potatoes are the highest during the harvesting months of December to March, after which potatoes from cold storages arrive in the market. Usually, when a trader buys potatoes from the cold storage, there can be two sorts of arrangements. One, the trader buys at his own risk, in which case the cost of transporting it to the relevant market is borne by him. In this case, it is possible for the trader to make a profit or a loss, depending on the price that he is able to secure. In the second case, the trader just facilitates the transaction; the wholesalers from other states place the order with the trader, who gets a guaranteed commission per quintal. However, during periods of glut, traders also work on fixed commission, because of low demand at the consumption centres.
In Delhi, potatoes mainly arrive from Agra and Punjab. Fresh potatoes from Punjab start arriving in Delhi markets in the second half of November and continue to arrive until February. Fresh potatoes from Agra arrive between December and March, after which potatoes from cold storages are supplied. To estimate the farmer’s share in the consumer rupee, the weighted average (using arrival share in Delhi) wholesale prices during the harvesting months from Agra and Jalandhar have been used for TE 2018–19. Wholesale prices for Delhi have been taken from Agmarknet. Retail prices are a simple average of the prices prevailing in Delhi during the harvesting months of the rabi crop (November to March) for 2016–17 to 2018–19, taken from Price Monitoring Cell, Department of Consumer Affairs (Details in Table 3.4).
Table 3.4
Costs and margins for potato value chain from producing regions to Delhi
Stakeholder
Cost and margin
Share in consumer rupee
1. Price received by farmer
469
26.6
2. Total traders cost
128
7.3
3. Traders margin (4-2-1)
20
1.1
4. Delhi wholesale price
616
5. Semi wholesaler total cost
243
13.8
6. Semi wholesaler margin (10%)
62
3.5
7. Price to retailer
921
8. Retailer cost and margin
844
47.8
9. Price paid by consumers (Delhi retail price)
1765
100.0
Source Authors’ calculation using data from Agmarknet, DoCA, and Field Visit
The potato value chain in Agra is an example of a highly inefficient value chain, where the farmer gets a measly 26.6% of the consumers’ rupee and the retailer appropriates the maximum share (Fig. 3.21). The retailer’s costs and margins together account for a massive 47.8% of the consumer’s rupee. Not only does the farmer not get a fair share of the consumer price, he does not even cover his overhead cost, which includes transportation and labour costs. Currently, even the best price received by the farmer is so low that he is not able to recover the costs of storage. The idea behind storage is to enable the farmer to take advantage of future increase in price.
Fig. 3.21
Mark-ups for potato value chain.
Source Authors’ calculations using data from Agmarknet, DoCA (2018) and Field Visit
×
To estimate the price spread between the wholesale and retail price, we have estimated the farmer’s share in the consumer’s rupee for major metro cities (Table 3.5). It is found that potato prices are the highest in Mumbai, followed by Chennai and the cheapest in Delhi.
Table 3.5
Farmer’s share in consumer rupee in major metro cities
Market
Average prices of harvest months (TE 2017–18)
Farmer’s share in consumer rupee (%)
Agra wholesale price
557
Delhi retail price
1461
38.1
Mumbai retail price
1824
30.5
Chennai retail price
1738
32.0
Source Authors’ calculations using data from Agmarknet and DoCA (2018)
Potato Value Chain: Nalanda to Patna
Nalanda is the largest potato producing district of the third largest potato producing state of Bihar. Potatoes produced in Nalanda (mainly Kufri Pukhraj variety) are consumed mostly in Bihar and Jharkhand. Farmers take a sample of their produce to the mandi (although Bihar repealed APMC law in 2006) where traders quote a price and later purchase the produce from the farmers’ field. Such marketing practices include the presence of commission agents who charge fees from both farmers as well as traders.
Based on figures obtained from field visits and Patna wholesale and retail prices from DoCA, the mark-up of each stakeholder in the value chain has been estimated. There are two scenarios for potato sale: At the time of harvest (Feb 2018) and at cold stores (April 2018). As time-series data for potato prices in Bihar is not readily available, we have used Nalanda wholesale prices from information gathered during field visits. For retail prices, we used DoCA retail prices for Patna. Table 3.6 shows that Nalanda potato farmers get (40–42)% of the consumer’s rupee. However, given the cost of cultivation of INR 480 per quintal (DES), farmers tend to make a loss, especially small and marginal farmers who sell their produce immediately after harvest due to lack of storage facilities. Despite loss in potato cultivation, farmers reported covering the losses through multi-cropping with other vegetables.
Table 3.6
Potato value chain from Nalanda to Patna
S. No
Item
INR per Quintal
% Share
Source
Feb-18
Apr-18
Feb-18
Apr-18
a
Price received by Farmers or traders (in April)
450
700
40.3
42.2
Field visit
b
Traders cost
100
100
Field visit
c
Traders margin
25
30
Field visit
d
Storage cost
80
Field visit
e
Total trader’s cost and margin
125
210
11.2
12.7
(Sum b to d)
f
Wholesaler’s price
575
910
(a+e)
g
Wholesaler’s cost and margin
138
307
12.4
18.6
(h−f)
h
Sale price of wholesaler
713
1217
DoCA
i
Retailers cost and margin
403
440
36.1
26.5
(j−h)
j
Retail price (Patna)
1116
1657
100.0
100.0
DoCA
Source Authors’ calculations using data from (DoCA 2018) and Field Visit
The above analysis for the traditional value chain model shows that TOP farmers get anything from 26.6% to 42.2% on an average. The inefficiency of the traditional marketing channels makes it imperative to have integrated, demand-driven value chains and alternate marketing models that provide higher returns to farmers. The central government announced APMC reforms on many occasions in the past (Model APMC Act 2003, APLM Act 2017). However, not all states have ushered in these reforms. The latest reform undertaken by the government is the Farmers’ Produce Trade and Commerce (Promotion and Facilitation) or FPTC Act enacted by the Parliament in September 2020.7 The Act ensures freedom of choice for sale and purchase of farmer’s produce and transparent and barrier-free inter-state and intra-state trading, bypassing the mandi system. This would also mean that no market fees or cess would be charged on farmer or traders who are not using mandi services. These reforms in APMC will ensure that farmers are able to save the costs of marketing through APMC mandis as well as allow large buyers to directly purchase from farmers and FPOs, without going through the mandi system.
Domestic Price Formation for Organised Value Chain Model
In this section, we discuss a few models of organised value chain for tomatoes, onions and potatoes such as Chittoor tomato pulping industries, Mahuva dehydration industries, Jain Irrigation onion dehydration model, McCain Foods Limited and SAFAL fruits and vegetables. The idea behind studying these value chains is to compare them with traditional value chain models and ascertain which models are more efficient and fetches better returns for the farmer.
Tomato Processing Value Chain
While fresh tomatoes are used as vegetable, topping or in salad form, various value-added products from tomatoes like ketchup, tomato puree, tomato juice, etc. are also popular. Chittoor in Andhra Pradesh is the largest tomato producing district and is also a hub for the tomato processing industry. While these units manufacture tomato paste, various national and international brands like Kissan of Hindustan Unilever, Maggi of Nestle, Del Monte, Heinz, Tops and Cremica are the largest tomato ketchup manufacturers in India. While these products have high household demand, the rise in HoReCa (Hotel, Restaurants and Catering) business has boosted the demand for tomato-based products.
The varieties of tomatoes that are used for processing include 3140 desi tomato, Natti (local) and hybrid tomatoes like Namdhari, Sapata, and Abhinav. For tomato pulping industry in Chittoor, no contract farming with the producers are in place and processors procure their raw material from Kolar or Madanapalle mandi. Contract farming with tomato growers was discontinued long ago because farmers tend to sell their produce in mandis whenever mandi prices are higher than the contract price. However, farmers can bring their produce to the processing centres directly. However, Indian tomatoes have low yields which increase the cost of raw material, making India uncompetitive in processed tomato. Because of high fluctuations in tomato prices in India, processing units are unable to process tomato round the year and process other fruits and vegetables. It is only sustainable for the processors to process tomatoes when tomatoes are procured at prices less than INR 4 to 4.50 per kg. On the other hand, China is able to produce tomato paste at a much cheaper rate because of low cost of raw material and processing. Even Indian manufacturers prefer importing cheap Chinese tomato paste.
The process in a typical tomato pulping unit is as follows. Fresh tomatoes are procured and sent to collection centres and washed. These can be stored at ambient temperature (18 °C for up to 3–4 days) and when it is time to process, stored tomatoes are again washed by machines. These are then sorted and graded manually before being crushed for the final product.
As tomato paste is one-step value addition, it is sold in a B2B model. Manufacturers of tomato ketchup, puree and juice purchase tomato paste from these units for manufacturing final products. Around 8 tonnes of the desi variety of fresh tomatoes is equivalent to 1 tonne of tomato paste and 7.5 tonnes of the hybrid variety is equivalent to 1 tonne of tomato paste.
One kilogram of branded tomato ketchup requires 333 g of tomato paste (30% is tomato paste), which means that it requires 2.5 kg of fresh tomatoes (1 kg of tomato paste requires 7.5 kg hybrid fresh tomatoes). This means if branded tomato ketchup in India is sold for INR 125 per kg and it used 2.5 kg of fresh tomatoes that were bought at INR 4/kg (i.e. for a total of INR 10) for the processor to be financially viable, the farmer’s share is 8% of the consumer price for tomato ketchup. This is because there are actual costs of processing involved.
Onion Processing Value Chain
Fresh onions can be processed into a number of dehydrated forms like onion flakes, powder, granules, etc. However, there is very low demand for these products domestically, as Indian consumers are used to fresh onions. India produces about 75,000 MT of dehydrated onions, which is about (3–4)% of total onion production (1 kg dehydrated onion = 10 kg fresh onions). Processed onions largely cater to the export market (80–85%) and the rest is mostly consumed by the domestic food industry. A majority of the dehydrated onion units in India are located in Bhavnagar district of Gujarat, with a high concentration in Mahuva. These units procure the raw materials (white or red onions) directly from the mandi without engaging in contract farming; they operate for only a few months in a year (February to June) when white onion prices are low. Hence, Mahuva farmers get no extra benefit because of the presence of dehydration units in their area. With low international demand and negligible domestic demand for dehydrated onion products, these units often have a high pile-up of previous year’s stock, making them financially unsustainable.
On the other hand, Jain Irrigation Systems Ltd. (JISL) has emerged as India’s leading onion dehydration company and one of the world’s largest companies. The onion dehydration model of JISL is one of the most successful onion value chain models in India. It has engaged with onion farmers around Jalgaon through contract farming. The total number of farmers engaged in contract farming is about 5000 from areas like Jalgaon, Dhule, Shahada in Maharashtra and even places like Khargone in MP.
JISL provides the following to contract farmers:
Seeds at cost basis at 7 paise/sapling to be directly transplanted in the fields.
Drip irrigation equipment (at trade discount).
Sprinklers.
They also provide extension services to ensure that the specific standards of the company are met. One Jain agronomist (gramsevak) is deployed in each of the villages to provide information on nutrition management, sowing, and harvesting.
The company works with mostly small and marginal farmers. With support from JISL, they not only produce high yielding quality onions, but also get insured against the price volatility.
The price received by the growers is assured by the company before planting. In 2018–19, the price was fixed at INR 5.50/Kg for rabi onions, when the market price is usually lower than the assured price. If the market price is higher than the assured price, then the market price less 60 paise is given to the farmers. For example, if the market price is INR 11/Kg, then they are paid INR 10.40/Kg. In this way, onion contract farmers are able to overcome the risks of price volatility, which their counterparts in Mahuva are not able to.
Potato Processing Value Chain
Among all TOP vegetables, potato has the highest share of processing at around 7%. Potatoes can be processed to make ready to eat products like chips, wafers; ready to cook snacks like potato patty, and French fries or dehydrated products like potato powder. There are a number of national and international brands that are manufacturing potato-based products with contract farmers. For instance, PepsiCo’s Frito Lay is a good example of engaging smallholders to grow potatoes matching international standards. A study by FAO shows that contract farming for Pepsi provides farmers higher margins, proper extension training and assured returns (Punjabi 2015).
In this section, we discuss the value chain model of McCain Foods Ltd. in detail. McCain Foods is the world’s largest producer of French fries and potato specialties. McCain’s products like French fries, potato wedges and patties are marketed in over 160 countries, with global sales of USD 6 billion. In addition, the Canadian group is one of McDonalds’ main suppliers of French Fries. In India, McCain has a world-class potato processing facility in Mehsana, Gujarat.
Seed potato is developed from imported germplasm using a combination of tissue culture, corporate contract farming. Punjab is a preferred location for growing seed potatoes because the prevalent temperature facilitates their growth and prevents aphid infestation (aphid cannot thrive in low temperatures). This ensures production of quality seed, which is then distributed to contract farmers in Gujarat at INR 22–23/kg. The company does not profiteer from the seed business, as the seed is specifically produced for restricted use by the company.
In Gujarat, contract farming takes place in three districts (Banaskantha, Sabarkantha and Mehsana). In 2016–17, the company engaged with around 700 farmers covering an area of 7000 acres. From June to August, the company selects growers who will work with them for the season. It is important to note that the company does not give any advance payment to these farmers. On the contrary, the farmer makes three kinds of payments to the company:
1.
INR 1000/acre at the time of distribution of seed in October. This is non-refundable
2.
50% of the seed cost
3.
A post-dated cheque to recover the seed cost in case the farmer does not deliver.
Although all input costs are borne by the farmers themselves, agronomists and other specialists employed by the company visit the farms at regular intervals to ensure that potato is being grown according to the company’s specifications. In case the farmer does not adhere to company guidelines and the quality of the produce is below a tolerance margin of 1%, the price paid to the farmer is reduced. Beyond 3%, the produce is sent for regrading and this cost has to be borne by the farmer himself. In case the farmer does not deliver the promised crop, there is no legal enforcement of the contract. The company blacklists the farmer and does not work with him in the future.
In 2016–17, McCain procured 83,000 tonnes of potatoes at INR 850–900 per quintal, depending on the variety. This is almost double the price that Agra potato farmers get for their best quality table potatoes. Based on interactions with farmers, the per quintal cost of producing processing variety potato is around INR 665. Item-wise details of costs are provided in Annexure 3.1. Based on an average yield of 321 quintals per hectare, returns ranging from INR 60,000 to INR 76,000 per hectare accrued to the farmers. This meant that farmers, on an average, earned (28–35)% of the sale price under the contract farmer arrangement with McCain (Table 3.7).
Table 3.7
Costs, revenue and returns of McCain farmers in 2016–17—Summary table
S. No
Area under contract farming
7000 acres in Gujarat (~2833 ha)
1
Number of McCain farmers
700
2
Price received by McCain farmers
INR 850–900/q
3
Average yield of McCain Farmers
321 q/ha
4
Revenue earned by McCain farmers (2 * 3)
INR 272,850–288,900/ha
5
Costs of McCain farmers
INR 213,284.5/ ha
6
Returns earned by McCain farmers (4–5)
INR 59,565.5–75,615.5/ha (~28–35%)
Source McCain
In addition to McCain, there are other companies, both Indian (Balaji Wafers) and Multinationals (PepsiCo) that operate in Gujarat.
Fruits and Vegetables Value Chain: SAFAL Model
The SAFAL model of Mother Dairy started as the first-ever fruits and vegetables retail chain in 1988. It aimed to develop direct linkages between farmers and urban consumers on the lines of Operation Flood. However, unlike milk, fruits and vegetables are not homogeneous products and hence, require individual sorting and grading. This makes supply chain management much more challenging. As some amount of weight loss is inevitable in fruits and vegetables, minimising losses due to lack of proper storage facilities is the key to developing a successful supply chain. SAFAL tried to address the issue of lack of proper storing facilities by developing a model in which fresh fruits and vegetables are procured and distributed within a 48-h timeline, not requiring any pre-cooling or specialized storage.
SAFAL is only responsible for the supply of fruits and vegetables from the Mother Dairy’s distribution centres (DC) to its retail outlets. Collecting the produce and bringing it to the DC has been entrusted to farmers’ associations (Fig. 3.22).
Fig. 3.22
SAFAL value chain of fruits and vegetables
×
Farmers are paid the rate which is prevalent at Azadpur Mandi. Since farmers are not bound by legal contract with SAFAL, they have the freedom to decide whether or not to sell their produce to SAFAL. Farmers do not benefit from selling to SAFAL during periods of glut when the prices are low which adversely impacts the farmer-consumer linkage.
SAFAL claims to pay 63.5% share of the consumer rupee to fruits and vegetables farmers (Fig. 3.23). This is better than what farmers get in a traditional value chain, but is still a long way behind the dairy farmers who receive 85% of consumer rupee. SAFAL earns around 15.5% through this whole process and the concessionaire earns 4%. A detailed table on the costs and margins of the SAFAL model of value chain is provided in Annexure 3.2.
Fig. 3.23
Mark-ups for SAFAL fruits and vegetables value chain.
Source Mother Dairy Fruits and Vegetables Private Ltd. (MDFVPL)
×
3.3 Inclusiveness
Indian agriculture is predominantly characterised by smallholdings. Over the years, average farm sizes have been falling and the number of smallholdings increasing. The share of small and marginal farmers has increased from 70% in 1970–71 to 86.1% in 2015–16. These farmers, having an area of less than 2 ha, own just 46.9 of the total landholding. In fact, the average size of landholdings in India is 1.08 ha (DoAC&FW, 2020). Despite this, India has become self-reliant in food production and is the largest producer of many agricultural commodities. Horticulture is one of the fastest-growing sectors in agriculture; total horticulture production was 306.8 MMT in 2017–18 (NHB 2017; DoAC&FW 2018a). Hence, small and marginal farmers have an important role to play in agricultural growth in India. Any agriculture policy without the small and marginal farmers at its core cannot address the issue of inclusiveness. In this section, we evaluate the TOP value chains on various aspects of inclusiveness including that in production, marketing, post-harvest management and contract farming.
3.3.1 Inclusiveness in Production
Horticulture production has been largely undertaken by small and marginal farmers. The short duration, labour intensive crops are more remunerative than cereal crops.
Table 3.8 shows that in India, 82.1% of tomato farmers, 70.4% onion farmers and 86.7% potato farmers are in the small and marginal category. For tomato, the share of marginal and small farmers is around 70.3% in Andhra Pradesh, 61.9% in Madhya Pradesh and about 66.5% in Karnataka. In the case of onions, Maharashtra has 67.9% share of small and marginal farmers, while Madhya Pradesh has 44.8% and Karnataka has around 55%. For potato, Bihar has one of the highest share of small and marginal farmers (96.1%) followed by West Bengal (94.5%) and Uttar Pradesh (86.9%).
Table 3.8
Share of different farmer groups for major crops 2010–11
Crop
Small and marginal
Semi-medium
Medium
Large
All classes
All crops
81.3
11.7
5.9
1.1
100
Vegetables
87.5
8.2
3.7
0.6
100
Tomato
82.1
12.2
4.9
0.8
100
Onion
70.4
18.8
9.4
1.4
100
Potato
86.7
9.4
3.4
0.5
100
Source DoAC&FW 2020, Agricultural Census (2015–16)
For TOP cultivation, the right kind of irrigation, fertilisers, pesticides and credit for inputs are needed. If not constrained by these factors, farmers are free to decide what crops they want to grow. However, as all the three TOP vegetables experience high price volatility due to regional and seasonal concentration of production, the farmer’s cropping decisions can change based on profit trends in the preceding year.
3.3.2 Inclusiveness in Marketing
Vegetable farmers in India face problems in marketing their produce because of the imperfect market structure. There are a number of intermediaries present in the system between the farmer and the end consumer, leading to retail price inflation without commensurate benefit to farmers. There are very few marketing options for a vegetable farmer; they mostly sell through the Agricultural Produce Marketing Committee or APMC mandi. Apart from that, there are very limited options in organised retail, like SAFAL, HOPCOMS and processing units, which directly procure from farmers. When it comes to the export market, there is a decently developed export value chain only in the case of onions as India is the largest (20%) onion exporter in the world; India’s share in tomato (3%) and potato exports (2%) is minuscule.
While some states have taken fruit and vegetable out of APMC Act, some have only reduced or abolished the market fee charged. There are also states that have delisted fruit and vegetable from APMC, but continue charging market fee or cess or service charge (Chand and Singh 2016). A NITI Aayog report ranked states based on an Agricultural Marketing and Farmer Friendly Reforms Index (AMFFRI), an index measuring the reforms and liberalization of APMC mandis in states. Maharashtra, Gujarat, Rajasthan, Madhya Pradesh and Haryana were the top five states in the implementation of various reforms, while Puducherry and Delhi were at the bottom two. Among the top three potato producing states, Uttar Pradesh ranks a distant 13th, West Bengal ranks 19th and because Bihar repealed the APMC Act it was not part of the study. An analysis of marketing reforms undertaken by Uttar Pradesh shows that there is no provision for several farmer-friendly reforms in the UP APMC Act, 2003. For instance, there is no provision for farmer-consumer markets, direct marketing and contract farming in the Act. On the contrary, these reforms are provided for and notified in the Gujarat APMC Act. States that have not adopted the reforms yet should implement these so that farmers are able to reap benefits. The FPTC Act of 2020 announced by the Government of India, makes direct selling, bypassing the mandi system possible.
In primary APMC mandis like Lasalgaon, Kolar and Mahuva, the auction process is between farmer and trader through a commission agent. Upon bringing the produce to the mandi, the farmers participate in an open auction system in which the price of their produce is determined on the spot. After the auction, each farmer gets a receipt in which the farmer’s details, total amount sold and price received are entered and a similar slip is given to the trader. Farmers are paid either through cash, cheque or NEFT, mostly on the same day or within a few days.
As the auction process is open and any farmer can take part in the trading process, APMC mandis are inclusive. The user charge collected by the mandi is the sole source of income for APMC. Some of the mandis like one in Mahuva, Gujarat, introduced farmer-centric schemes and help farmers financially for fencing, irrigation and insurance, making the whole process more inclusive. With Agricultural Produce Marketing Committees (APMCs) enjoying a monopoly due to lack of other marketing channels, the whole auctioning procedure is controlled by powerful traders and commission agents; farmers have virtually no bargaining power. Layers of mandi fees and commission charges are added, increasing prices without any value addition or benefit to farmers (Fig. 3.24). Our field visits to major mandis (Azadpur, Lasalgaon, Pimpalgaon, and Kolar) revealed that actual commissions charged are way above the prescribed charges. Although, officially these charges are levied on buyers, the ultimate burden of commission falls on the farmers.
Fig. 3.24
Commission charges for fruits and vegetables at different mandis across India.
Source Various APMC mandis, DMI
×
Central government through NAFED and state governments procure onion and potatoes or give subsidy to the farmers. However, all farmers are not part of such schemes as there is a lot of paper work involved and the volume of procurement is often inadequate to cover all eligible farmers.
For onions, Lasalgaon and Pimpalgaon are the two largest mandis in India and onions from here are supplied to all parts of the country. Hence, the prices determined here has a cascading effect on onion prices in other markets across the country. Although APMCs have provision for transparent auction process, it is well known that a handful of powerful traders control the entire market. Due to their low bargaining power, small and marginal farmers have no say at what price they want to sell. Hence even though the value chain is inclusive in terms of participation, small and marginal farmers have poor bargaining power and hence are unable to influence price determination to their advantage.
3.3.3 Inclusiveness in Post-harvest Management
The regional and seasonal concentration of potato and onion production poses many problems in the absence of well-integrated value chains. The rise in temperature in the Indo-Gangetic plains after the harvest necessitates transfer of potatoes into cold storages, which are inadequate, inefficient and unevenly distributed. For instance, the largest potato producing state, Uttar Pradesh, has a well-developed network of cold storages, accounting for 40% of total cold storage capacity in India. However, Bihar, the third-largest producer of potato, having 14% share in production, only accounts for about 4% of the total cold storage capacity in India. As on August 31, 2020, India had 8186 cold storages with a capacity of 374 LMT.8
The hub of potato production in Bihar, Nalanda, has only 17 functioning cold storages. At one time, Nalanda had the largest number of cold storages in the country, but the increase in the number of cold storages has not kept pace with the requirement. High rent charges at INR 240 per quintal of potato excludes certain categories of farmers. Small and marginal farmers do not get a chance to store their produce in cold storages as large traders or farmers pre-book their space in advance in the limited number of cold storages available. This questions the inclusivity of farmers in post-harvest management.
Due to lack of storage facilities, high rent of existing cold storages, and the lack of access to cold storages for small and marginal farmers, a large part of their produce is just sold right after harvest. Hence, there is not only a need for more cold storages in the country but also efforts need to be made to make these cold storages more affordable and accessible to small and marginal farmers.
3.3.4 Inclusiveness in Contract Farming
In India, the Model APMC Act, 2003 and Model Contract Farming Act, 2018 provide for contract farming after which a majority of states amended their APMC Act to make a provision for contract farming. However, only 14 states have notified the rules till date. The more recent ‘Farmers (Empowerment and Protection) Agreement on Price Assurance and Farm Services’ or the FAPAFS Act9 enacted by the Parliament in September 2020 is another attempt by the government to legalize contract farming. The Act attempts at putting out a national framework for contract farming for farm services and sale of farming produce between farmers and agri-business firms, processors, wholesalers, exporters or large retailers at mutually agreed remunerative prices.
Contract farming is an alternative marketing arrangement that not only insulates farmers from risk, but also encourages innovation and technology adoption among farmers. Although there exists contract farming in fruits and vegetables, there is scope for further expansion.
McCain Foods Ltd is engaged in contract farming of potato in three districts of Gujarat (Banaskantha, Sabarkantha and Mehsana). All input costs are borne by farmers themselves and there are strict quality norms that farmers have to adhere to. In case of non-adherence to company guidelines or low quality of the produce, the price paid to the farmer is reduced. In case the farmer does not deliver the promised crop, the farmer is blacklisted and cannot enter into future contracts with the firm.
McCain’s contract farming model gives better returns to the farmers compared to what the traditional farmers receive, in the form of assured income especially in times of glut. However, McCain plans to focus on improving yield through mechanization and economizing on supervision costs. In 2017–18, they had planned to engage 600 farmers, eventually bringing down their engagement to 500 farmers in the next few years. Therefore, the McCain model, though financially profitable for farmers, is not as inclusive. However, it is a good example of the success of the contract farming model in providing an assured income to farmers.
PepsiCo’s Frito Lay is a popular example of inclusive contract farming model, where a large MNC has engaged with the smallest of potato farmers in West Bengal and other states. PepsiCo’s 360-degree farmer connect program has transformed the lives of small and marginal farmers across India. The program includes assured buy back, supply of high-quality seeds, advanced technical know-how, loans through SBI and insurance facilities from leading insurance companies. PepsiCo has been engaging with Indian farmers since 2004–05 to produce processing variety of potatoes. Around 45% of these farmers across West Bengal, Maharashtra, Punjab, Gujarat, UP, Karnataka, Bihar, Haryana and Chhattisgarh are small and marginal. However, a few case studies (Kaur 2014; Dutta et al. 2016) conducted on PepsiCo suggest that marginal farmers are not preferred by the firm for contract farming. Even the participation of small farmers is less as compared to the semi-medium, medium and large farmers. As a rule, only farmers with 5 acres, of land or more can be engaged as contract farmers, which excludes marginal farmers. The contracting player prefers to procure through aggregates rather than dealing with individual farmers.
Jain Irrigation Systems Ltd (JISL) entered into a contract with farmers in and around Jalgaon, one of the major white onion growing regions of Maharashtra for their onion processing business. The company provides high yielding variety of white onion seeds at subsidised rates to farmers. The company also takes care of the technological requirements of farmers like drip irrigation systems. Farmers also benefit from the extension services of the company, which are aimed to ensure that the produce meets specified quality standard. A case study by the FAO has shown that the services provided by JISL to its contract farmers also contribute to mitigating the various risks faced by onion growers (Punjabi & Mukherjee 2015). The study has compared farmers associated with traditional value chain and those working with JISL on various parameters and concluded that contract farmers in JISL benefit from higher margins due to higher productivity and lower price risk due to the minimum guaranteed price. Because of these benefits, small and marginal farmers have an incentive to join the supply chain. JISL works with farmers on both ends of the value chain providing them with inputs like fertilisers, seeds, micro irrigation systems, and extension services, and finally purchasing their raw produce for processing.
Although contract farming has many benefits as farmers are able to access technology, credit, marketing channels and information with low transaction costs, there is a preference for large and medium farmers over small farmers, who have higher access to capital and greater risk taking ability. Technology adoption is easier for large farmers. As some of the requirements of contract farming makes the participation of small and marginal farmers difficult, such impediments can be overcome by organizing them into collectives like FPOs.
3.4 Sustainability
The consumption of fruits and vegetables has increased rapidly over the years in India. According to the 68th round of NSSO survey, monthly per capita consumption of tomato, onion and potato has increased by 74%, 50% and 48%, respectively in rural areas and by 52%, 32% and 41%, respectively in urban areas between 2004–05 and 2011–12. During 2011–12, NSSO reported monthly per capita consumption of tomato at 586 g, onion at 842 g and potato at 1.965 kg in rural India and at 806 g, 1.162 kg and 951 g respectively in urban India (NSS 61st Round 2007; NSS 68th Round 2014). Among vegetables, potatoes, onions and tomatoes are the three largest consumed vegetables in both per capita quantity and value terms. In order to cater to ever-increasing demand, TOP value chains should not only be financially sustainable for farmers, processors and other stakeholders but should also not put undue pressure on the environment. In this section, we evaluate the TOP value chains on financial sustainability and environmental sustainability.
3.4.1 Financial Sustainability
While there has been a dramatic increase in the production of horticultural crops in India, market inefficiency and lack of well-integrated value chains are a key impediment to farmers benefitting from these record levels of production. Recent market conditions have served as a reminder that a bountiful monsoon and a bumper crop are not synonymous with increased farm incomes. Newspaper reports have been highlighting the pitiable condition of tomato, onion and potato farmers, who have been forced to resort to distress sale or even dump the crop on the roads because the price offered was way lower than the cost of cultivation. A look at the average wholesale and retail prices of both potato and onion along with the corresponding cost of production data shows that farmers are perpetually subject to the vagaries of the “boom and bust cycle” (Figs. 3.25 and 3.26).
Fig. 3.25
Onion: cost of cultivation, wholesale and retail price.
Source Cost from DES and NHRDF, Retail price from DoCA, Wholesale price from Agmarknet
The dotted lines give the cost of cultivation. When the price received by a farmer is less than the cost of cultivation, farming of a particular crop becomes financially unsustainable for him.
Fig. 3.26
Potato cost of cultivation, wholesale and retail price.
Source Cost from DES and NHRDF, Retail price from DoCA, Wholesale price from Agmarknet
×
×
Sustainability of Tomato Farming in Kolar
Even though there has been an improvement in the production of tomatoes due to introduction of hybrid seeds, marketing and processing of tomatoes, efforts to contain volatility in tomato prices have not been successful. Almost entire production of tomatoes in India is supply and not demand-oriented leading to large fluctuation in prices. If a particular year was profitable for tomato cultivation, then a majority of farmers cultivate tomatoes the following year, resulting in glut. This is due to the absence of real-time season-wise data on acreage, which may be used to predict price movements. If farmers have real-time data and can be advised on the prospects of a particular crop, they will have a better idea of what to cultivate based on market demand conditions. The decision to cultivate a particular crop should be demand and market-driven and not supply-driven.
Kolar is the second-largest tomato mandi in India after Nashik and here tomatoes are grown in all the three seasons (rabi, kharif and summer (early kharif)). This makes it an important mandi for tomatoes in India which supplies tomatoes to Andhra Pradesh, Tamil Nadu, Delhi and all the way to Bangladesh and Pakistan. Data on cost of tomato production is taken from Indian Institute of Horticulture Research, Bengaluru. Price data is the season-wise weighted average for TE 2017–18 for the harvesting months. Benefit-cost ratio estimated shows that tomato cultivation is profitable in Karnataka as returns are much higher than costs (Table 3.9).
Table 3.9
Cost and returns for Karnataka Tomato farmers
Cost and returns for Karnataka tomato farmers (INR per Quintal)
S. No
Item
TE 2017–18
1
Cost of production
183
2
Overhead cost
215
3
TOTAL COST incurred by the farmer (1 + 2)
398
4
Price received by farmer
1355
5
Returns earned by the farmer
957
6
Benefit-Cost Ratio (BCR)
3.4
Sources Cost of Cultivation data from Mysore et al. and Price data from Agmarknet
Sustainability of Onion Farming in Nashik
According to farmers in Lasalgaon, cultivation of onions is profitable in some years, and unprofitable in others. This is because prices are very volatile and the farmer has no idea what price he will receive before the auction. For this reason, a farmer also grows corn, soybean and grapes to reduce the risk involved in onion cultivation. According to farmers, their average cost comes out to INR 700–800 per quintal if only labour, fertiliser, seed, transplanting and harvesting costs are included. However, if electricity and self-labour are also included, then the cost rises to INR 1000–1100 per quintal. As per cost of cultivation data provided by NHRDF, the average cost of cultivating a quintal of kharif onion in Maharashtra is INR 844 per quintal and INR 793 per quintal for rabi onions. The detailed break up of cost of production for both kharif and rabi onions in Maharashtra is given in Annexure 3.3.
Apart from the cost of production, a farmer incurs labour and transportation charges for bringing the produce to the mandi. Unlike potato farmers, onions farmers incur no charges for storage as most of them have their own storage structures. Transportation charges for bringing the produce to the market vary between INR 40 per quintal and INR 60 per quintal, depending on the distance from the farm to the mandi. Prices in the Lasalgaon market are very volatile. During rabi 2017–18 (April–May), the average price in Lasalgaon was INR 472 per quintal. During kharif 2017–18, farmers received an average price of INR 2566 per quintal and during late kharif, the price received by Lasalgaon farmers was INR 1762 per quintal. Hence, to estimate farmer’s share, we have calculated season-wise average prices and costs for TE 2017–18. The farmers earn higher profits during the kharif season during the months of October to December, when the stored rabi season is out of stock and fresh kharif crops arrive in the market.
It is clear from Table 3.10 that the returns to farmers are very volatile and there are high chances of negative returns during the rabi harvest period, when the market is flooded with fresh arrivals. The opposite happens when the kharif onions start arriving in the market. However, due to the inefficiencies present in the traditional onion marketing channel, and the cost and margins of various stakeholders, the benefit of the increase in kharif onion prices may not really translate to higher incomes for farmers.
Table 3.10
Lasalgaon onion farmer’s cost, price received and returns
Components
2015–16
2016–17
2017–18
TE 2017–18
TE 2017–18
R
K
LK
R
K
LK
R
K
LK
R
K
LK
All-season
Cost of Production
802
762
762
793
844
844
934
852
852
843
819
819
835
Transportation and labour cost
50
50
50
50
50
50
50
50
50
50
50
50
50
Total cost
852
812
812
843
894
894
984
902
902
893
869
869
885
Average price received by farmer
1118
2130
909
768
722
549
472
2566
1762
786
1806
1073
997
Profit
266
1318
97
−75
−172
−345
−512
1664
860
−107
937
204
112
Benefit-cost ratio (BCR)
1.3
2.6
1.1
0.9
0.8
0.6
0.5
2.8
2.0
0.9
2.1
1.2
1.13
Source Authors’ calculation using data from NHRDF, Agmarknet and Field Visit
Note R: Rabi, K: Kharif, LK: Late Kharif
Sustainability of Onion Dehydration Industry in Mahuva
Mahuva, a small coastal town in Bhavnagar district, around 265 km from Ahmedabad is the largest onion dehydration hub in India. Mahuva has around 130 dehydration plants (110 in Mahuva and the rest around Mahuva) engaged in processing onions, garlic and other vegetables. However, onion dehydration is the main money-spinner for these plants as it accounts for 90% of the revenue. Mahuva is also the largest white onion growing region in India.
Since the middle of 2000s, Mahuva became the hub of dehydration industry in India. The industry flourished in Mahuva because of support from the state government in terms of their industrial policy, easier process for setting up industries and subsidies and grants provided by the state government to agro-based industries in Gujarat.
The minimum capacity is 6 tonnes per day per plant in Mahuva and the average ranges between 7 and 8 tonnes per day. This capacity is way below the capacity of Jain irrigation (JISL), which is the largest dehydration plant in India. The total capacity of all Mahuva units is around 1.25 lakh tonnes annually and the total value of dehydrated onion is around INR (750–800) crore. Despite so much potential, the domestic market for dehydrated onion in India is negligible. With 85% of production exported, the industry caters mainly to overseas markets, primarily Europe, Russia, Africa and Middle East countries. Yet, it faces challenges on many fronts due to inefficient trade policies of both the Indian government as well as governments of importing countries. Lack of awareness about dehydrated onions among domestic consumers has restricted domestic demand. Another challenge the industry faces is excess supply, resulting in low prices of the finished product. All these factors threaten the sustainability of dehydrated onion business. According to some media reports10 and field visit to Mahuva, a majority of the dehydration plants are on the verge of closure. Even when the quality of the finished product is good, prices are not competitive and the benefit of dehydrated onions is going to foreigners. The Ministry of Commerce and Industry had reduced transport assistance under the MEIS scheme from 7% to 3%. This illustrates the unsustainability of dehydration units which have been driven by government subsidies and not actual demand of dehydrated onions.
Sustainability of Potato Farming in Agra
In TE 2014–15, 1.48 million tonnes of potato were produced in Agra. It is a major hub from where potatoes are sent to markets across India, especially to Maharashtra and the southern states like Telangana, Andhra Pradesh, Tamil Nadu and Karnataka. Owing to a well-developed network of cold storages, almost 90% of the potato produced in Agra is stored in cold storages and the rest is sold immediately after harvest. The farmers store their potatoes in cold storages by the end of March. The cold storage effectively plays the role of the marketplace, where traders from Uttar Pradesh and other states converge to buy potatoes and then sell to wholesalers in various states. The cold storage owner thus becomes a key intermediary in the potato value chain (Reardon et al. 2012).
Farmers in Agra reported costs as high as INR 700–800/quintal. However, according to the more conservative estimates provided by the National Horticultural Research and Development Foundation (NHRDF), the estimated cost of production of potato in Uttar Pradesh for 2016–17 was INR 480/quintal. The average yield considered by NHRDF was 275 quintals per hectare. Adjusting that to 240 quintals per hectare (as per NHB statistics and field inputs), the cost of production comes out to be INR 551 per quintal. For a detailed break up of costs, see Annexure 3.4.
Table 3.11 gives an overview of the average returns earned by Agra potato farmers who sell their produce just after harvest (in TE 2017–18). Farmers who sell their produce just after the harvest incur labour and transportation costs averaging around INR 50/qunital. As 2016–17 was a glut year, the average returns were negative for TE 2017–18.
Table 3.11
Agra Potato farmers’ costs, price received and returns
Farmers who decide to wait and sell their produce after the harvest months have to incur the cost of renting a cold storage from the end of March to the end of November. The cold storage charges are INR 220 per quintal (the rate for 2017–18 season). This charge is fixed for the season, irrespective of the duration for which the crop is actually stored. The cold storage owner also provides financing to the farmer, based on mutual trust. The farmer pledges the potato stored in the cold storage or promises to store after harvest, on the basis of which he borrows money. The finance is usually given for around 6–8 months, at a rate of 2% per month. Taking into account all the above-mentioned costs, the total cost incurred by the farmer comes out to be INR 787 per quintal.
The price received by the farmers in June 2017 (when the field visit was conducted) ranged from INR 400–600, depending on the quality of potato. When the second visit was conducted in September 2017, the prices had dropped even further, to INR (150–400) per quintal. On the back of a bumper harvest and falling potato prices, the Ministry of Agriculture and Farmers’ Welfare announced in April 2017 that it would procure a maximum of one lakh tonnes under the market intervention scheme (MIS) through a state agency.11 The purchase was to be made at INR 487 per quintal. Additionally, INR 121.75 per quintal or the actual overhead expenses (whichever is less) was also to be paid for including transportation, mandi tax, godown charges, etc. But with the cost of production at INR 787 per quintal, the price offered under MIS was hardly appealing to the farmers and no farmer we interacted with sold at this price. They preferred to wait until November and see if market prices improved.
3.4.2 Environmental Sustainability
Food security has become a sustainable development issue in India; hence, it is important that we give importance to crops that use fewer resources and are cost-effective to grow. Above all, crops should not put undue pressure to the environment, i.e. it should be environmentally sustainable.
Water Usage
TOP vegetables are relatively less water-intensive as compared to cereals and sugarcane (Table 3.12). There is no serious threat to the water table in the tomato belt (Andhra, Karnataka, MP), onion belt (Maharashtra (Nashik), MP, Karnataka) and potato belt (UP, West Bengal, Bihar), as mentioned in the Central Ground Water Body’s reports (CGWB, 2014). However, four talukas of Nashik district fall under semi-critical category in terms of ground water resources, which means there is no further scope for ground water development. Use of drip irrigation or sprinklers can reduce water usage to a great extent in areas where it is necessary and viable. Even though the use of sprinklers is in wide use for tomato cultivation, especially in Andhra Pradesh and Karnataka, its use in onion (except in Maharashtra) and potato cultivation is limited. The Central Ground Water Board in its report on Aquifer Map and Ground Water Management Plan (CGWB, 2018) states that micro irrigation techniques in the cropped area under onion have the potential to save water at 0.26 m per km2. Traditional cultivation practices including flood irrigation are not sustainable and should be replaced by micro irrigation systems. Contract farmers engaged with private companies like McCain, PepsiCo and Jain Irrigation have been able to improve productivity by using micro irrigation system. All the farmers working with McCain have either drip or sprinkler irrigation systems installed in their fields. This is a mandatory condition imposed by the company. This bodes well for environmental sustainability as these micro irrigation methods economize on water use by generating savings of (30–50)% and facilitate 25% savings on fertilisers (ICAR-Central Potato Research Institute 2015). If micro irrigation is adopted by traditional farmers as well, it will not only be beneficial for them but will save a lot of water.
Table 3.12
Water requirement and number of irrigations for potato and onion
Water requirement of different crops
Number of times irrigation required for onion and potato
Crop
Water requirement (mm)
Season
Onion
Rice
900–1300
DOGR
NHB
Wheat
300–400
Kharif
5–8
8–10
Maize
450–650
Late Kharif
10–12
12–15
Sugarcane
1800–2400
Rabi
12–15
15–20
Cotton
650–900
Potato
500–700
Season
Potato
Onion
350–550
Rabi
8
Tomato
600–800
Source Agropedia (2018),DOGR (Directorate of Onion and Garlic Research), ICAR and NHB
Another important issue is that of ‘virtual trade of water’, which refers to the import and export of hidden water in the form of commodities. India is a net exporter of water with food grains accounting for most of its export. India’s major exports are rice, cotton, sugar and soybean, all of which are water-intensive crops. China, on the other hand, is a net importer of water as it imports water-intensive soybeans, cotton, meat and cereals and exports fruits and vegetables, and processed food. Promoting the cultivation of vegetables, which are not water-intensive, will go a long way in promoting sustainable use of water in Indian agriculture.
Fertilisers and Pesticides
Sustainable agriculture practices minimize agricultural inputs while increasing productivity and profitability. Research institutes for tomatoes, onions and potatoes (IIHR, DOGR, NHRDF and CPRI) have recommended balanced and sustainable use of fertilizer and pesticides. However, farmers often use excessive amounts of fertilizer and pesticides in the hope of greater returns, resulting in high pesticide residues in the product. In general, TOP crops do require manure and fertiliser, but the quantity depends on the variety, soil type, region, season, etc. Onions that yield 300 q/ha removes 73 kg nitrogen, 36 kg phosphorus and 68 kg potassium. Potatoes require higher amounts of fertilizer than onion—120–150 kg N, 45 kg P205 and 100 kg K2O per hectare (NHRDF). Fertilizer and pesticide use in excess of recommended levels is a risk to the environment. In fact, organic vegetable farming with multi-cropping and the use of vermicompost should be encouraged.
Organic Waste Disposal Mechanism
According to a report by ICAR-CIPHET, the overall harvest and post-harvest losses in the case of potato ranged from (5 to 8)% and for onions from 5.49% in Gujarat to 12.72% in Maharashtra and other western hilly and plateau regions. The national level average was reported to be 6.05%. The report further states that the storage loss has reduced considerably owing to the development of cold storage networks, most of which are used for storing potatoes (ICAR-CIPHET 2015). However, other studies consider the ICAR-CIPHET estimate to be an underestimate. According to the report by the Committee on Doubling Farmers’ Income (Volume III), total post-harvest losses in the case of potatoes from the time of harvest to the wholesale point range from 18 to 26% (Committee for Doubling Farmers’ Income 2017). CPRI estimates 16% wastage along the entire potato value chain (ICAR-Central Potato Research Institute 2015). An ASSOCHAM-MRSS India study on cold chains in India states, “On an average, about 30–40% of horticultural produce gets wasted annually in India due to lack of cold chain infrastructure which includes both storage and transportation facilities” (ASSOCHAM-MRSS 2017). In India, except for a few pockets of potato and onion production, farmers have no or little access to cold storage for potato and improved storage structures for onion. Apart from post-harvest losses, there is also a lot of wastage at the marketing stage due to spoilage. While some APMC mandis recycle this waste to produce manure, the capacity is limited. Hence, there is an urgent need to set up vegetable compost units inside the mandi complex. This will not only enable production of organic manure but also bio gas. Various farmer producer organizations or trader’s associations should also be involved.
3.5 Scalability
There have been structural changes in Indian agriculture with the composition of agricultural output shifting from traditional food grains to high-value products because of increasing demand. The Indian food consumption basket has become increasingly diversified and expenditure on fruits, vegetables, milk, eggs, meat and fish, and beverages and processed food is rising, leading to changes in cropping pattern in the country (Sharma and Wardhan 2017). The composition of India’s export basket has also diversified from traditional products to horticulture, livestock, and processed products.
In India, area under horticultural crops as a proportion of the gross cropped area (GCA) has increased from 9.59% in TE 2004–05 to 12.12% in TE 2014–15. Area under vegetables, as a proportion of the total area under horticultural crops was around 39.5% in TE 2014–15, up from 35.1% in TE 2004–05.
3.5.1 Scalability of Area and Production
India’s tomato production increased almost five times from 4.2 million tonnes in 1991–92 to 19.4 million tonnes in 2018–19 as did the production of onions from 4.7 million tonnes to 23.5 million tonnes. Potato production approximately tripled from 18.2 million tonnes to 53 million tonnes (Figs. 3.27, 3.28 and 3.29).
Although overall production has been increasing, farmers tend to decrease their crop acreage if the previous year has not been profitable. For example, tomato production declined by 13% in 2014–15 compared to the previous year. There have been decline in onion acreage every second or third year. This shows how TOP cultivation is risky for farmers and their profitability volatile. Interactions with farmers during field visit confirmed this trend. Hence, although the production has scaled up at the macro level, it is difficult for farmers, especially small and marginal farmers, to scale up cultivation of these crops because of market uncertainties.
In order to decompose the growth of tomato, onion and potato production into area and yield effects, we have used time-series data from FAOSTAT (from 1960 to 1990) and the Ministry of Agriculture (from 1991 onwards). Compound annual growth rates (CAGR) were calculated using the ‘LOGEST12’ function of MS Excel for area, production and yield for tomato, onion and potato over six decades starting 1960s.
It is clear from Table 3.13 that most of the growth in production has come from expansion in the area under cultivation and not growth in yield. The factors that have driven TOP production were the launch of the Integrated Development of Vegetables by Ministry of Agriculture, technology developed for micro irrigation systems, availability of quality seeds in adequate quantity and technology dissemination among farmers. Area expansion and production of TOP crops in non-traditional areas and in different seasons increased overall availability throughout the year.
Table 3.13
Compound Annual Growth Rates (CAGR) of Area (A), Production (P) and Yield (Y)
Decade
Tomato CAGR (%)
Onion CAGR (%)
Potato CAGR (%)
A
Y
P
A
Y
P
A
Y
P
1960s
2.9
0.4
3.3
4.9
0.6
5.5
3.3
3.1
6.6
1970s
11.2
0.3
11.6
4.5
−0.8
3.7
5.0
4.4
9.6
1980s
5.5
6.2
12.0
2.7
0.5
3.2
2.8
2.3
5.1
1990s
5.7
1.4
7.1
3.5
−3.5
−0.1
1.6
1.8
3.4
2000s
5.6
2.2
8.0
8.8
5.5
14.7
4.6
1.4
6.1
2010s
−2.7
4.1
1.3
4.0
0.9
4.9
2.2
0.2
2.4
All
5.6
1.9
7.7
4.3
0.7
5.1
3.2
2.1
5.3
Source Authors’ calculation using data from FAOSTAT (2018) and DoAC&FW (2018a)
We have compared the changing constituents of major TOP producing states in terms of acreage & production over a 10 year period in Figs. 3.30 and 3.31. While, Andhra Pradesh remained the largest tomato producing state in the last 10 years, Madhya Pradesh emerged as an important tomato producer. Karnataka has been overtaken by Madhya Pradesh as the second-largest onion producing state after Maharashtra. This is mainly due to the tremendous increases in onion yield in Madhya Pradesh. In fact, there has been a massive increase in horticultural crops, especially vegetables, in Madhya Pradesh in last 10 years. There is need to scale up vegetable production further in non-traditional areas to reduce regional concentration. There has been a tremendous increase in area and production of potato in Gujarat and Madhya Pradesh. The Deesa region of Banaskantha is among the largest potato growing areas in India. Potatoes were always grown in this semi-arid region of Gujarat, but the yields have improved substantially with use of micro irrigation system. This region is the main potato supplying region for Balaji wafers and McCain processing units in Gujarat. Banaskantha district in Gujarat is now the largest potato producing district of India, followed by Agra. It is also the third-largest district in terms of area under potato after Muzaffarpur and Agra. There has been a considerable decline in the area and production of potato in Punjab between 2000 to 2010s. Once an important state for potato, Punjab at present does not even figure among the top five producing states. However, it has maintained its position as the largest supplier of potato seeds.
Our analysis suggests that there is an immediate requirement for more cold storages for potato in India especially in states like Bihar. Even for onion, DOGR studies suggest that cold storages are capable of reducing losses to less than 5% for onions. However, cold storages are not popular for storing onions because of the following reasons:
Initial cost of setting up infrastructure and cost of operation are huge as compared to scientific chals
It requires continuous supply of electricity
There are bio chemical changes as soon as onions are taken out of the cold storages. Sprouting and rotting begins in onion bulbs within an hour of taking them out of the cold storage because of the difference in temperature.
However, to stop sprouting and rotting, onion bulbs may be treated with gamma irradiation rays before keeping them in the cold store and taken out in a controlled temperature from the cold store. If these steps are followed, sprouting and rotting will not take place. Since the losses will decline to less than 5%, the high construction and maintenance cost will be offset and ultimately it will be profitable. Hence, cold storage may be considered even for storing onions in metropolitan cities near irradiation plants.
3.5.2 Scalability of Exports
Despite being the second-largest fruits and vegetables producer in the world, India has a meagre share in global exports. In fact, just about (1–2)% of total production of fruits and vegetables are exported (Table 3.14). Also, exports are dominated by onions, mangoes and grapes.
Table 3.14
Fruits (F) and vegetables (V) exports as share of production
Year
Production (MMT)
Exports (MMT)
% Share of Exports to Production
V
F
F&V
V
F
F&V
V (%)
F (%)
F&V (%)
2010–11
147
75
221
1.7
0.4
2.1
1.1
0.6
1.0
2011–12
156
76
233
2.0
0.5
2.5
1.3
0.6
1.1
2012–13
162
81
243
2.3
0.5
2.9
1.4
0.7
1.2
2013–14
163
89
252
2.3
0.5
2.8
1.4
0.6
1.1
2014–15
167
90
256
2.0
0.5
2.5
1.2
0.5
1.0
2015–16
169
90
259
1.9
0.6
2.4
1.1
0.6
0.9
2016–17
178
93
271
3.6
0.8
4.4
2.0
0.9
1.6
2017–18
184
97
276
2.3
0.7
3.0
1.2
0.7
1.1
2018–19
186
99
284
2.9
0.7
3.7
1.6
0.7
1.3
Source Compiled using data from Horticulture Statistics and APEDA
Onions account for more than 50% of the total fruits and vegetables’ export. However, despite a rising trend in onion production in the country, onion exports have not increased at the same pace (Fig. 3.32). This is because of the trade-distorting policies of the Indian government ranging from bans on exports to imposing minimum export prices, adversely affecting overall onion exports from the country.
Fig. 3.32
Scalability of onion exports.
Source Using data from Directorate General of Foreign Trade and Horticulture Statistics Division
×
The Agriculture Export Policy (AEP)13 prepared by the Department of Commerce aims to double agricultural exports from USD 30 billion plus to USD 60 billion plus by 2022 and to USD 100 billion in a few years. It envisages an increase in present exports of dehydrated onion and other fresh and frozen vegetables from the level of USD 207 m to USD 400 m in the next three years. Even though the policy document discusses how trade policy instruments like export bans or imposition of MEPs are used for correcting short term inflationary conditions and affects India’s image as a reliable exporter, it does not recommend complete removal of these policies for fresh onions and potatoes. Except for few processed agricultural products and organic products, exports of onions and potatoes will continue to be restricted as the need arises.
The policy has identified 50 export clusters that are unique product-specific districts that will be promoted for agricultural exports. For onion, the identified districts are Nashik in Maharashtra, and Indore, Sagar and Damoh in Madhya Pradesh. For the premium rose variety of onion, the two districts from Karnataka, Bangalore Rural and Chikkaballapura, have been identified. Similarly, the largest potato producing districts from Uttar Pradesh, Gujarat, Punjab and Madhya Pradesh will be developed for potato exports (DoC 2018). West Bengal and Bihar, which are second- and third-largest potato-growing states, have been excluded from the list of clusters. The policy, which seeks to develop an export-oriented value chain for several agricultural commodities including onions and potatoes, will go a long way in boosting the exports of high value agricultural products.
Box: Scaling Up of SAFAL Model
Mother Dairy started its fresh fruits and vegetables operations through their SAFAL chain of outlets in 1988 in Delhi. Like ‘Operation Green’, the SAFAL model too was based on the success of Operation Flood. Although the milk marketing model of Mother Dairy was successful, it did not succeed as much in the case of fruits and vegetables.
Today, SAFAL has over 400 outlets in Delhi NCR and a few outlets in Bangalore (NCCD 2017). The share of SAFAL in total supply of fruits and vegetables in Delhi NCR is just about 4%. This share has been almost the same for the last many years. By contrast, the Mother Dairy milk chain, which it tried to emulate; accounts for 66% of the total branded milk supply in Delhi. A majority of Delhi households still rely on their local vendors for fruits and vegetables, which are subject to large scale intermediation.
The number of farmers who are supplying their produce to SAFAL is 8000, which is insubstantial. In over 30 years of SAFAL’s existence, it has not succeeded in expanding to any city other than Bangalore. In Bangalore, SAFAL adopted an auction system with no direct retailing, which has not been as successful as planned. Over the years, SAFAL introduced a varied range of products from frozen peas, juices and other daily need items like cooking oil and pulses. Recent introductions like frozen jackfruit and dehydrated onion, however, have not been successful.
3.6 Access to Finance
Cost-effective, easy and inclusive access to finance is crucial for any efficient value chain to function. Value chain financing has been an issue of concern, particularly for small and marginal farmers. Farmers become indebted to money lenders, who charge exorbitant interest rates, throughout their life. While there has been some easing in terms of accessibility to finance, this has been confined to only medium or large farmers in well off states. Field visits undertaken during the study revealed vast variations in access to finance across the country.
3.6.1 Financing of Farmers
Tomato Farmers in Kolar, Karnataka
As crop-wise credit sources data for farmers are not readily available, data from interactions with stakeholders during field visits were used to analyze existing sources of credit for different stakeholders. Our field visit to Kolar suggested that 80% of small and marginal farmers source credit from the unorganized sector, comprising of commission agents, friends, relatives or through own sources. Large farmers or traders are an integral credit source for small and marginal farmers. This is because of mutual trust and understanding that has developed over the years. Getting credit for them is also easier and quicker as compared to taking loans from banks, which requires large amounts of paper work. Large farmers borrow only (30 to 35)% of the total cost of production. Of this, (60 to 70)% are borrowed from banks, less than 30% from relatives and none at all from commission agents.
In terms of schemes for farmers, government provides 90% subsidy on drip irrigation, the total cost of which is INR 25,000 per acre. However, the effective subsidy is just 70%; the 20% goes to middlemen. Farmers also get support in production technologies—precision farming, pest management, and drip irrigation. The government also provides subsidy for mulching, the practice of covering the soil with black polythene to protect the tomato crops.
Onion Farmers in Nashik, Maharashtra
In the comparatively developed region of Nashik in Maharashtra, farmers do have access to banking facilities and use Kisan Credit Cards (KCC). THE MSAMB implements a pledge loan scheme at 3% per annum against warehouse receipts through the APMCs for the benefit of farmers. District co-operative banks in every village is a major source of financing; however, (30–40)% of farmers have shifted towards nationalized banks as district co-operative banks are loss-making and many are shutting down. There is also a provision of a crop loan of INR 30,000 per acre for onions. This is the minimum amount; the amount increases over time if instalments are paid regularly. An interest rate of 7% is charged for crop loan up to INR 3 lakhs and there is a rebate of 2% for regular repayment. After the initial INR 3 lakhs crop loan, farmers get a cash credit loan at an interest rate of (10–11)% by nationalized banks and 12% by private banks.
During the field visit, APMC officials said that both in Lasalgaon and Pimpalgaon, there is no role for commission agents as money lenders. According to some farmers we spoke to, however, commission agents or other informal sources of financing are approached when it is not possible to get loans from banks due to non-payment of dues.
Onion Farmers in Mahuva, Gujarat
In Mahuva, banks provide loans at an interest rate of 7%. However, commission agents, who charge a monthly interest rate of around (2–3)%, are an important source of credit for farmers, Farmers, even if they have kisan credit cards, depend on commission agents for financing, at least, in part because they may have defaulted on bank loans. They are also discouraged by the long paper work required for availing bank credit.
Potato Farmers in Agra, Uttar Pradesh
The field visits to Agra threw up interesting insights about the financing of the potato value chain. We found that most farmers have a kisan credit card (KCC) but as most of them fail to repay loans on time, they end up paying higher and penal rates of interest (7% or more). The failure to repay can be attributed to farmers using crop loans for consumption purposes or to repay existing loans from informal sources. Even if farmers do not default, the loan amount received is often not enough for small farmers and they have to resort to some degree of informal borrowing. Due to a bumper crop, farmers received little return for their produce which has increased the dependence of many small and marginal farmers on sahukars (money lenders). The sahukars, many of them large farmers, charge a minimum of 2% per month (this could go as high as 5% per month in some cases). The transactions are based on and dictated by personal relationships.
Cold storage owners are another source of financing for farmers. They charge as much as the sahukars (around 2% per month). The cold storages, in turn, avail the overdraft facility given by banks to lend to farmers. This enables cold storage owners to earn arbitrage since the interest rate they charge from farmers is twice to five times higher than what they pay to the bank. Besides, the practice of not providing proper receipts to farmers for the potatoes stored makes it difficult for farmers to access other sources of credit. As Agra is home to a large number of cold storages for potato, a warehouse receipt system should be made compulsory to help farmers access low-cost finance.
Potato Farmers in Nalanda, Bihar
Nalanda in Bihar is a hub for vegetable farming; however, vegetable growers are not able to take loans, primarily because banks view vegetables as a high-risk activity and because of the high proportion of defaults by vegetable farmers. Besides, many farmers find it difficult to get a Land Possession Certificate (LPC), especially when land records are in names of fathers/grandfathers, making it difficult for them to avail bank loans. Hence, a very limited number of farmers who have proper land records are able to take formal loans. The interest rate charged by banks is 4% per annum if premiums are paid on time, but this could go up to (11–12)% per annum if there is a default. Interest rates of loans from non-institutional sources are as high as (2.5–3)% per month.
Because of the lengthy procedure involved in sanctioning farm loans, farmers find it difficult to avail loans from banks when they need it the most, which is just ahead of the sowing season. This forces many to approach non-institutional sources of loans. Besides, due to high incidence of loan defaults, banks are reluctant to lend to farmers. A possible solution is to provide credit through FPOs to minimize defaults. This is a plausible solution as there are large numbers of upcoming FPOs especially after the success of Jeevika led Women Farmer Producer Organizations in Bihar.
3.6.2 Financing of Infrastructure
As mentioned earlier, cold storages in Agra avail overdraft facility given by banks solely for onward lending to potato farmers in Uttar Pradesh are charged around 10–11% per annum by the banks.
Unlike potato farmers in Agra, onion farmers still use non-cold storage structures to store onions. DOGR and NHRDF have developed different kinds of low cost, improved storage structures using bamboos, asbestos, and other materials. While some structures are three sides open, some are open on all sides with ventilation provided at the bottom through a raised platform. Scientists at DOGR and NHRDF claim that these structures are able to reduce post-harvest losses to (15–20)% as compared to the (40–50)% when onions are stored in traditional structures. For the construction of these storage structures, the government provides a subsidy of 25% to farmers under the RKVY (Rashtriya Krishi Vikas Yojana) scheme. The scheme was entrusted to the Maharashtra State Agricultural Marketing Board (MSAMB), which administers it through the APMCs. The storage capacity ranged between 5 MT costing INR 30,000 to 50 MT costing INR 3,00,000.
Another government scheme provides 35% subsidy for the construction of cold storages as credit-linked back-ended subsidy, the cost of which comes to INR 3500 per MT. However, since storing onions in cold storages in Nashik is not yet popular, these are used to store other fruits and vegetables like tomato and grapes.
While existing cold storages are concentrated in few states and (80–90)% of available cold storages are used for potatoes, there is a dire need for cold storages in India. The Ministry of Food Processing Industry is building a National Cold Chain Grid in the country to connect major agricultural producing hubs to cold storage and processing industries. The Cold Chain and Value Addition Infrastructure scheme of MoFPI provides financial support to the tune of INR 10 crores for setting up of such facilities (NCCD 2018).
Onion traders in Nashik get cash credit from banks at an interest rate of 18% per annum. This is done by keeping land as security. Traders reported that the rate of interest charged to them is much higher than that charged to farmers.
As marketing is a key aspect for any value chain, infrastructural development of existing APMCs and setting up of private mandis becomes important. Visits to various APMC mandis during the course of the study revealed that the existing infrastructure of APMCs has run out of its capacity. For example, the largest tomato mandi in Kolar, which caters to more than 4 lakh MT of tomatoes a year, is spread over 20 acres and is overflowing. The mandi requires complete renovation of the existing infrastructure, as well as expansion of the market area.
3.6.3 Financing of Processors
The emergence of Mahuva as a dehydration hub can be attributed to the Gujarat Government’s favourable policy regime. This includes subsidies to dehydration units. The Gujarat Government provides subsidy to cover 25% of the project cost up to INR 50 lakhs to set up such industries. Another interest subsidy of 7% on term loans for micro and small industries has helped in setting up dehydration units in Mahuva.
The Government of India’s SAMPADA (Scheme for Agro-Marine Processing and Development of Agro-Processing Clusters) Yojana, which provides subsidy for setting up food processing units is another scheme which has boosted the food processing sector. It is an ongoing scheme for the food processing sector and has been renamed to Pradhan Mantri Kisan SAMPADA Yojana14 with an allocation of INR 6000 crore for the period 2016–20. This scheme of Ministry of Food Processing Industries (MoFPI) provides a subsidy of 35% of the project cost up to INR 5 crores to set up food processing units. The scheme also covers the setting up of the following:
Mega Food Parks
Integrated Cold Chain and Value Addition Infrastructure
Creation/Expansion of Food Processing and Preservation Capacities
Infrastructure for Agro-processing Clusters
Creation of Backward and Forward Linkages
Food Safety and Quality Assurance Infrastructure
Human Resources and Institutions.
According to MoFPI, PM Kisan SAMPADA Yojana was expected to leverage investment of INR 31,400 crore for handling of 334 lakh MT of agro-produce valued at INR 1,04,125 crore, benefiting 20 lakh farmers and generating 5,30,500 direct/indirect employment in the country by the year 2019–20” (MoFPI 2018).
3.7 Conclusion and Policy Recommendation
In this chapter, we highlight the fact that despite being the second-largest producer of TOP vegetables, we have stopped well short of securing a good deal for our farmers. During a bumper crop, farmers struggle to cover their cost of production. The primary reason for this is inefficient and fragmented value chains, which lead to low returns for farmers. Hence, to bring efficiency in the value chain of tomatoes, onions and potatoes, policy recommendations should address the challenges faced at each stage of the value chain from seeds to final consumption. In our analysis based on the CISS-F framework, we seek to highlight the difference marketing reforms can make on farm incomes.
First, we recommend some generic policy measures followed by recommendations specific to each of the TOP vegetables.
Generic Policy Recommendations for TOP
1.
Extension services: The horticulture sector throughout the country suffers from serious gaps in extension services, which partly accounts for the uneven quality of produce and the abnormally high post-harvest losses. Government extension services are focused on cereal crops and private sector capacity has not grown adequately. Yet, without massive effort to skill horticulture farmers, integrated value chains are unlikely to emerge to link producers to end markets. Operationalising a system of tax incentives to the private sector specifically to invest in extension services will help. While such a step should cover all sub-sectors of agriculture, it is most likely to attract private investment in the fast-growing areas of horticulture, poultry, livestock and dairy farming. Something like 150% tax deduction for eligible investments is likely to result in significant private interest in this area. At the same time, public extension services should also be revamped to focus on horticulture in general, and TOP crops in particular. This is an essential pre-requisite for the emergence of integrated value chains for these crops.
2.
Agriculture credit:Agriculture credit for horticulture crops is another area which requires focused attention. Short-term crop credit is available only for crop husbandry, leaving horticulture farmers largely at the mercy of informal credit suppliers. This study has validated evidence from other sources that market intermediaries (or mandi agents) are one of the primary sources of credit for horticulture cultivation. This makes the cost of cultivation unsustainably high, as interest rates on informal credit range between (24–48)% per annum. Providing access to institutional credit through kisan credit cards (KCC), SHG-bank linkage, and channelizing credit through FPOs is the way forward to address this challenge.
3.
Mechanization: The scope for mechanization to reduce production costs and wastage has not been adequately leveraged in horticulture. This is especially true of the TOP vegetables. From seeding to harvest and storage, mechanization is widely used even in our neighbourhood, especially in China. A focused policy on accelerating the scope of mechanisation in the TOP crops should be the forerunner for a sector-wide approach to increase farmers’ access to hired mechanical aids. This is especially critical if we hope to break into export markets for these crops, where our competitors with a higher level of mechanization are able to meet the exacting demand of buyers.
4.
Farmer Collectives: The typical vegetable farmer being small, the organization of producers into collectives such as farmer producer companies and co-operatives is vital to attract market players at the backend. The experience of the past few years shows that farmers’ collectives have been successful in many instances in increasing the bargaining power of small producers in accessing capital, technology and markets. Current efforts to promote FPOs should be accelerated, with a cluster approach in the case of horticulture to attract processors, exporters, modern retail and others to source produce from the farm gate.
5.
Risk insurance: To insure producers and exporters of TOP vegetables against risks, there is need for the creation of a formal advisory body that can assess the credit worthiness of all stakeholders within the value chain. This credit rating will help producers and exporters to identify traders to deal with, based on their credit worthiness. Insurance products that can help farmers in times of distress or adverse weather conditions should be promoted and these should be available to farmers at affordable premium rates. Promotion of commodity derivatives and futures trading in TOP can be another way to hedge risks for farmers.
Tomato Value Chain
1.
Private companies have done well in introducing different varieties of hybrid and disease-resistant seeds. However, in the absence of a strong intellectual property rights (IPR) regime, private companies find no incentive to further invest in seed research as copying of genetic material of seed developed after years of research by a company is very common in India. Hence, there is need to strengthen the IPR regime for tomato seeds.
2.
Indian tomato yields are very low as compared to yields in European countries. There is a need for large scale adoption of polyhouses to enhance the yield of Indian tomatoes. This will help create a continuous cycle of tomato crop, and also help protect crop from pest attacks. Frequent spraying of pesticides makes Indian tomatoes unhealthy for domestic consumers, and non-tradable in the international market. As polyhouse construction is capital intensive, government can subsidise such investments for individual large and medium farmers, or small and marginal farmers through FPOs, who are willing to adopt this technology.
3.
Tomato exports from India are very limited, despite India being the second-largest producer in the world. A high degree of pesticide residue in the vegetables makes it non-exportable in the world market and the exports remain limited to our neighbouring countries. Precision farming that allows farmers to improve their farming practices and harvest safe and quality produce, need to be encouraged and incentivized. Education and awareness about the negative impact of heavy usage of agro chemicals need to be stepped up through FPOs and organizations working directly with farmers.
4.
FPOs can be encouraged to set up small-scale processing plants to produce tomato pulp and puree to supply to large-scale ketchup manufacturing plants. This will ensure surplus production is sold by farmers at remunerative prices and they benefit from direct marketing opportunities.
5.
The monopoly of APMC can be tackled by allowing private mandis on PPP basis or by developing other marketing channels. The FPTC and FAPAFS Acts enacted by the Parliament in September 2020, will make it easier for private sector to set up mandis. This will give farmers a wider choice to sell their produce at remunerative prices as well as render APMC markets to become more competitive and improve their infrastructure and services.
6.
Aggregation facilities for tomatoes should be done at farm-level itself with assaying, sorting and grading based on size, colour and texture and packaging with tinker proof bar codes for easy traceability.
Onion Value Chain
1.
Even though cold storages are able to reduce post-harvest losses by 5%, these are not popular in India. There is need for dry storage on-or near the farm, preferably owned by farmers. Only Maharashtra has invested to some extent in this area. Hence, there is need to invest in the creation of scientific dry storages for onions, especially, in Madhya Pradesh, which has a huge infrastructure gap and has no policy to increase farm level storage.
2.
An aggressive expansion of the area under onion with focus on states of Bihar, Odisha, Assam, and Chhattisgarh, will help cater to demand in east and north-east India, Nepal, and Bangladesh. It will reduce the need to transport onion at huge energy and financial costs across the country from Maharashtra, and create alternative crop choices for farmers in eastern India. But the foray into eastern India must be preceded by varietal trials to select the best varieties, extension, development of storage and supply chain infrastructure, and credit facilities. Leveraging private investment to expand onion value chains in new geographies, and strengthening processing and marketing segments within these value chains can provide diversified income opportunities for the farmers.
3.
There is need for popularizing dehydrated onions among Indian consumers through ad campaigns. Dehydrated onions could be affordable substitute for fresh onions, when prices escalate very sharply. Also, with changing lifestyle and consumer preference, domestic market for dehydrated onions can take off. The dehydrating industry in Mahuva, Gujarat is quite large, but it mainly caters to the overseas market. Even when the quality of the product meets international standards, prices are not very remunerative because of oversupply and the business is not structured. Boosting domestic demand and creating an organized market will further promote the onion dehydration industry, benefit farmers in terms of assured remunerative prices, as well as potentially address the consumer inflation woes.
4.
There should be an overhaul of India’s onion trade policy. Instead of imposing minimum export price as and when onion price starts rising, government should instead allow imports. The minimum export price policy for onion not only affects India’s image as a credible exporter, but also deprives onion farmers the benefit of higher prices in the international market.
5.
For export purposes, India can cultivate foreign varieties of onion, which are bigger in size and less pungent and hence, less popular in the Indian market. These varieties could be grown to cater to the global market exclusively for export purposes through contract farming.
6.
FPOs can play an effective role in promoting collective farming of onions marketed as fresh as well as dehydrated. Direct marketing linkages and/or contract farming will allow farmers to benefit from economies of scale and fair price realization. Existing government schemes and financial support can be made available to the farmers through such farmer collectives to promote onion farming as well as processing and marketing. There should be a mechanism where farmers can enter into contract farming with dehydration units so that they are able to fetch a better price for their produce, which otherwise is too low.
Potato Value Chain
1.
Inadequate investments in research of table and processing varieties of potato in India needs to be addressed to overcome the issues related to yield stagnation due to varietal reasons; threat of widespread viral and pest borne diseases; excessive use of agro chemicals; among others. While CPRI, Shimla has been leading the R&D in potato, there is scope for bringing in the private sector in R&D to end the monopoly of CPRI, Shimla.
2.
Potato farmers’ especially in Uttar Pradesh and Bihar can be organised into farmer producer organizations (FPOs), which can help them secure quality inputs at cheaper costs. During our field visits, farmers complained about their being fleeced by input traders dealing in seed, fertilizers, and other agro chemicals. FPOs can enable farmers to access organized markets for agri inputs as well as create awareness among them about the right farm practices. For instance, farmers can be linked to entities like Mahindra-HZPC,15 which can provide access to high-quality seed. Finance can be made available to farmers through these FPOs, which can help farmers take care of their agri credit requirements and address issues related to default to a large extent. FPOs can also help farmers access custom hiring centres or other rental models to adopt mechanization on their farms. Large scale mechanization can help them improve farm efficiency as well as reduce cost of labour.
3.
Cold storage plays an important role in the potato value chain. However, the cold storage infrastructure deficit and spatial mismatch needs to be corrected. For example, Bihar with a 14% share in potato production, accounts for only 4% of the total cold storage capacity in the country. There is urgent need to set up cold storage facilities in Nalanda, and other potato producing districts in the state. Financial incentives for setting up of energy-efficient, solar powered cold storages would help the cold storage owners reduce their operational costs and make cold storage more affordable for the farmers. Farmers’ direct access to cold storage enables him to access institutional credit at affordable interest rates. It also saves the farmers from distress sale of his produce during peak arrival months. Cold storage units registered under the Warehouse Development and Regulatory Authority (WDRA) can issue negotiable warehouse receipts (NWRs) and eNWRs to the farmers, which can serve as a collateral for the banks and enable the farmer to meet his credit needs.
4.
Efforts should be made to give potato processing in India a boost. The number of registered fruit and vegetable (F&V) processing units in the top potato producing states like Uttar Pradesh (42), West Bengal (58) and Bihar (7) are a small fraction of the total (1256) (ASI, 2020). Agra and Nalanda, two of the largest potato producing districts of India, do not have a single processing unit. India can benefit from increased potato processing, given that demand for processed potato products is set to increase. For example, India is a net importer of potato starch and could benefit from higher domestic production.
5.
A robust export policy for potato needs to be developed. India exported a measly 0.37 million tonnes of a total production of 53 million tonnes in TE 2018–19. This is explained by high domestic consumption, and India’s inability to project itself as a credible and consistent supplier of quality potatoes. The frequent imposition and removal of MEPs is testimony to this apathetic approach in promoting potato exports. Agriculture Export Policy announced in December 2018 to promote exports of agricultural commodities, highlights the potential of potato for exports.
6.
Agricultural marketing reforms that promote contract farming, direct marketing, farmer markets, among others need to be adopted and implemented by the states, which have not done so far. The FPTC and FAPAFS laws provide the legal pathway to bring about these reforms that can benefit the farmers in terms of greater market access, fair price discovery and higher price realization.
Open Access This chapter is licensed under the terms of the Creative Commons Attribution 4.0 International License (http://creativecommons.org/licenses/by/4.0/), which permits use, sharing, adaptation, distribution and reproduction in any medium or format, as long as you give appropriate credit to the original author(s) and the source, provide a link to the Creative Commons license and indicate if changes were made.
The images or other third party material in this chapter are included in the chapter’s Creative Commons license, unless indicated otherwise in a credit line to the material. If material is not included in the chapter’s Creative Commons license and your intended use is not permitted by statutory regulation or exceeds the permitted use, you will need to obtain permission directly from the copyright holder.
LOGEST function gives the best fitted line for an exponential curve. This method was preferred over the general CAGR formula as the latter only gives the growth rates based on the initial and final values.