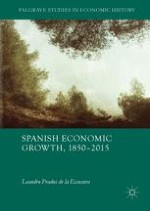
Aggregate economic activity multiplied fifty times between 1850 and 2015, at an average cumulative growth rate of 2.4% per year (Fig. 1.1).
Fig. 1.1
Real GDP at market prices, 1850–2015 (2010 = 100) (logs)
×
Aggregate economic activity multiplied fifty times between 1850 and 2015, at an average cumulative growth rate of 2.4% per year (Fig. 1.1). Four main phases may be established: 1850–1950 (with a shift to a lower level during the Civil War, 1936–1939), 1950–1974, 1974–2007 and 2007–2015, in which the growth trend varied significantly (Table 2.1).1 Thus, in the phase of fastest growth, the Golden Age (1950–1974), GDP grew at 6.3% annually, four and a half times faster than during the previous hundred years and twice faster than over 1974–2007, while the Great Recession represented a fall in real GDP between 2007 and 2013 (8%), and the 2007 level had not been recovered by 2015. Gross Domestic Income (GDI), that is, income accruing to those living in Spain, as opposed to output produced in Spain, shadows closely GDP evolution.
A look at the evolution of output and expenditure components of GDP provides valuable information about its determinants. Changes in the composition of demand are highly revealing of the deep transformation experienced by Spain’s economy over the last two centuries.
Anzeige
The share of total consumption in GDP remained stable at a high level up to the late 1880s, followed by a decline that reached beyond World War I (Fig. 1.2). Then, it recovered in the early 1920s, helped by the rise in government consumption (Fig. 1.2, right scale), stabilizing up to mid-1930s. The Civil War (1936–1939) and World War II (even if Spain was a non-belligerent country) accounted for the contraction in private consumption and the sudden and dramatic increase in government consumption shares in GDP. The share of total consumption only fell below 85% of GDP after 1953, when a long-run decline was initiated reaching a trough (at three-fourths of GDP) by the mid-2000s. Such a decline in the GDP share of total consumption conceals an intense decline in private consumption (which contracted from 75% of GDP in 1965 to a historical trough, 56%, in 2009) paralleled by a sustained rise in government consumption (which jumped from a 7.5% trough in the mid-1960s to a 20% peak in 2009–2010) that resulted from the expansion of the welfare state and the transformation of a highly centralized state into a de facto federal state (Comín 1992, 1994).
Fig. 1.2
Private, government and total consumption as shares of GDP, 1850–2015 (% GDP) (current prices)
×
Investment oscillated around 5% of GDP in the second half of the nineteenth century except during the late 1850s and early 1860s railways construction boom, when it doubled (Fig. 1.3). From the turn of the century, a long-term increase took place with the relative level of capital formation increasing from around 5 to above 30% of GDP in 2006. Phases of investment acceleration appear to be associated with those of faster growth in aggregate economic activity, namely the late-1850s and early 1860s, the 1920s, from the mid-1950s to the early 1970s, and between Spain’s accession to the European Union (EU) (1985) and 2007. Nonetheless, the long-run increase was punctuated by reversals during the World Wars and the Spanish Civil War, the transition to democracy (1975–1985), which coincided with the oil shocks, and the Great Recession (2008–2013).
Fig. 1.3
Capital formation as a share of GDP, 1850–2015 (%) (current prices)
×
The breakdown of gross domestic fixed capital formation shows the prevalence of residential and non-residential construction as its main components over time, with a gradual rise of the share of more productive assets (machinery and transport equipment) during the twentieth century up to 1974 that stabilized thereafter (Fig. 1.4). The urbanization and industrialization push in the 1920s and between 1950 and the early 1970s reflects clearly across different types of assets. It is worth noting the increase in the share of infrastructure after Spain’s accession to the EU and the residential construction bubble between the late 1990s and 2007.
Fig. 1.4
Fixed capital formation and its composition, 1850–2015 (% GDP) (current prices)
×
The exposition of Spain to the international economy also increased but following a non-monotonic pattern, with three main phases: a gradual rise in openness (that is, exports plus imports as a share of GDP) during the second half of the nineteenth century that at the beginning of the twentieth century stabilized at a high plateau up to 1914; this was followed by a sharp decline from the early 1920s to mid-century that reach a trough during World War II (Fig. 1.5). A cautious but steady process of integration in the international economy took place since the 1950s, facilitated by the reforms associated with the 1959 Stabilization and Liberalization Plan.
Fig. 1.5
Openness: exports and imports shares in GDP (%) (current prices)
×
Anzeige
How gradual was the post-1950 recovery is shown by the fact that only in 1955 the level of openness of 1929 was reached and that the historical maximum of the pre-World War I years was overcome in 1970. It took longer for exports than for imports to recover pre-World War I relative size (only in 1980 that of the 1910s was overcome). Spain’s increasing openness during the last four decades suffered, nonetheless, reversals in the second half of the 1980s and, again, in the 2000s as a result of a contraction in exports.
It is worth mentioning the concordance observed between investment and imports, which suggests a connection between economic growth and exposure to international competition (Fig. 1.6). Furthermore, phases of more intense imports and investment are also those of deficit in the balance of goods and services, which suggests an inflow of capitalcapital and a link between the external sector and capital formation.
Fig. 1.6
Gross fixed capital formation and imports, 1850–2015 (8% GDP) (current prices)
×
The composition of GDP by sectors of economic activity between 1850 and 2015 highlights the transformations associated with modern economic growth (Fig. 1.7).
Fig. 1.7
GDP composition from the output side (%) (current prices)
×
Agriculture’s share underwent a sustained contraction over time, but for the autarkic reversal of the 1940s, which intensified during the late 1880s and early 1890s, the 1920s and over 1950–1980. Industry, including manufacturing, extractive industries and utilities, followed an inverse U, expanding its relative size up to the late 1920s and, after the 1930s and 1940s backlash, resumed its relative increase to stabilize at a high plateau (around 30% of GDP). Since the mid-1980s, the share of industry dropped sharply, as sheltered and uncompetitive industries collapsed due to liberalization and opening up after EU accession. By 2010, the relative size of industry had shrunk to practically one-half of its peak in the early 1960s. Construction industry remained stable below 5% of GDP until mid-twentieth century (but for expansionary phases in the late 1850s and early 1860s, 1920s and 1950s), exhibiting a sustained increase since the early 1960s that peaked during the mid-2000s, more than doubling its relative size. The end of the construction bubble during the Great Recession implied a return to the mid-1960s relative size.
Services made a high and stable contribution to GDP, fluctuating around 40%, between mid-nineteenth and mid-twentieth century, but for the 1930–1940s parenthesis of depression, civil war and autarky, and expanded from less than one-half to three-fourths of GDP between the early 1960s and 2015.
The evolution of services as a share of GDP in Spain, with a high share of GDP in early stages of development (around 40%), conflicts with the literature on structural change, which suggests a growing contribution of services to GDP as per capita income increases (Chenery and Syrquin 1975; Prados de la Escosura 2007a). A path dependency explanation could be hypothesized as the arrival of American silver remittances in the early modern era (sixteenth and eighteenth centuries), altered the relative prices of tradable and non-tradable goods, in an early experience of ‘Dutch disease’, shifting domestic resources towards non-tradable production (Forsyth and Nicholas 1983; Drelichman 2005).2
Comparing the sectoral composition of GDP to that of labour can be illuminating. Figure 1.8 presents the composition of employment in terms of hours worked across industries.
Fig. 1.8
Employment: hours worked distribution by economic sectors, 1850–2015 (%)
×
Agriculture’s share exhibits a long-run decline from above three-fifths to less than 5% since 2006. It fell more gradually up to 1950—but for the sharp contraction of the 1920s and early 1930s—reverted during the Civil War (1936–1939) and its autarkic aftermath, and accelerated over 1950–1990, when it shrank from half the labour force to one-tenth. Even though its numbers might be over-exaggerated prior to mid-twentieth century due to peasants’ economic activities outside agriculture, agriculture provides the largest contribution to employment up to 1964, when it still represented one-third of total hours worked. The evolution of the relative size of services, whose figures may be underestimated before 1950, for the same reasons of agriculture’s over-exaggeration, presents a mirror image of agriculture, taking over as the largest industry from 1965 onwards and reaching three-fourths of total hours worked by 2015. Industry’s steady expansion, but for the Civil War reversal, overcame agriculture’s share by 1973 and peaked by the late 1970s reaching one-fourth of employment to initiate a gradual contraction that has cut its relative size by almost half by 2015. Construction, in turn, more than trebled its initial share by 2007, sharply contracting as the sector’s bubble ended during the Great Recession.
As already observed in GDP composition, an initial phase of structural change, in which the agricultural sector contracted and that of industry expanded—only broken by the post-war falling behind—was followed by a second phase since 1980, in which the relative decline involved, in addition to agriculture, the industrial sector, while employment in services accelerated its escalation.
Comparing the sectoral distribution of GDP and employment allows us to establish labour productivity (measured as Gross Value Added [GVA] per hour worked) by industry relative to the economy’s average (Fig. 1.9). Several features stand out. Relative industrial productivity increased to reach a plateau over the late 1880s and World War I in which it doubled it. Episodes of intensified industrialization and urbanization in the 1920s and, to a larger extent, between the mid-1950s and mid-1970s, were accompanied by the expansion of industrial employment, which underlies the decline in the relative productivity of industry and services.
Fig. 1.9
Relative labour productivity (GVA per hour worked), 1850–2015 (average labour productivity = 1)
×
Agricultural labour productivity fluctuated between one-half and two-third of the economy’s average (exceptional peaks and troughs aside) and tended to be rather stable. Such stability between 1890 and 1960, hardly affected by the gradual contraction of agricultural share in employment, shows the moderate and gradual structural transformation of the Spanish economy. In the 1960s accelerated industrialization, upheld by capital intensification and the incorporation of new technologies, and industrial restructuring in the late 1970s explain the sharp drop in the relative productivity of the agricultural sector. In turn, the recovery of agriculture’s relative productivity in the late 1980s and early 1990s is attributable to the destruction of agricultural employment that cut its share by half.
The gradual reduction in productivity differences across sectors during the last half a century suggests moderate convergence in factor proportions and could be interpreted as a result of improved resource allocation.3
Notes
1.
Main phases defined as deviations from segmented trend estimates with exogenous structural breaks in Prados de la Escosura (2003, 2007b) have been kept here. A change of trend indicates a break in the long-term rate of growth. A change in level, as the drop in economic activity during the Civil War, does not alter the established growth rate.
2.
As the rise of the metropolis’ price level favoured the importation of tradable goods and provoked the dissolution of local industry, while the price increase stimulated the production of goods that were not traded internationally.
3.
Still, the high relative labour productivity of services during the hundred years spanning 1850–1950 calls for a revision of the sectoral distribution of employment and could be ventured that a more rigorous calculation would reveal a lesser proportion of employment in agriculture and a greater one in services, with consequent repercussions on the relative productivity of labour in each sector.
Open Access This chapter is licensed under the terms of the Creative Commons Attribution 4.0 International License (http://creativecommons.org/licenses/by/4.0/), which permits use, sharing, adaptation, distribution and reproduction in any medium or format, as long as you give appropriate credit to the original author(s) and the source, provide a link to the Creative Commons license and indicate if changes were made.
The images or other third party material in this chapter are included in the chapter’s Creative Commons license, unless indicated otherwise in a credit line to the material. If material is not included in the chapter’s Creative Commons license and your intended use is not permitted by statutory regulation or exceeds the permitted use, you will need to obtain permission directly from the copyright holder.